by Jason Bodner
May 31, 2023
The explosion was completely unexpected, but how often are explosions on planes expected?
I always fly in the window seat – a leftover habit from when I was a kid. I still love to look out into the expanse. Only this time, I hated what I saw: The lightning was too close, and it hit one of the plane’s engines. It was engulfed in flames. Things suddenly got bumpy.
The bell went off.
The fasten seat belt sign came on.
While everyone fiddled with their buckle, I saw something they always explain but I never expected to see. The panel over my head exploded and oxygen masks tumbled out. This happened in a sudden burst in my field of view, like a swarm of dead jellyfish attacking with tubes, bags, and yellow cups cascading out.
I nervously started laughing – a bad reaction in tense times, I admit. While I went for my mask, the woman next to me signed a cross from head to chest and across. Her prayer became a muffle when she assumed the crash position, despite not being instructed to do so – at least not yet.
Not liking what I saw out the window, or next to me, I looked right. A flight attendant was moving up the aisle toward the front of the plane. Only she was lumbering slowly, laboring backwards, bent over. She was dragging another flight attendant from under her arms – apparently unconscious – her legs just dragging along. She buckled her in, up front. It seemed no matter where I looked, I hated what I saw.
Clearly, I survived this awful scenario. Our flight from Fort Lauderdale to Newark was forced to land in Charlotte, North Carolina. Kudos to the pilots and crew, as there were no casualties, only some injuries.
Unbelievably, this is not my only disaster survival tale, and not the scariest. But why am I telling it?
It’s simple: if I can calmly survive things like that, then a little market turbulence is nothing.
The latest fear out there is the debt ceiling. It caused selling like we haven’t seen since the start of May. Here, we see that it’s dragging on the BMI. We also see the uptrend in buying of stocks suddenly slowed:
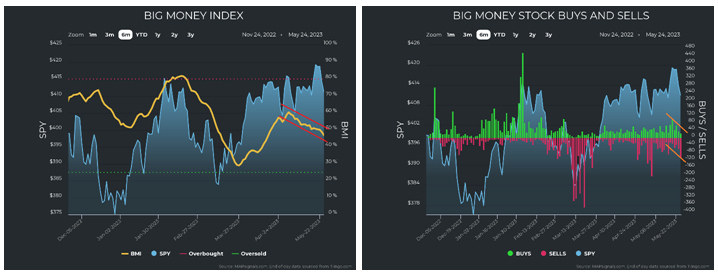
Graphs are for illustrative and discussion purposes only. Please read important disclosures at the end of this commentary.
The debt ceiling debate is a scary proposition. In reality, we all know a deal will emerge. Politicians use potential stalemates like this as a way to embarrass each other and strong-arm their issues.
Rest assured, a deal will get done. There simply isn’t a world in which the U.S. defaults on its debt. To date, Congress has raised the debt ceiling 78 times. Believe me, this will be #79. It’s really a matter of us enduring names getting dragged through the mud and political arm wrestling. It’s their moment on stage!
It’s a perfect time to look at the market facts as well. Earnings season is over, liquidity is low, and breadth is thin. Speaking of earnings, as of May 19th, for Q1’23, 95% of S&P 500 companies reported earnings. Of those reporting, 78% beat earnings and 76% beat sales estimates. Earnings Apocalypse never arrived.
In fact, in many cases, it’s the opposite. Take NVDA for example: it reported an earnings beat of $1.09 vs. $0.92 per share. And revenue was a blowout too, reporting $7.19 billion vs. $6.52 billion estimated. Perhaps the most important thing was that the CEO forecast a 50% increase in quarterly sales. He said that as companies roll out AI on a trillion-dollar infrastructure, NVDA is poised at the forefront to benefit. The buying frenzy that ensued lifted not only Nvidia stock, but the entire sector of technology companies. Chipmakers rose substantially as well, as the Technology sector just continued its strength.
![]()
Graphs are for illustrative and discussion purposes only. Please read important disclosures at the end of this commentary.
The recent selling over the debt ceiling and post-earnings lull didn’t seem to affect tech stocks:
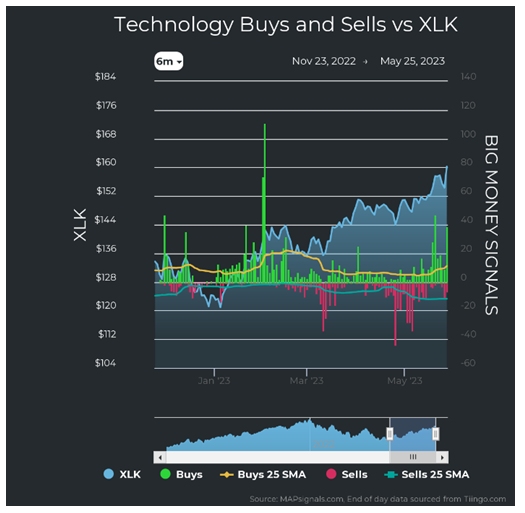
Graphs are for illustrative and discussion purposes only. Please read important disclosures at the end of this commentary.
All other sectors, however, saw selling pressure:
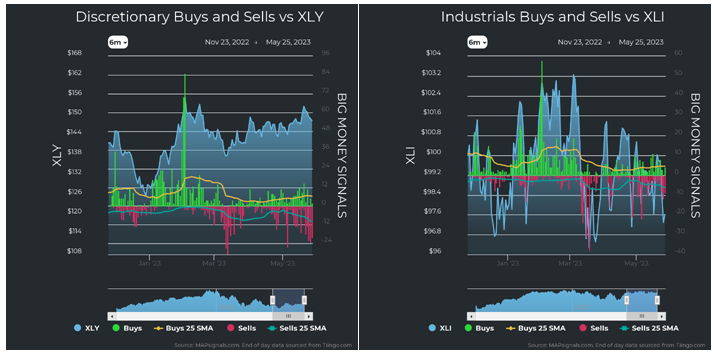
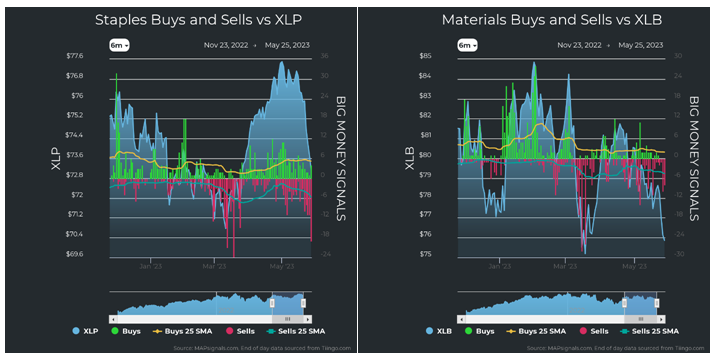
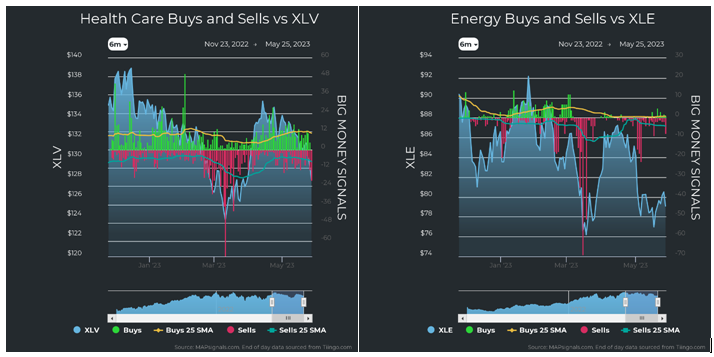
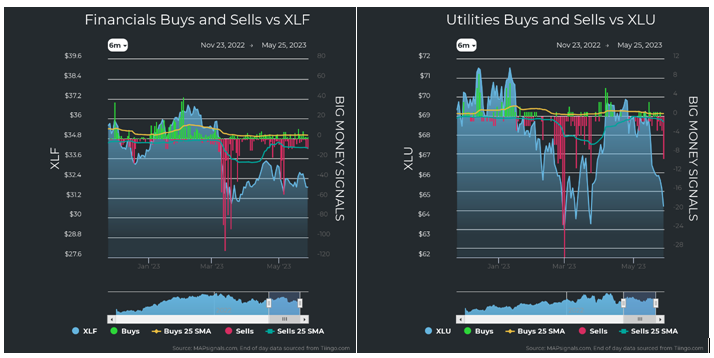
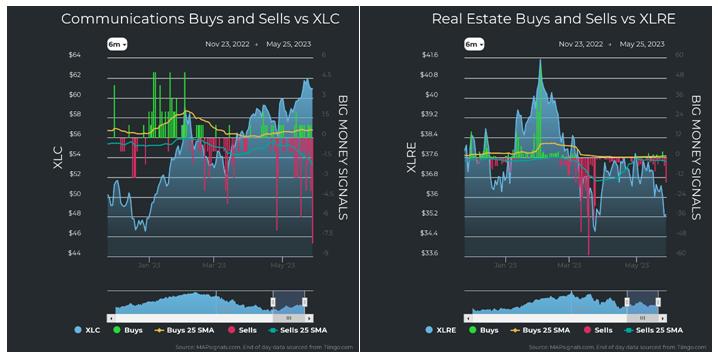
Graphs are for illustrative and discussion purposes only. Please read important disclosures at the end of this commentary.
I believe the selling offered a perfect excuse for short sellers and algorithms to splash around in a thin liquidity market. But the NVDA phenomenon highlights one of the dangers of short selling: if you get caught off-sides, you can be swept up in an entire sector repricing higher. I believe short selling increased in technology stocks as they have been the clear out-performer in recent months. It’s human nature to believe that things can get “too pricey” and ought to come down again. Mean reversion is a real phenomenon, but not a rule written in stone. As we see, a strong tech sector can get even stronger.
That said, we are still in a seasonally weak period of the stock market. Sell in May and go away, has real relevance. As you can see below, summer for all major indexes has been lackluster on average since 1990:
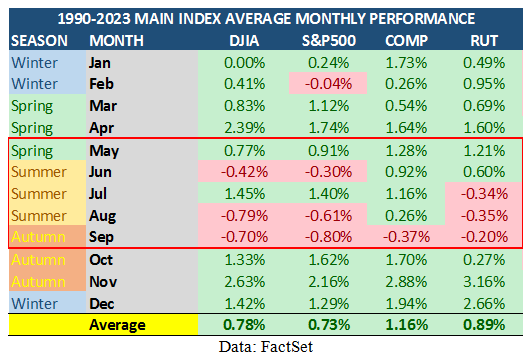
Graphs are for illustrative and discussion purposes only. Please read important disclosures at the end of this commentary.
The bad news is that we may have a turbulent summer. The masks may even come down. But the good news is that this would only set us up for a strong fourth quarter. October through December is the strong seasonal period of the year, historically. Add this to the likelihood that the Fed is done raising rates, despite recent talk in the media. Also, factor in that we are not even in a recession, technically speaking.
Could this be another case like the “Taper-Tantrum,” when investors sold in anticipation of something that never came? Maybe so, maybe not. But even if it does come, it’s rarely as bad as what we think.
I successfully made it through a flight with an exploded engine, falling oxygen masks, a passed-out flight attendant, and an emergency landing. It wasn’t fun by any means, but it wasn’t as bad as my praying neighbor feared. Fearing market crashes that usually don’t come seems like a terrible waste of energy.
Seneca wisely said, “Our fears are more numerous than our dangers, and we suffer more in our imagination than in reality.”
Navellier & Associates owns Nvidia Corp (NVDA), in managed accounts. Jason Bodner owns Nvidia Corp (NVDA) personally.
All content above represents the opinion of Jason Bodner of Navellier & Associates, Inc.
Also In This Issue
A Look Ahead by Louis Navellier
June Could Be a Good Month for Our Energy Stocks
Income Mail by Bryan Perry
Recession Resistant Real Estate Valuations are Discounted and Tempting
Growth Mail by Gary Alexander
A Recession is 99% Certain This Year? Don’t Bet on It
Global Mail by Ivan Martchev
“AI.com” Is the New Market Magic Formula
Sector Spotlight by Jason Bodner
Recall All Those Crashes That Never Happened
View Full Archive
Read Past Issues Here

Jason Bodner
MARKETMAIL EDITOR FOR SECTOR SPOTLIGHT
Jason Bodner writes Sector Spotlight in the weekly Marketmail publication and has authored several white papers for the company. He is also Co-Founder of Macro Analytics for Professionals which produces proprietary equity accumulation/distribution research for its clients. Previously, Mr. Bodner served as Director of European Equity Derivatives for Cantor Fitzgerald Europe in London, then moved to the role of Head of Equity Derivatives North America for the same company in New York. He also served as S.V.P. Equity Derivatives for Jefferies, LLC. He received a B.S. in business administration in 1996, with honors, from Skidmore College as a member of the Periclean Honors Society. All content of “Sector Spotlight” represents the opinion of Jason Bodner
Important Disclosures:
Jason Bodner is a co-founder and co-owner of Mapsignals. Mr. Bodner is an independent contractor who is occasionally hired by Navellier & Associates to write an article and or provide opinions for possible use in articles that appear in Navellier & Associates weekly Market Mail. Mr. Bodner is not employed or affiliated with Louis Navellier, Navellier & Associates, Inc., or any other Navellier owned entity. The opinions and statements made here are those of Mr. Bodner and not necessarily those of any other persons or entities. This is not an endorsement, or solicitation or testimonial or investment advice regarding the BMI Index or any statements or recommendations or analysis in the article or the BMI Index or Mapsignals or its products or strategies.
Although information in these reports has been obtained from and is based upon sources that Navellier believes to be reliable, Navellier does not guarantee its accuracy and it may be incomplete or condensed. All opinions and estimates constitute Navellier’s judgment as of the date the report was created and are subject to change without notice. These reports are for informational purposes only and are not a solicitation for the purchase or sale of a security. Any decision to purchase securities mentioned in these reports must take into account existing public information on such securities or any registered prospectus.To the extent permitted by law, neither Navellier & Associates, Inc., nor any of its affiliates, agents, or service providers assumes any liability or responsibility nor owes any duty of care for any consequences of any person acting or refraining to act in reliance on the information contained in this communication or for any decision based on it.
Past performance is no indication of future results. Investment in securities involves significant risk and has the potential for partial or complete loss of funds invested. It should not be assumed that any securities recommendations made by Navellier. in the future will be profitable or equal the performance of securities made in this report. Dividend payments are not guaranteed. The amount of a dividend payment, if any, can vary over time and issuers may reduce dividends paid on securities in the event of a recession or adverse event affecting a specific industry or issuer.
None of the stock information, data, and company information presented herein constitutes a recommendation by Navellier or a solicitation to buy or sell any securities. Any specific securities identified and described do not represent all of the securities purchased, sold, or recommended for advisory clients. The holdings identified do not represent all of the securities purchased, sold, or recommended for advisory clients and the reader should not assume that investments in the securities identified and discussed were or will be profitable.
Information presented is general information that does not take into account your individual circumstances, financial situation, or needs, nor does it present a personalized recommendation to you. Individual stocks presented may not be suitable for every investor. Investment in securities involves significant risk and has the potential for partial or complete loss of funds invested. Investment in fixed income securities has the potential for the investment return and principal value of an investment to fluctuate so that an investor’s holdings, when redeemed, may be worth less than their original cost.
One cannot invest directly in an index. Index is unmanaged and index performance does not reflect deduction of fees, expenses, or taxes. Presentation of Index data does not reflect a belief by Navellier that any stock index constitutes an investment alternative to any Navellier equity strategy or is necessarily comparable to such strategies. Among the most important differences between the Indices and Navellier strategies are that the Navellier equity strategies may (1) incur material management fees, (2) concentrate its investments in relatively few stocks, industries, or sectors, (3) have significantly greater trading activity and related costs, and (4) be significantly more or less volatile than the Indices.
ETF Risk: We may invest in exchange traded funds (“ETFs”) and some of our investment strategies are generally fully invested in ETFs. Like traditional mutual funds, ETFs charge asset-based fees, but they generally do not charge initial sales charges or redemption fees and investors typically pay only customary brokerage fees to buy and sell ETF shares. The fees and costs charged by ETFs held in client accounts will not be deducted from the compensation the client pays Navellier. ETF prices can fluctuate up or down, and a client account could lose money investing in an ETF if the prices of the securities owned by the ETF go down. ETFs are subject to additional risks:
- ETF shares may trade above or below their net asset value;
- An active trading market for an ETF’s shares may not develop or be maintained;
- The value of an ETF may be more volatile than the underlying portfolio of securities the ETF is designed to track;
- The cost of owning shares of the ETF may exceed those a client would incur by directly investing in the underlying securities; and
- Trading of an ETF’s shares may be halted if the listing exchange’s officials deem it appropriate, the shares are delisted from the exchange, or the activation of market-wide “circuit breakers” (which are tied to large decreases in stock prices) halts stock trading generally.
Grader Disclosures: Investment in equity strategies involves substantial risk and has the potential for partial or complete loss of funds invested. The sample portfolio and any accompanying charts are for informational purposes only and are not to be construed as a solicitation to buy or sell any financial instrument and should not be relied upon as the sole factor in an investment making decision. As a matter of normal and important disclosures to you, as a potential investor, please consider the following: The performance presented is not based on any actual securities trading, portfolio, or accounts, and the reported performance of the A, B, C, D, and F portfolios (collectively the “model portfolios”) should be considered mere “paper” or pro forma performance results based on Navellier’s research.
Investors evaluating any of Navellier & Associates, Inc.’s, (or its affiliates’) Investment Products must not use any information presented here, including the performance figures of the model portfolios, in their evaluation of any Navellier Investment Products. Navellier Investment Products include the firm’s mutual funds and managed accounts. The model portfolios, charts, and other information presented do not represent actual funded trades and are not actual funded portfolios. There are material differences between Navellier Investment Products’ portfolios and the model portfolios, research, and performance figures presented here. The model portfolios and the research results (1) may contain stocks or ETFs that are illiquid and difficult to trade; (2) may contain stock or ETF holdings materially different from actual funded Navellier Investment Product portfolios; (3) include the reinvestment of all dividends and other earnings, estimated trading costs, commissions, or management fees; and, (4) may not reflect prices obtained in an actual funded Navellier Investment Product portfolio. For these and other reasons, the reported performances of model portfolios do not reflect the performance results of Navellier’s actually funded and traded Investment Products. In most cases, Navellier’s Investment Products have materially lower performance results than the performances of the model portfolios presented.
This report contains statements that are, or may be considered to be, forward-looking statements. All statements that are not historical facts, including statements about our beliefs or expectations, are “forward-looking statements” within the meaning of The U.S. Private Securities Litigation Reform Act of 1995. These statements may be identified by such forward-looking terminology as “expect,” “estimate,” “plan,” “intend,” “believe,” “anticipate,” “may,” “will,” “should,” “could,” “continue,” “project,” or similar statements or variations of such terms. Our forward-looking statements are based on a series of expectations, assumptions, and projections, are not guarantees of future results or performance, and involve substantial risks and uncertainty as described in Form ADV Part 2A of our filing with the Securities and Exchange Commission (SEC), which is available at www.adviserinfo.sec.gov or by requesting a copy by emailing info@navellier.com. All of our forward-looking statements are as of the date of this report only. We can give no assurance that such expectations or forward-looking statements will prove to be correct. Actual results may differ materially. You are urged to carefully consider all such factors.
FEDERAL TAX ADVICE DISCLAIMER: As required by U.S. Treasury Regulations, you are informed that, to the extent this presentation includes any federal tax advice, the presentation is not written by Navellier to be used, and cannot be used, for the purpose of avoiding federal tax penalties. Navellier does not advise on any income tax requirements or issues. Use of any information presented by Navellier is for general information only and does not represent tax advice either express or implied. You are encouraged to seek professional tax advice for income tax questions and assistance.
IMPORTANT NEWSLETTER DISCLOSURE:The hypothetical performance results for investment newsletters that are authored or edited by Louis Navellier, including Louis Navellier’s Growth Investor, Louis Navellier’s Breakthrough Stocks, Louis Navellier’s Accelerated Profits, and Louis Navellier’s Platinum Club, are not based on any actual securities trading, portfolio, or accounts, and the newsletters’ reported hypothetical performances should be considered mere “paper” or proforma hypothetical performance results and are not actual performance of real world trades. Navellier & Associates, Inc. does not have any relation to or affiliation with the owner of these newsletters. There are material differences between Navellier Investment Products’ portfolios and the InvestorPlace Media, LLC newsletter portfolios authored by Louis Navellier. The InvestorPlace Media, LLC newsletters contain hypothetical performance that do not include transaction costs, advisory fees, or other fees a client might incur if actual investments and trades were being made by an investor. As a result, newsletter performance should not be used to evaluate Navellier Investment services which are separate and different from the newsletters. The owner of the newsletters is InvestorPlace Media, LLC and any questions concerning the newsletters, including any newsletter advertising or hypothetical Newsletter performance claims, (which are calculated solely by Investor Place Media and not Navellier) should be referred to InvestorPlace Media, LLC at (800) 718-8289.
Please note that Navellier & Associates and the Navellier Private Client Group are managed completely independent of the newsletters owned and published by InvestorPlace Media, LLC and written and edited by Louis Navellier, and investment performance of the newsletters should in no way be considered indicative of potential future investment performance for any Navellier & Associates separately managed account portfolio. Potential investors should consult with their financial advisor before investing in any Navellier Investment Product.
Navellier claims compliance with Global Investment Performance Standards (GIPS). To receive a complete list and descriptions of Navellier’s composites and/or a presentation that adheres to the GIPS standards, please contact Navellier or click here. It should not be assumed that any securities recommendations made by Navellier & Associates, Inc. in the future will be profitable or equal the performance of securities made in this report.
FactSet Disclosure: Navellier does not independently calculate the statistical information included in the attached report. The calculation and the information are provided by FactSet, a company not related to Navellier. Although information contained in the report has been obtained from FactSet and is based on sources Navellier believes to be reliable, Navellier does not guarantee its accuracy, and it may be incomplete or condensed. The report and the related FactSet sourced information are provided on an “as is” basis. The user assumes the entire risk of any use made of this information. Investors should consider the report as only a single factor in making their investment decision. The report is for informational purposes only and is not intended as an offer or solicitation for the purchase or sale of a security. FactSet sourced information is the exclusive property of FactSet. Without prior written permission of FactSet, this information may not be reproduced, disseminated or used to create any financial products. All indices are unmanaged and performance of the indices include reinvestment of dividends and interest income, unless otherwise noted, are not illustrative of any particular investment and an investment cannot be made in any index. Past performance is no guarantee of future results.