by Gary Alexander
May 31, 2023
“Even as generals often prepare to fight the last war, our economists and others have given considerable attention today to preparing measures for combatting the last depression.” – Journal of Politics (1949)
The Conference Board – which has a 100% success rate in predicting recessions – is 99% certain that America will be mired in a recession this year. Their most recent recession probability (published May 10) says the chances “remain near 99% … that economic weakness will intensify and spread more widely throughout the US economy over the coming months, leading to a recession starting in mid-2023.”
They see real GDP declining this quarter (-0.6%) and growing worse (-1.6% in 3Q), and -1.2% in 4Q.
They admit that they were wrong about 2022: “GDP growth defied expectations in late 2022 and early 2023 data has shown unexpected strength,” but “we continue to forecast that GDP growth to contract for three consecutive quarters starting in Q2 2023. Despite better-than-expected consumer spending recently, the Federal Reserve’s interest rate hikes and tightening monetary policy will lead to a recession in 2023.”
But I like 99-1 longshots, like this week’s Game 7 NBA Finals. On Memorial Day, the #2-seed Boston Celtics met the #8-seed Miami Heat in Game 7 of the NBA Eastern finals. No team has ever fallen behind three games to none (like Boston and 150 other teams did) and come back to win it all– but Boston was on the verge of doing that. They failed, but now Miami can be the first #8-seed team to win the Finals!
In 2004, Boston overcame even longer odds. After 85 years of bad luck from trading Babe Ruth to the Yankees, the Red Sox were down 3-0 in games to the Yankees in the AL Championship series, and down 3-2 in the bottom of the 9th, facing future Hall of Fame reliever Mariano Rivera, but Rivera blew the save, and the Red Sox won in the 12th inning. The next night, the Red Sox won in 14 innings, then won two straight in Yankee Stadium, including Game 7 in a romp 10-3, winning 4 straight. Then they beat St. Louis 4 games straight in the World Series to win 8 in a row, breaking the Bambino’s curse with flair. So, Boston is the only city to overcome the 3-0 deficit in both baseball and basketball to win a 7-game series.
So, past tendencies are made to be broken. Yesterday’s rules don’t always apply to the new realities in the marketplace, any more than they apply to Boston sports teams or wars, so I’ll take that 99-to-1 bet that we won’t have a recession in the second half of 2023, despite the expert opinions, and evidence they present.
Past tendencies don’t guarantee the same outcome, and politicians have a way of putting off the day of reckoning. After all, China hasn’t had an official recession in over 45 years. It’s amazing what politicians can do when they keep pouring money into big problems. Kicking cans down the road can work wonders.
The Doomsday crowd never seems to be satisfied unless we’re headed into a recession. For the full 11 years after the Great Recession of 2008-09, pundits kept expecting “the second shoe to drop.” The Fed kept interest rates near zero for the entire eight years of the Obama Administration, with three rounds of Quantitative Easing (QE), since they thought the recovery was so fragile. It took a global pandemic – the worst since 1918 – to finally cause a recession, and that was a man-made business reversal (a forced lockdown) and lasted only one quarter. Ever since then, the negative press has expected a deeper drop.
This time, they say, is different: All the recession ducks are lined up in a row. There can be no question. A recession is 99% certain. Below, I’ll list three of their most convincing reasons – and my rebuttals:
Proof of a Coming Recession – From “Yesterday’s Playbook”
#1: The Conference Board’s Leading Economic Index (LEI) was specifically designed to predict coming recessions. It fell for the 13th consecutive month in April. As you can see, when it dips deeply below zero, a recession is certain to follow. It is well below zero now – and for the last year – without a recession yet.
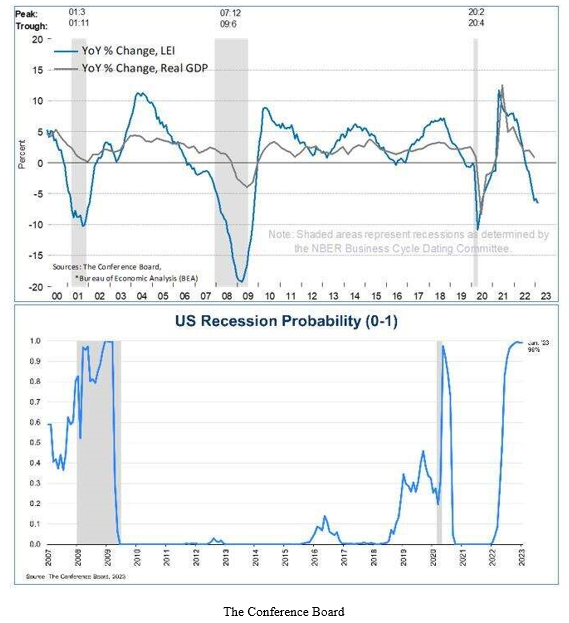
Graphs are for illustrative and discussion purposes only. Please read important disclosures at the end of this commentary.
However, as economist Ed Yardeni reminds us, the 10 LEI components focus on the old manufacturing economy (30% of GDP), not services (70%), but Yardeni says, “The goods side of the economy has been depressed since mid-2022 because consumers have pivoted from buying goods to purchasing services. So, the economy has continued to grow, supported by services and defying the recession heralders.”
True, the manufacturing sector has been in recession, but the services PMI dipped below 50 only once.
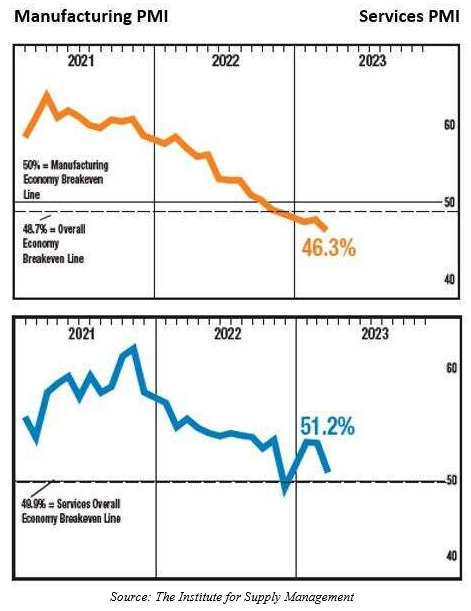
Graphs are for illustrative and discussion purposes only. Please read important disclosures at the end of this commentary.
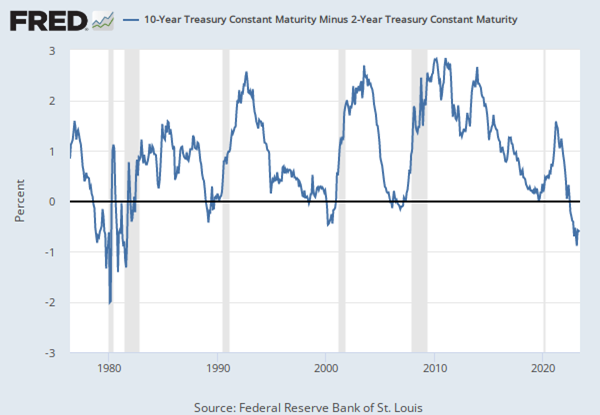
#2: The inverted yield curve. The yield curve inverted before the last four real recessions, in 1981-82, 1990, 2000, and 2008. Even with the artificial 2020 recession, caused by a forced COVID-19 lockdown, the yield curve was neutral before that recession. Today, we have the most inverted yield curve since the double-dip recessions of 1979-82, yet we still stubbornly grow our GDP each quarter since mid-2022.
Graphs are for illustrative and discussion purposes only. Please read important disclosures at the end of this commentary.
The inverted yield curve seems to predict every past recession, but it hasn’t been perfect prior to 1980 and in this case, long-term rates have come down because investors believe the Fed has successfully put a cap on future inflation, which is good news. Declining long-term rates are a bullish sign, not a recession flag.
#3: M2 Money Supply has collapsed at the fastest rate in history – down $1 trillion in the last year – from April 2022 to April 2023, as the Fed has raised interest rates at the fastest rate in history: 500 basis points in just over one year. However, in context, before reducing M2 by $1 trillion, the Fed added $6 trillion in two years, so the net increase in money supply is still $5 trillion, which is a boat load of cash.

Graphs are for illustrative and discussion purposes only. Please read important disclosures at the end of this commentary.
The perma-bears will also cite the decline in trucking traffic, the drop in commodity prices (with a focus on energy), the rise in debt, the rise in jobless claims, and other arcane indicators, but they are all based on historical trends, ignoring the brave new post-pandemic world of (1) slack labor and (2) shock absorbers.
Chicken Little Usually Ignores Our New Response Mechanisms
Predictions of recession usually grab the headlines because bad news sells, but eventually we get tired of all these false prophets. On March 6, Wall Street Journal columnist Nick Timiraos exposed this racket, writing, “Why the Recession Is Always Six Months Away,” observing, “The next economic downturn has become the most anticipated recession in recent U.S. history. It also keeps getting postponed. Recent strong hiring and consumer spending are the latest evidence that the pandemic and the unprecedented policy measures that followed are interfering with the Federal Reserve’s campaign to tame inflation.”
Another reason the recession may be delayed is that Joe Biden wants to get re-elected, and he controls the major money flows. As Timiraos noted, “The government’s stimulus measures left household and business finances in unusually strong shape. … And Americans are splurging on labor-intensive activities they avoided in recent years, including dining out, travel and live entertainment.” In history, those running for re-election, or those wanting their Party to continue in power, were able to postpone the pain.
The worst Depressions in early U.S. history (Panics in 1837, 1893, or 1929) came just after election years.
- Andrew Jackson let his Vice President Martin van Buren inherit the pains in the Panic of 1837.
- Republican Benjamin Harrison let the Democrat Grover Cleveland manage the Panic of 1893.
- Same with Calvin Coolidge. He let Herbert Hoover pay the piper for the Roaring 20s.
On April 27, 2023, Agha Bhattarai wrote in The Washington Post¸ “The recession warnings began in early 2022, when inflation was surging, the economy was shrinking, and consumers were feeling glum. But more than a year in, the long-feared economic downturn still hasn’t materialized.” She listed four reasons: 1) the labor market has been remarkably robust, as “strong hiring has outpaced layoffs that have marred the tech, media and finance industries.” (2) Government stimulus spending boosted personal income and bolstered excess saving. (3) “Even as Americans have stopped buying things, they’ve been happy to splurge on experiences, like restaurants, flights, concerts and ballgames.” And (4) “China’s economy has rebounded remarkably quickly in the months since it relaxed its zero-covid policies.”
We also have what Ed Yardeni calls our economic “shock absorbers,” particularly slack in our labor force, especially our youth and seniors, and the government still throwing money at the citizenry. My own feeling is that with so many youths enjoying “funemployment,” and so many seniors taking early retirement, as soon as they need to earn money again (say, in a down stock market), they will work again.
Yardeni sees the 46.7 million seniors not in the labor force as a gigantic consumer force, with “plenty of savings as well as income from pensions and Social Security. They also have lots of time to eat out, to travel, and to use healthcare services. So, they are spending more on labor-intensive services.” And with the jobless rate still at a 55-year low of 3.4%, you can’t tell me that we’ll be in a recession this quarter!
We are still early in the second Roaring 20s which, like the 1920s, followed a pandemic and depression in 1920, but then proceeded until 1929 without a recession. We could imitate that decade again…if we dare.
All content above represents the opinion of Gary Alexander of Navellier & Associates, Inc.
Also In This Issue
A Look Ahead by Louis Navellier
June Could Be a Good Month for Our Energy Stocks
Income Mail by Bryan Perry
Recession Resistant Real Estate Valuations are Discounted and Tempting
Growth Mail by Gary Alexander
A Recession is 99% Certain This Year? Don’t Bet on It
Global Mail by Ivan Martchev
“AI.com” Is the New Market Magic Formula
Sector Spotlight by Jason Bodner
Recall All Those Crashes That Never Happened
View Full Archive
Read Past Issues Here
About The Author

Gary Alexander
SENIOR EDITOR
Gary Alexander has been Senior Writer at Navellier since 2009. He edits Navellier’s weekly Marketmail and writes a weekly Growth Mail column, in which he uses market history to support the case for growth stocks. For the previous 20 years before joining Navellier, he was Senior Executive Editor at InvestorPlace Media (formerly Phillips Publishing), where he worked with several leading investment analysts, including Louis Navellier (since 1997), helping launch Louis Navellier’s Blue Chip Growth and Global Growth newsletters.
Prior to that, Gary edited Wealth Magazine and Gold Newsletter and wrote various investment research reports for Jefferson Financial in New Orleans in the 1980s. He began his financial newsletter career with KCI Communications in 1980, where he served as consulting editor for Personal Finance newsletter while serving as general manager of KCI’s Alexandria House book division. Before that, he covered the economics beat for news magazines. All content of “Growth Mail” represents the opinion of Gary Alexander
Important Disclosures:
Although information in these reports has been obtained from and is based upon sources that Navellier believes to be reliable, Navellier does not guarantee its accuracy and it may be incomplete or condensed. All opinions and estimates constitute Navellier’s judgment as of the date the report was created and are subject to change without notice. These reports are for informational purposes only and are not a solicitation for the purchase or sale of a security. Any decision to purchase securities mentioned in these reports must take into account existing public information on such securities or any registered prospectus.To the extent permitted by law, neither Navellier & Associates, Inc., nor any of its affiliates, agents, or service providers assumes any liability or responsibility nor owes any duty of care for any consequences of any person acting or refraining to act in reliance on the information contained in this communication or for any decision based on it.
Past performance is no indication of future results. Investment in securities involves significant risk and has the potential for partial or complete loss of funds invested. It should not be assumed that any securities recommendations made by Navellier. in the future will be profitable or equal the performance of securities made in this report. Dividend payments are not guaranteed. The amount of a dividend payment, if any, can vary over time and issuers may reduce dividends paid on securities in the event of a recession or adverse event affecting a specific industry or issuer.
None of the stock information, data, and company information presented herein constitutes a recommendation by Navellier or a solicitation to buy or sell any securities. Any specific securities identified and described do not represent all of the securities purchased, sold, or recommended for advisory clients. The holdings identified do not represent all of the securities purchased, sold, or recommended for advisory clients and the reader should not assume that investments in the securities identified and discussed were or will be profitable.
Information presented is general information that does not take into account your individual circumstances, financial situation, or needs, nor does it present a personalized recommendation to you. Individual stocks presented may not be suitable for every investor. Investment in securities involves significant risk and has the potential for partial or complete loss of funds invested. Investment in fixed income securities has the potential for the investment return and principal value of an investment to fluctuate so that an investor’s holdings, when redeemed, may be worth less than their original cost.
One cannot invest directly in an index. Index is unmanaged and index performance does not reflect deduction of fees, expenses, or taxes. Presentation of Index data does not reflect a belief by Navellier that any stock index constitutes an investment alternative to any Navellier equity strategy or is necessarily comparable to such strategies. Among the most important differences between the Indices and Navellier strategies are that the Navellier equity strategies may (1) incur material management fees, (2) concentrate its investments in relatively few stocks, industries, or sectors, (3) have significantly greater trading activity and related costs, and (4) be significantly more or less volatile than the Indices.
ETF Risk: We may invest in exchange traded funds (“ETFs”) and some of our investment strategies are generally fully invested in ETFs. Like traditional mutual funds, ETFs charge asset-based fees, but they generally do not charge initial sales charges or redemption fees and investors typically pay only customary brokerage fees to buy and sell ETF shares. The fees and costs charged by ETFs held in client accounts will not be deducted from the compensation the client pays Navellier. ETF prices can fluctuate up or down, and a client account could lose money investing in an ETF if the prices of the securities owned by the ETF go down. ETFs are subject to additional risks:
- ETF shares may trade above or below their net asset value;
- An active trading market for an ETF’s shares may not develop or be maintained;
- The value of an ETF may be more volatile than the underlying portfolio of securities the ETF is designed to track;
- The cost of owning shares of the ETF may exceed those a client would incur by directly investing in the underlying securities; and
- Trading of an ETF’s shares may be halted if the listing exchange’s officials deem it appropriate, the shares are delisted from the exchange, or the activation of market-wide “circuit breakers” (which are tied to large decreases in stock prices) halts stock trading generally.
Grader Disclosures: Investment in equity strategies involves substantial risk and has the potential for partial or complete loss of funds invested. The sample portfolio and any accompanying charts are for informational purposes only and are not to be construed as a solicitation to buy or sell any financial instrument and should not be relied upon as the sole factor in an investment making decision. As a matter of normal and important disclosures to you, as a potential investor, please consider the following: The performance presented is not based on any actual securities trading, portfolio, or accounts, and the reported performance of the A, B, C, D, and F portfolios (collectively the “model portfolios”) should be considered mere “paper” or pro forma performance results based on Navellier’s research.
Investors evaluating any of Navellier & Associates, Inc.’s, (or its affiliates’) Investment Products must not use any information presented here, including the performance figures of the model portfolios, in their evaluation of any Navellier Investment Products. Navellier Investment Products include the firm’s mutual funds and managed accounts. The model portfolios, charts, and other information presented do not represent actual funded trades and are not actual funded portfolios. There are material differences between Navellier Investment Products’ portfolios and the model portfolios, research, and performance figures presented here. The model portfolios and the research results (1) may contain stocks or ETFs that are illiquid and difficult to trade; (2) may contain stock or ETF holdings materially different from actual funded Navellier Investment Product portfolios; (3) include the reinvestment of all dividends and other earnings, estimated trading costs, commissions, or management fees; and, (4) may not reflect prices obtained in an actual funded Navellier Investment Product portfolio. For these and other reasons, the reported performances of model portfolios do not reflect the performance results of Navellier’s actually funded and traded Investment Products. In most cases, Navellier’s Investment Products have materially lower performance results than the performances of the model portfolios presented.
This report contains statements that are, or may be considered to be, forward-looking statements. All statements that are not historical facts, including statements about our beliefs or expectations, are “forward-looking statements” within the meaning of The U.S. Private Securities Litigation Reform Act of 1995. These statements may be identified by such forward-looking terminology as “expect,” “estimate,” “plan,” “intend,” “believe,” “anticipate,” “may,” “will,” “should,” “could,” “continue,” “project,” or similar statements or variations of such terms. Our forward-looking statements are based on a series of expectations, assumptions, and projections, are not guarantees of future results or performance, and involve substantial risks and uncertainty as described in Form ADV Part 2A of our filing with the Securities and Exchange Commission (SEC), which is available at www.adviserinfo.sec.gov or by requesting a copy by emailing info@navellier.com. All of our forward-looking statements are as of the date of this report only. We can give no assurance that such expectations or forward-looking statements will prove to be correct. Actual results may differ materially. You are urged to carefully consider all such factors.
FEDERAL TAX ADVICE DISCLAIMER: As required by U.S. Treasury Regulations, you are informed that, to the extent this presentation includes any federal tax advice, the presentation is not written by Navellier to be used, and cannot be used, for the purpose of avoiding federal tax penalties. Navellier does not advise on any income tax requirements or issues. Use of any information presented by Navellier is for general information only and does not represent tax advice either express or implied. You are encouraged to seek professional tax advice for income tax questions and assistance.
IMPORTANT NEWSLETTER DISCLOSURE:The hypothetical performance results for investment newsletters that are authored or edited by Louis Navellier, including Louis Navellier’s Growth Investor, Louis Navellier’s Breakthrough Stocks, Louis Navellier’s Accelerated Profits, and Louis Navellier’s Platinum Club, are not based on any actual securities trading, portfolio, or accounts, and the newsletters’ reported hypothetical performances should be considered mere “paper” or proforma hypothetical performance results and are not actual performance of real world trades. Navellier & Associates, Inc. does not have any relation to or affiliation with the owner of these newsletters. There are material differences between Navellier Investment Products’ portfolios and the InvestorPlace Media, LLC newsletter portfolios authored by Louis Navellier. The InvestorPlace Media, LLC newsletters contain hypothetical performance that do not include transaction costs, advisory fees, or other fees a client might incur if actual investments and trades were being made by an investor. As a result, newsletter performance should not be used to evaluate Navellier Investment services which are separate and different from the newsletters. The owner of the newsletters is InvestorPlace Media, LLC and any questions concerning the newsletters, including any newsletter advertising or hypothetical Newsletter performance claims, (which are calculated solely by Investor Place Media and not Navellier) should be referred to InvestorPlace Media, LLC at (800) 718-8289.
Please note that Navellier & Associates and the Navellier Private Client Group are managed completely independent of the newsletters owned and published by InvestorPlace Media, LLC and written and edited by Louis Navellier, and investment performance of the newsletters should in no way be considered indicative of potential future investment performance for any Navellier & Associates separately managed account portfolio. Potential investors should consult with their financial advisor before investing in any Navellier Investment Product.
Navellier claims compliance with Global Investment Performance Standards (GIPS). To receive a complete list and descriptions of Navellier’s composites and/or a presentation that adheres to the GIPS standards, please contact Navellier or click here. It should not be assumed that any securities recommendations made by Navellier & Associates, Inc. in the future will be profitable or equal the performance of securities made in this report.
FactSet Disclosure: Navellier does not independently calculate the statistical information included in the attached report. The calculation and the information are provided by FactSet, a company not related to Navellier. Although information contained in the report has been obtained from FactSet and is based on sources Navellier believes to be reliable, Navellier does not guarantee its accuracy, and it may be incomplete or condensed. The report and the related FactSet sourced information are provided on an “as is” basis. The user assumes the entire risk of any use made of this information. Investors should consider the report as only a single factor in making their investment decision. The report is for informational purposes only and is not intended as an offer or solicitation for the purchase or sale of a security. FactSet sourced information is the exclusive property of FactSet. Without prior written permission of FactSet, this information may not be reproduced, disseminated or used to create any financial products. All indices are unmanaged and performance of the indices include reinvestment of dividends and interest income, unless otherwise noted, are not illustrative of any particular investment and an investment cannot be made in any index. Past performance is no guarantee of future results.