by Jason Bodner
May 2, 2023
What are the most polluting industries in the world?
If you answered fossil fuels as #1 you get a prize, but what about #2, 3, and 4? Airlines? Shipping?
It turns out that Transport and Agriculture are listed at #2 and #3 on most lists, but at #4, producing up to 10% of all carbon emissions and 20% of all global wastewater is the fashion industry, which is responsible for more carbon emissions than international flights and global shipping combined.
That’s another example of things not always being what they seem. Fashion seems innocuous until you dig deeper and see what happens in textile factories. But in the stock market, that level of intuition is hard to come by. It’s not as simple as rattling off a stat or two about water waste or carbon emissions.
We’ve come a long way since October, which found both moods and stock prices at lows. The Big Lift was called for by yours truly, using data to forecast it. That served us well as markets rose broadly by ~15% with technology and discretionary leading the way, as predicted.
Last week, I put forth what my data analysis suggested was a bullish case for stocks going forward. Feel free to revisit that, but in short: Earnings are working, the Fed is likely done hiking, and inflation is falling fast. Life has a way of dosing us with reality… with earnings came volatility. Should we worry?
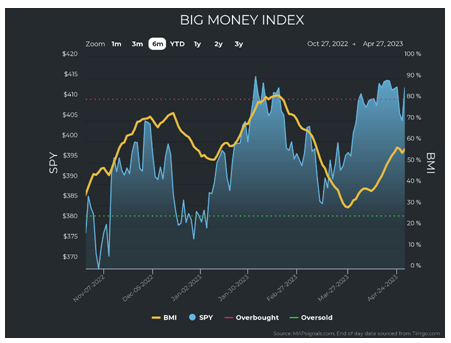
Let’s dig into data for the answer, beginning with the Big Money Index (BMI). Earnings volatility brought fresh selling and renewed fears about regional banks, but the sharp market drop immediately rebounded. It’s interesting to note that the BMI barely sniffled and looks to be resuming an upward trend:
Graphs are for illustrative and discussion purposes only. Please read important disclosures at the end of this commentary.
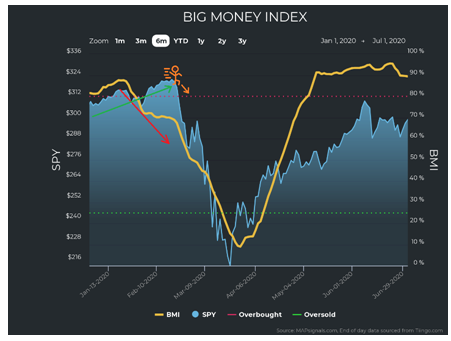
This is notable because sometimes the BMI can fall when the market is still rising, which would indicate all is not well. This happened in January 2020. You can see this here – a falling BMI while the SPY rose:
Graphs are for illustrative and discussion purposes only. Please read important disclosures at the end of this commentary.
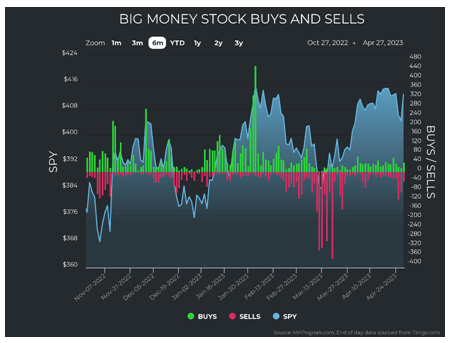
For the sake of absolute clarity, that’s not what’s happening now. In fact, it’s the opposite. The market plopped while the BMI keeps chugging. That’s healthy. We can also see a silver lining in the buy and sell data. Look here: the stock selling did pick up to levels not seen since March’s whippy weather. But it quickly seems to be dissipating. Perhaps just a rain shower and not a full-blown Tropical Storm?
Graphs are for illustrative and discussion purposes only. Please read important disclosures at the end of this commentary.
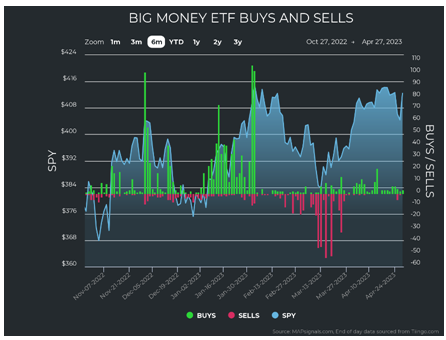
To go further into the sunny weather, look at ETF buying and selling – we see hardly a sniff of selling. And small as they are, those are little green sprouts off to the right indicating small buying:
Graphs are for illustrative and discussion purposes only. Please read important disclosures at the end of this commentary.
Next up, we visit the sectors. I’d like to acknowledge full well that there was notable selling suddenly cropping up. This was particularly focused in technology and to a lesser degree in discretionary: 33% of selling last week was observed in tech. This was offset with 34% of all buys taking place in health care.
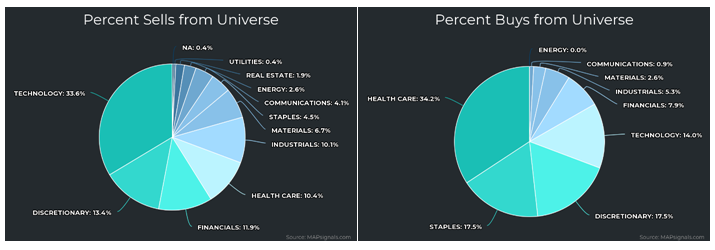
Graphs are for illustrative and discussion purposes only. Please read important disclosures at the end of this commentary.
It begs the question: Is the tech run over? This is an important ask, as tech led us out of the depths of October’s despair (let’s not forget that it led us into that despair in November of 2019).

Graphs are for illustrative and discussion purposes only. Please read important disclosures at the end of this commentary.
Now, when we dig a little deeper, we can see the distribution of selling within the technology sector. We see that 47% of tech selling (42 of 90 sells) was semiconductor related:
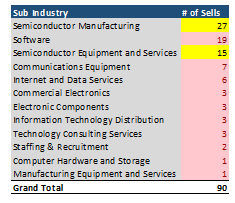
Graphs are for illustrative and discussion purposes only. Please read important disclosures at the end of this commentary.
Currently tensions are ratcheting up between the U.S. and China and that’s being attributed to the semiconductor pressure in the market. That’s all well and good, but I don’t really buy it. After all, the PHLX semiconductor index rocketed up +34% from October lows, including this week’s pullback:
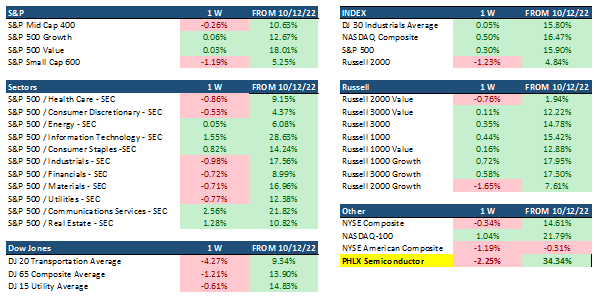
Graphs are for illustrative and discussion purposes only. Please read important disclosures at the end of this commentary.
This screams profit-taking to me, a chance to use the headlines for liquidity after a huge run up. And while they punish semis (like ST Micro and Samsung) * with disappointing numbers, which helped drag the sector down, they lift health care. There was specific buying in the medical device category.
Despite the tech pressure, discretionary and tech continue to be the strongest sectors according to my data furthering the trend of the last few months:
![]()
Graphs are for illustrative and discussion purposes only. Please read important disclosures at the end of this commentary.
Now what about that earnings volatility?
According to FactSet earnings are working. As of last Friday April 28, for Q1 2023 (with 18% of S&P 500 companies reporting actual results), 79% of S&P 500 companies reporting so far have beaten EPS and 74% of S&P 500 companies have beaten revenue. And after that we had stellar earnings come out on Microsoft and META, which are major bellwethers for tech. Chipotle Mexican Grill CMG also blew away earnings estimates. So I suspect the earnings update will continue to show expectations being beaten. *
So, we have gone over a rising BMI, tech – specifically, semis pressure, and earnings. They honestly together just don’t seem that bad. But what could really get this bull market going?
Well, the Fed holds the key… we all know that. But with inflation coming in quickly, regional bank pressure continuing, and the American consumer getting worn out, the pressure is on the Fed to not overdo it. Consensus largely has the Fed’s final hike in May – if there is one at all. I’d just like to point again to the fact the Fed funds is nearly at parity with the CPI for the first time since before COVID:
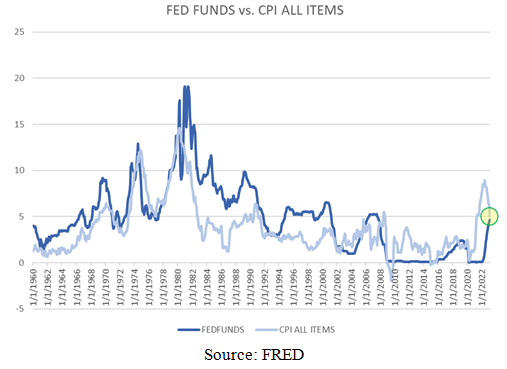
Graphs are for illustrative and discussion purposes only. Please read important disclosures at the end of this commentary.
Lastly, there is record cash sitting as dry powder. Check out this chart of money market assets – now at the highest levels ever recorded, dating back to 1945:
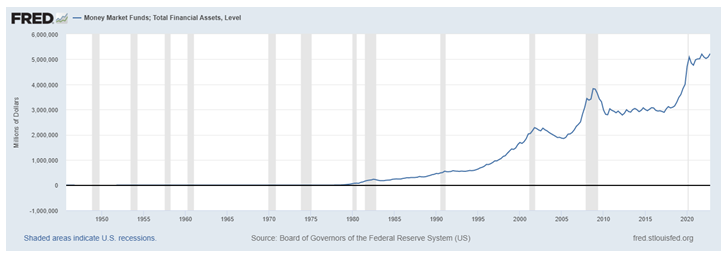
Graphs are for illustrative and discussion purposes only. Please read important disclosures at the end of this commentary.
We have a potentially big bullish powder keg brewing, characterized by:
- Low liquidity
- Earnings are working: No “Earnings Apocalypse”
- Record Cash
- Fed near the end of the road for hikes
- Inflation is coming down
We’ll see, but from my vantage point, the market isn’t as bad as it seems – just like fashion isn’t as “clean” or innocent as it seems. It’s hard to know what’s real sometimes; but as Confucius said, “Real knowledge is to know the extent of one’s ignorance.”
*Jason Bodner does not own ST Micro, Samsung, Microsoft, or META, but does own Chipotle Mexican Grill shares.
All content above represents the opinion of Jason Bodner of Navellier & Associates, Inc.
Also In This Issue
A Look Ahead by Louis Navellier
GDP Rose 1.1% in Q1; Can We Dodge a Recession?
Income Mail by Bryan Perry
The Market May Enjoy “Spring Fever” With a Positive Fed Policy Statement
Growth Mail by Gary Alexander
A Tale of Two Centuries: Growth (1950-99) vs. Debt (2000-23)
Global Mail by Ivan Martchev
Market Advances on Poor Breadth
Sector Spotlight by Jason Bodner
Tech is Back in Fashion – Will That Continue?
View Full Archive
Read Past Issues Here

Jason Bodner
MARKETMAIL EDITOR FOR SECTOR SPOTLIGHT
Jason Bodner writes Sector Spotlight in the weekly Marketmail publication and has authored several white papers for the company. He is also Co-Founder of Macro Analytics for Professionals which produces proprietary equity accumulation/distribution research for its clients. Previously, Mr. Bodner served as Director of European Equity Derivatives for Cantor Fitzgerald Europe in London, then moved to the role of Head of Equity Derivatives North America for the same company in New York. He also served as S.V.P. Equity Derivatives for Jefferies, LLC. He received a B.S. in business administration in 1996, with honors, from Skidmore College as a member of the Periclean Honors Society. All content of “Sector Spotlight” represents the opinion of Jason Bodner
Important Disclosures:
Jason Bodner is a co-founder and co-owner of Mapsignals. Mr. Bodner is an independent contractor who is occasionally hired by Navellier & Associates to write an article and or provide opinions for possible use in articles that appear in Navellier & Associates weekly Market Mail. Mr. Bodner is not employed or affiliated with Louis Navellier, Navellier & Associates, Inc., or any other Navellier owned entity. The opinions and statements made here are those of Mr. Bodner and not necessarily those of any other persons or entities. This is not an endorsement, or solicitation or testimonial or investment advice regarding the BMI Index or any statements or recommendations or analysis in the article or the BMI Index or Mapsignals or its products or strategies.
Although information in these reports has been obtained from and is based upon sources that Navellier believes to be reliable, Navellier does not guarantee its accuracy and it may be incomplete or condensed. All opinions and estimates constitute Navellier’s judgment as of the date the report was created and are subject to change without notice. These reports are for informational purposes only and are not a solicitation for the purchase or sale of a security. Any decision to purchase securities mentioned in these reports must take into account existing public information on such securities or any registered prospectus.To the extent permitted by law, neither Navellier & Associates, Inc., nor any of its affiliates, agents, or service providers assumes any liability or responsibility nor owes any duty of care for any consequences of any person acting or refraining to act in reliance on the information contained in this communication or for any decision based on it.
Past performance is no indication of future results. Investment in securities involves significant risk and has the potential for partial or complete loss of funds invested. It should not be assumed that any securities recommendations made by Navellier. in the future will be profitable or equal the performance of securities made in this report. Dividend payments are not guaranteed. The amount of a dividend payment, if any, can vary over time and issuers may reduce dividends paid on securities in the event of a recession or adverse event affecting a specific industry or issuer.
None of the stock information, data, and company information presented herein constitutes a recommendation by Navellier or a solicitation to buy or sell any securities. Any specific securities identified and described do not represent all of the securities purchased, sold, or recommended for advisory clients. The holdings identified do not represent all of the securities purchased, sold, or recommended for advisory clients and the reader should not assume that investments in the securities identified and discussed were or will be profitable.
Information presented is general information that does not take into account your individual circumstances, financial situation, or needs, nor does it present a personalized recommendation to you. Individual stocks presented may not be suitable for every investor. Investment in securities involves significant risk and has the potential for partial or complete loss of funds invested. Investment in fixed income securities has the potential for the investment return and principal value of an investment to fluctuate so that an investor’s holdings, when redeemed, may be worth less than their original cost.
One cannot invest directly in an index. Index is unmanaged and index performance does not reflect deduction of fees, expenses, or taxes. Presentation of Index data does not reflect a belief by Navellier that any stock index constitutes an investment alternative to any Navellier equity strategy or is necessarily comparable to such strategies. Among the most important differences between the Indices and Navellier strategies are that the Navellier equity strategies may (1) incur material management fees, (2) concentrate its investments in relatively few stocks, industries, or sectors, (3) have significantly greater trading activity and related costs, and (4) be significantly more or less volatile than the Indices.
ETF Risk: We may invest in exchange traded funds (“ETFs”) and some of our investment strategies are generally fully invested in ETFs. Like traditional mutual funds, ETFs charge asset-based fees, but they generally do not charge initial sales charges or redemption fees and investors typically pay only customary brokerage fees to buy and sell ETF shares. The fees and costs charged by ETFs held in client accounts will not be deducted from the compensation the client pays Navellier. ETF prices can fluctuate up or down, and a client account could lose money investing in an ETF if the prices of the securities owned by the ETF go down. ETFs are subject to additional risks:
- ETF shares may trade above or below their net asset value;
- An active trading market for an ETF’s shares may not develop or be maintained;
- The value of an ETF may be more volatile than the underlying portfolio of securities the ETF is designed to track;
- The cost of owning shares of the ETF may exceed those a client would incur by directly investing in the underlying securities; and
- Trading of an ETF’s shares may be halted if the listing exchange’s officials deem it appropriate, the shares are delisted from the exchange, or the activation of market-wide “circuit breakers” (which are tied to large decreases in stock prices) halts stock trading generally.
Grader Disclosures: Investment in equity strategies involves substantial risk and has the potential for partial or complete loss of funds invested. The sample portfolio and any accompanying charts are for informational purposes only and are not to be construed as a solicitation to buy or sell any financial instrument and should not be relied upon as the sole factor in an investment making decision. As a matter of normal and important disclosures to you, as a potential investor, please consider the following: The performance presented is not based on any actual securities trading, portfolio, or accounts, and the reported performance of the A, B, C, D, and F portfolios (collectively the “model portfolios”) should be considered mere “paper” or pro forma performance results based on Navellier’s research.
Investors evaluating any of Navellier & Associates, Inc.’s, (or its affiliates’) Investment Products must not use any information presented here, including the performance figures of the model portfolios, in their evaluation of any Navellier Investment Products. Navellier Investment Products include the firm’s mutual funds and managed accounts. The model portfolios, charts, and other information presented do not represent actual funded trades and are not actual funded portfolios. There are material differences between Navellier Investment Products’ portfolios and the model portfolios, research, and performance figures presented here. The model portfolios and the research results (1) may contain stocks or ETFs that are illiquid and difficult to trade; (2) may contain stock or ETF holdings materially different from actual funded Navellier Investment Product portfolios; (3) include the reinvestment of all dividends and other earnings, estimated trading costs, commissions, or management fees; and, (4) may not reflect prices obtained in an actual funded Navellier Investment Product portfolio. For these and other reasons, the reported performances of model portfolios do not reflect the performance results of Navellier’s actually funded and traded Investment Products. In most cases, Navellier’s Investment Products have materially lower performance results than the performances of the model portfolios presented.
This report contains statements that are, or may be considered to be, forward-looking statements. All statements that are not historical facts, including statements about our beliefs or expectations, are “forward-looking statements” within the meaning of The U.S. Private Securities Litigation Reform Act of 1995. These statements may be identified by such forward-looking terminology as “expect,” “estimate,” “plan,” “intend,” “believe,” “anticipate,” “may,” “will,” “should,” “could,” “continue,” “project,” or similar statements or variations of such terms. Our forward-looking statements are based on a series of expectations, assumptions, and projections, are not guarantees of future results or performance, and involve substantial risks and uncertainty as described in Form ADV Part 2A of our filing with the Securities and Exchange Commission (SEC), which is available at www.adviserinfo.sec.gov or by requesting a copy by emailing info@navellier.com. All of our forward-looking statements are as of the date of this report only. We can give no assurance that such expectations or forward-looking statements will prove to be correct. Actual results may differ materially. You are urged to carefully consider all such factors.
FEDERAL TAX ADVICE DISCLAIMER: As required by U.S. Treasury Regulations, you are informed that, to the extent this presentation includes any federal tax advice, the presentation is not written by Navellier to be used, and cannot be used, for the purpose of avoiding federal tax penalties. Navellier does not advise on any income tax requirements or issues. Use of any information presented by Navellier is for general information only and does not represent tax advice either express or implied. You are encouraged to seek professional tax advice for income tax questions and assistance.
IMPORTANT NEWSLETTER DISCLOSURE:The hypothetical performance results for investment newsletters that are authored or edited by Louis Navellier, including Louis Navellier’s Growth Investor, Louis Navellier’s Breakthrough Stocks, Louis Navellier’s Accelerated Profits, and Louis Navellier’s Platinum Club, are not based on any actual securities trading, portfolio, or accounts, and the newsletters’ reported hypothetical performances should be considered mere “paper” or proforma hypothetical performance results and are not actual performance of real world trades. Navellier & Associates, Inc. does not have any relation to or affiliation with the owner of these newsletters. There are material differences between Navellier Investment Products’ portfolios and the InvestorPlace Media, LLC newsletter portfolios authored by Louis Navellier. The InvestorPlace Media, LLC newsletters contain hypothetical performance that do not include transaction costs, advisory fees, or other fees a client might incur if actual investments and trades were being made by an investor. As a result, newsletter performance should not be used to evaluate Navellier Investment services which are separate and different from the newsletters. The owner of the newsletters is InvestorPlace Media, LLC and any questions concerning the newsletters, including any newsletter advertising or hypothetical Newsletter performance claims, (which are calculated solely by Investor Place Media and not Navellier) should be referred to InvestorPlace Media, LLC at (800) 718-8289.
Please note that Navellier & Associates and the Navellier Private Client Group are managed completely independent of the newsletters owned and published by InvestorPlace Media, LLC and written and edited by Louis Navellier, and investment performance of the newsletters should in no way be considered indicative of potential future investment performance for any Navellier & Associates separately managed account portfolio. Potential investors should consult with their financial advisor before investing in any Navellier Investment Product.
Navellier claims compliance with Global Investment Performance Standards (GIPS). To receive a complete list and descriptions of Navellier’s composites and/or a presentation that adheres to the GIPS standards, please contact Navellier or click here. It should not be assumed that any securities recommendations made by Navellier & Associates, Inc. in the future will be profitable or equal the performance of securities made in this report.
FactSet Disclosure: Navellier does not independently calculate the statistical information included in the attached report. The calculation and the information are provided by FactSet, a company not related to Navellier. Although information contained in the report has been obtained from FactSet and is based on sources Navellier believes to be reliable, Navellier does not guarantee its accuracy, and it may be incomplete or condensed. The report and the related FactSet sourced information are provided on an “as is” basis. The user assumes the entire risk of any use made of this information. Investors should consider the report as only a single factor in making their investment decision. The report is for informational purposes only and is not intended as an offer or solicitation for the purchase or sale of a security. FactSet sourced information is the exclusive property of FactSet. Without prior written permission of FactSet, this information may not be reproduced, disseminated or used to create any financial products. All indices are unmanaged and performance of the indices include reinvestment of dividends and interest income, unless otherwise noted, are not illustrative of any particular investment and an investment cannot be made in any index. Past performance is no guarantee of future results.