by Bryan Perry
April 9, 2024
An interesting development occurred late last week when the employment data was released, showing the economy added 303,000 non-farm jobs to payrolls, a full 50% more than had been forecast. Non-farm private payrolls increased 232,000, also considerably higher than the 160,000 estimate, which followed the ADP employment report for March, which showed an increase of 184,000 private payroll jobs – also well above the 150,000 forecasted. Without question, it was a good week for the U.S. labor market.
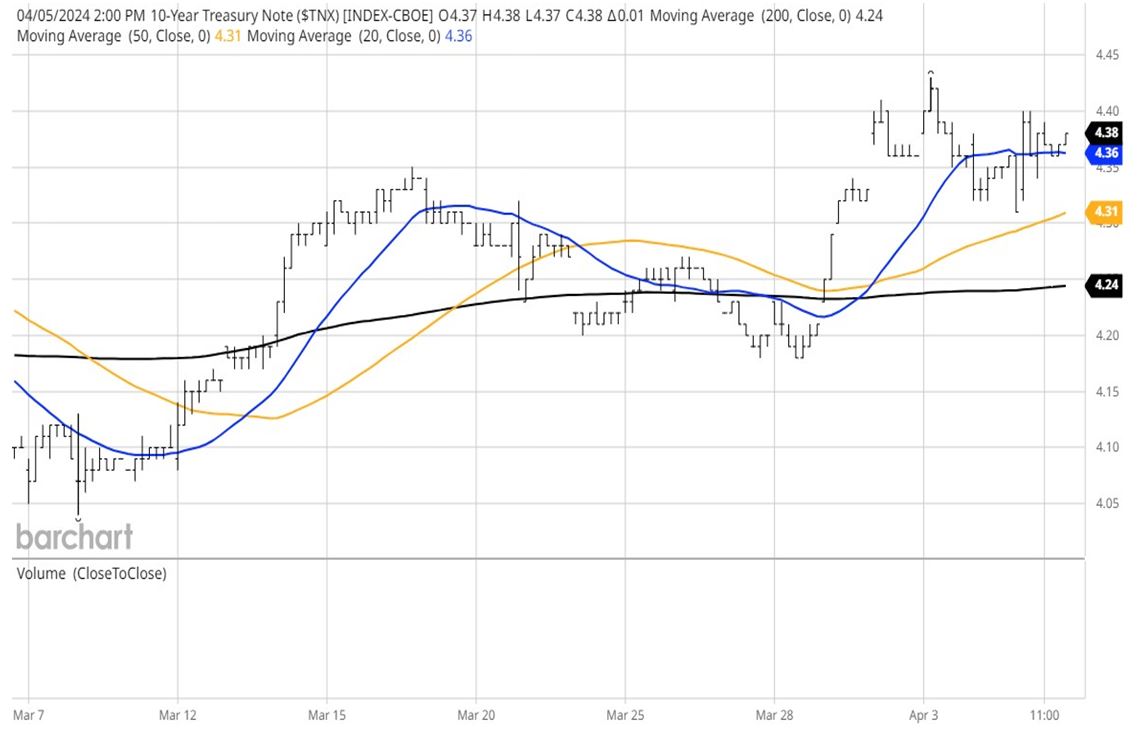
On most similar occasions, such a strong report, with such surprising results, sending bond yields higher, would be met with widespread selling of stocks – under the belief that any future rate cuts would be delayed indefinitely. But instead, stocks rallied, the takeaway being that a strong labor market seemingly bodes well for corporate earnings and the outlook for sustained economic growth. The 10-year Treasury Note settled the week at a five-month high of 4.39% and the 2-year T-Note settled at 4.73%.
Graphs are for illustrative and discussion purposes only. Please read important disclosures at the end of this commentary.
This data comes on the heels of some hotter-than-expected inflation CPI and PPI data released in mid-March, followed by the PCE inflation data, released on March 29 with the markets closed. Come the following Monday (April 1), stocks rallied. along with some soothing comments from Fed Chair Jerome Powell, only to see the market sell off sharply after hawkish words by Minneapolis Fed President Neel Kashkari and news of Israel canceling home leave for all combat troops in the event of a retaliatory attack by Iran after the Israeli strike in Syria that killed a top Iranian Revolutionary Guard Corps commander.
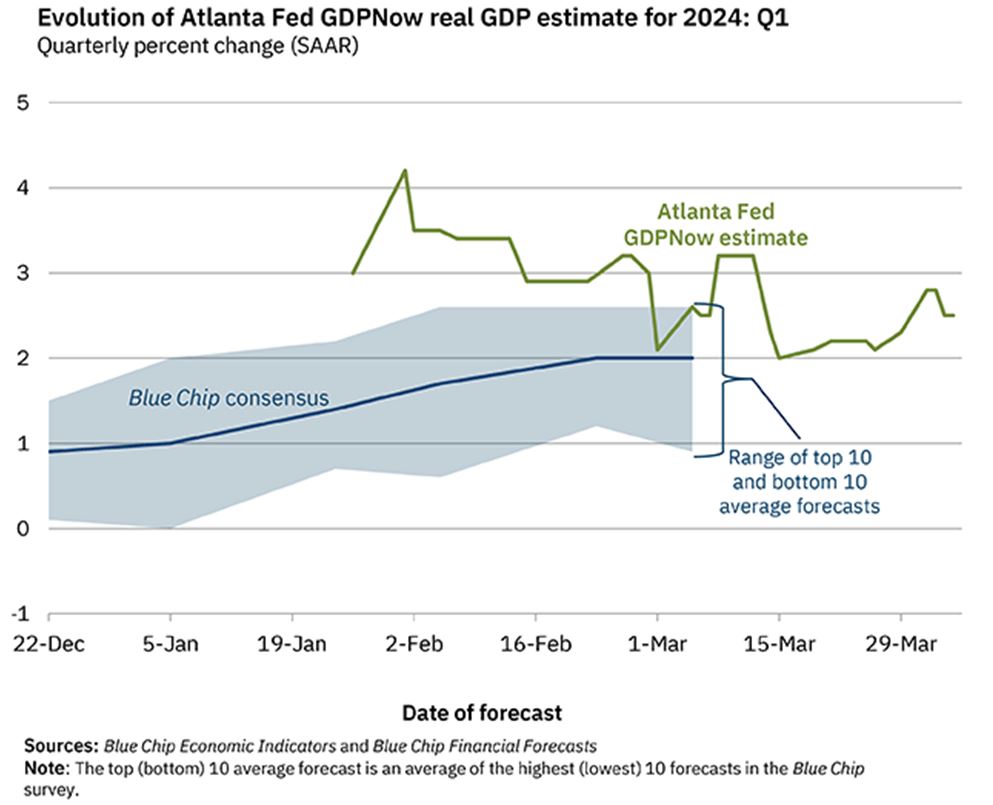
For the market to have regained its footing during Friday’s session was rather impressive, implying the buy-the-dip mentality is still very much intact heading into the first-quarter reporting season that kicks off this week with big money center banks posting their results on Friday. Adding to the bullish sentiment, the Atlanta Fed GDPNow estimate for Q1 GDP growth was raised to 2.5% from 2.1% as of March 31.
Graphs are for illustrative and discussion purposes only. Please read important disclosures at the end of this commentary.
In another development, the managed care sector was sold off aggressively after the Centers for Medicare & Medicaid Services (CMS) set a lower-than-expected reimbursement rate for privately run healthcare plans for 2025. The Biden administration’s decision to hold payment rates unchanged surprised analysts, with JPMorgan noting that only once in the last 10 years have regulators failed to improve final rates from preliminary rates. “We now see the deteriorating rate environment becoming a risk to forward estimates,” wrote B of A analyst Kevin Fischbeck. This once reliable growth and dividend sector is now in full retreat.
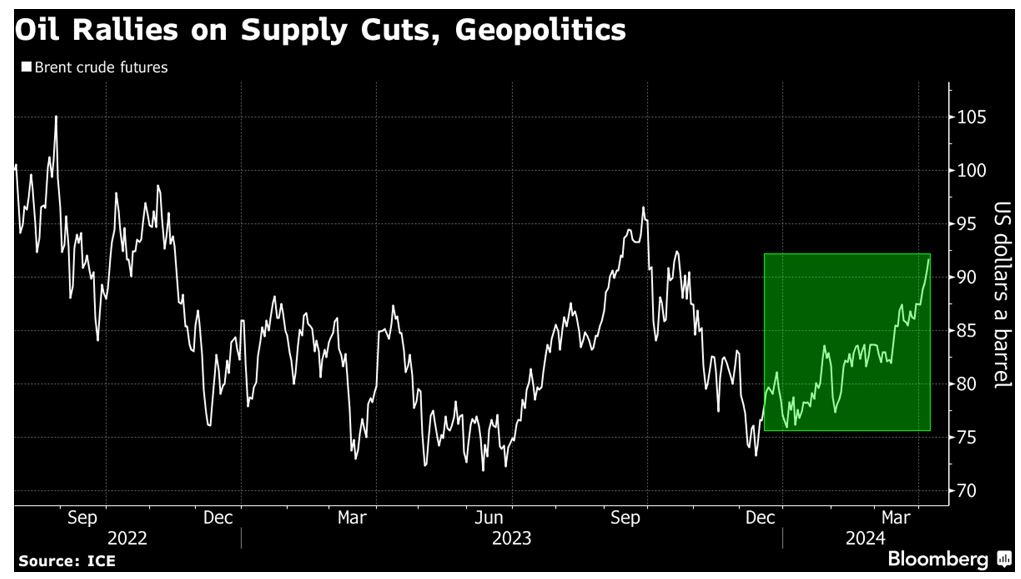
In another example of market volatility, the price of a barrel of WTI crude topped $87 last week amid Mideast tensions and OPEC+ stating that they will extend their production cuts of 2.2 million barrels per day for the second quarter of 2024. Mexico is also slashing exports, compounding American sanctions of Russian oil set to put more pressure on U.S. supplies as the summer driving season approaches.
Graphs are for illustrative and discussion purposes only. Please read important disclosures at the end of this commentary.
Any further rise in oil prices and other commodities could complicate future rate cut deliberations.
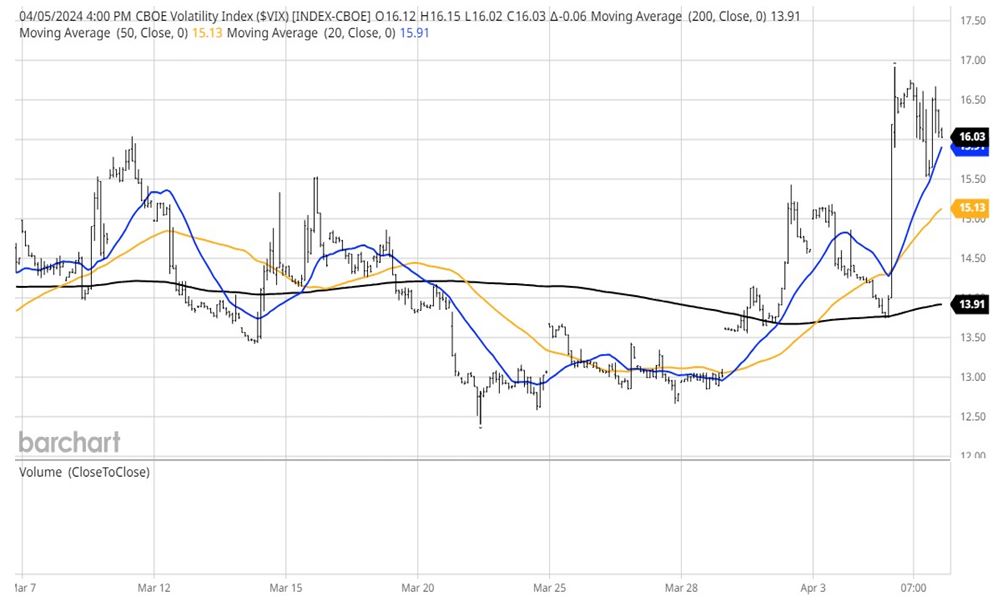
It’s no surprise that the confluence of these situations has the CBOE Volatility Index (VIX) popping higher along with the price of gold finishing the week out at a new all-time closing high of $2,329/oz.
Graphs are for illustrative and discussion purposes only. Please read important disclosures at the end of this commentary.
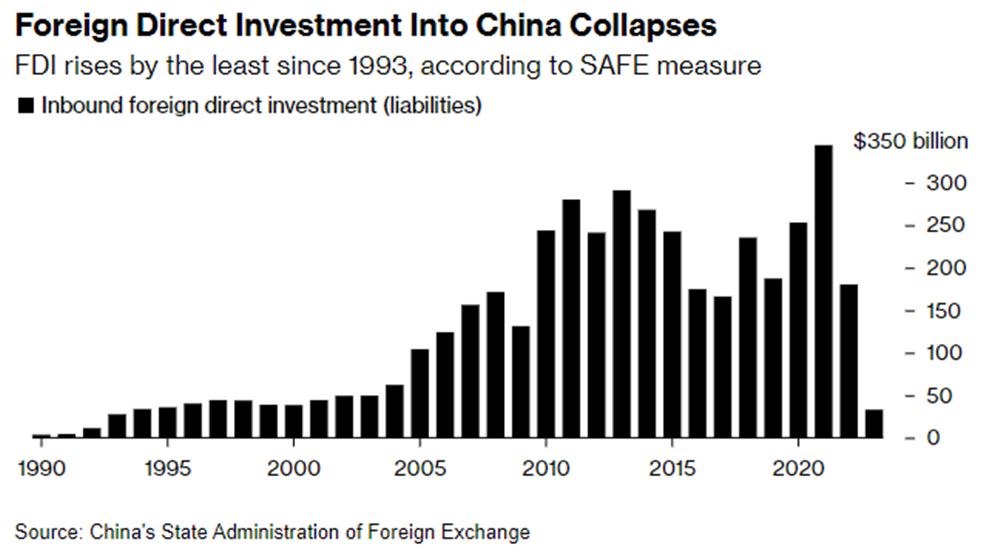
The ballooning Federal debt, a high-profile border crisis, and further destabilizing of the U.S./China relationship are also clouding the investment landscape. The re-shoring of industries away from China has resulted in a sharp decline in the world’s second largest economy. Analysts are concerned that China will flood foreign markets with ultra-cheap pricing to spur their economy, threatening U.S. businesses.
Graphs are for illustrative and discussion purposes only. Please read important disclosures at the end of this commentary.
Against this increasingly uncertain backdrop comes the potential for a promising earnings season that can provide impetus to cast aside these negative headlines and bring about a further rise for the market averages that has seen some broadening out of the rally. Fact-Set Earnings Insight says the first quarter’s estimated year-over-year earnings growth rate for the S&P 500 is 3.2%. If 3.2% is the actual growth rate for the quarter, it will mark the third-straight quarter of year-over-year earnings growth for the index.
Without question, the market is seeking another great quarter from the leading AI and technology companies, but there is also strong relative growth being exhibited in numerous leading industrial, transportation, communications, energy, materials, and consumer discretion. The rally is better represented now by sector participation than at any time in the past year. But with the tech sector accounting for a 30.6% weighting of the S&P 500 and a 50.1% weighting for the NASDAQ, there is no doubt about which sector needs to deliver solid earnings, and more importantly, bullish forward guidance.
All content above represents the opinion of Bryan Perry of Navellier & Associates, Inc.
Also In This Issue
A Look Ahead by Louis Navellier
With Rising Inflation and Bond Rates, is a June Fed Rate Cut Still Likely?
Income Mail by Bryan Perry
Fresh Market Volatility Comes from Unexpected Sources
Growth Mail by Gary Alexander
Why Raising Tax Rates Does NOT Raise More Tax Dollars
Global Mail by Ivan Martchev
With 10-Year Treasuries At 4.4%, How High is Too High?
Sector Spotlight by Jason Bodner
No April Showers on the Horizon
View Full Archive
Read Past Issues Here

Bryan Perry
SENIOR DIRECTOR
Bryan Perry is a Senior Director with Navellier Private Client Group, advising and facilitating high net worth investors in the pursuit of their financial goals.
Bryan’s financial services career spanning the past three decades includes over 20 years of wealth management experience with Wall Street firms that include Bear Stearns, Lehman Brothers and Paine Webber, working with both retail and institutional clients. Bryan earned a B.A. in Political Science from Virginia Polytechnic Institute & State University and currently holds a Series 65 license. All content of “Income Mail” represents the opinion of Bryan Perry
Important Disclosures:
Although information in these reports has been obtained from and is based upon sources that Navellier believes to be reliable, Navellier does not guarantee its accuracy and it may be incomplete or condensed. All opinions and estimates constitute Navellier’s judgment as of the date the report was created and are subject to change without notice. These reports are for informational purposes only and are not a solicitation for the purchase or sale of a security. Any decision to purchase securities mentioned in these reports must take into account existing public information on such securities or any registered prospectus.To the extent permitted by law, neither Navellier & Associates, Inc., nor any of its affiliates, agents, or service providers assumes any liability or responsibility nor owes any duty of care for any consequences of any person acting or refraining to act in reliance on the information contained in this communication or for any decision based on it.
Past performance is no indication of future results. Investment in securities involves significant risk and has the potential for partial or complete loss of funds invested. It should not be assumed that any securities recommendations made by Navellier. in the future will be profitable or equal the performance of securities made in this report. Dividend payments are not guaranteed. The amount of a dividend payment, if any, can vary over time and issuers may reduce dividends paid on securities in the event of a recession or adverse event affecting a specific industry or issuer.
None of the stock information, data, and company information presented herein constitutes a recommendation by Navellier or a solicitation to buy or sell any securities. Any specific securities identified and described do not represent all of the securities purchased, sold, or recommended for advisory clients. The holdings identified do not represent all of the securities purchased, sold, or recommended for advisory clients and the reader should not assume that investments in the securities identified and discussed were or will be profitable.
Information presented is general information that does not take into account your individual circumstances, financial situation, or needs, nor does it present a personalized recommendation to you. Individual stocks presented may not be suitable for every investor. Investment in securities involves significant risk and has the potential for partial or complete loss of funds invested. Investment in fixed income securities has the potential for the investment return and principal value of an investment to fluctuate so that an investor’s holdings, when redeemed, may be worth less than their original cost.
One cannot invest directly in an index. Index is unmanaged and index performance does not reflect deduction of fees, expenses, or taxes. Presentation of Index data does not reflect a belief by Navellier that any stock index constitutes an investment alternative to any Navellier equity strategy or is necessarily comparable to such strategies. Among the most important differences between the Indices and Navellier strategies are that the Navellier equity strategies may (1) incur material management fees, (2) concentrate its investments in relatively few stocks, industries, or sectors, (3) have significantly greater trading activity and related costs, and (4) be significantly more or less volatile than the Indices.
ETF Risk: We may invest in exchange traded funds (“ETFs”) and some of our investment strategies are generally fully invested in ETFs. Like traditional mutual funds, ETFs charge asset-based fees, but they generally do not charge initial sales charges or redemption fees and investors typically pay only customary brokerage fees to buy and sell ETF shares. The fees and costs charged by ETFs held in client accounts will not be deducted from the compensation the client pays Navellier. ETF prices can fluctuate up or down, and a client account could lose money investing in an ETF if the prices of the securities owned by the ETF go down. ETFs are subject to additional risks:
- ETF shares may trade above or below their net asset value;
- An active trading market for an ETF’s shares may not develop or be maintained;
- The value of an ETF may be more volatile than the underlying portfolio of securities the ETF is designed to track;
- The cost of owning shares of the ETF may exceed those a client would incur by directly investing in the underlying securities; and
- Trading of an ETF’s shares may be halted if the listing exchange’s officials deem it appropriate, the shares are delisted from the exchange, or the activation of market-wide “circuit breakers” (which are tied to large decreases in stock prices) halts stock trading generally.
Grader Disclosures: Investment in equity strategies involves substantial risk and has the potential for partial or complete loss of funds invested. The sample portfolio and any accompanying charts are for informational purposes only and are not to be construed as a solicitation to buy or sell any financial instrument and should not be relied upon as the sole factor in an investment making decision. As a matter of normal and important disclosures to you, as a potential investor, please consider the following: The performance presented is not based on any actual securities trading, portfolio, or accounts, and the reported performance of the A, B, C, D, and F portfolios (collectively the “model portfolios”) should be considered mere “paper” or pro forma performance results based on Navellier’s research.
Investors evaluating any of Navellier & Associates, Inc.’s, (or its affiliates’) Investment Products must not use any information presented here, including the performance figures of the model portfolios, in their evaluation of any Navellier Investment Products. Navellier Investment Products include the firm’s mutual funds and managed accounts. The model portfolios, charts, and other information presented do not represent actual funded trades and are not actual funded portfolios. There are material differences between Navellier Investment Products’ portfolios and the model portfolios, research, and performance figures presented here. The model portfolios and the research results (1) may contain stocks or ETFs that are illiquid and difficult to trade; (2) may contain stock or ETF holdings materially different from actual funded Navellier Investment Product portfolios; (3) include the reinvestment of all dividends and other earnings, estimated trading costs, commissions, or management fees; and, (4) may not reflect prices obtained in an actual funded Navellier Investment Product portfolio. For these and other reasons, the reported performances of model portfolios do not reflect the performance results of Navellier’s actually funded and traded Investment Products. In most cases, Navellier’s Investment Products have materially lower performance results than the performances of the model portfolios presented.
This report contains statements that are, or may be considered to be, forward-looking statements. All statements that are not historical facts, including statements about our beliefs or expectations, are “forward-looking statements” within the meaning of The U.S. Private Securities Litigation Reform Act of 1995. These statements may be identified by such forward-looking terminology as “expect,” “estimate,” “plan,” “intend,” “believe,” “anticipate,” “may,” “will,” “should,” “could,” “continue,” “project,” or similar statements or variations of such terms. Our forward-looking statements are based on a series of expectations, assumptions, and projections, are not guarantees of future results or performance, and involve substantial risks and uncertainty as described in Form ADV Part 2A of our filing with the Securities and Exchange Commission (SEC), which is available at www.adviserinfo.sec.gov or by requesting a copy by emailing info@navellier.com. All of our forward-looking statements are as of the date of this report only. We can give no assurance that such expectations or forward-looking statements will prove to be correct. Actual results may differ materially. You are urged to carefully consider all such factors.
FEDERAL TAX ADVICE DISCLAIMER: As required by U.S. Treasury Regulations, you are informed that, to the extent this presentation includes any federal tax advice, the presentation is not written by Navellier to be used, and cannot be used, for the purpose of avoiding federal tax penalties. Navellier does not advise on any income tax requirements or issues. Use of any information presented by Navellier is for general information only and does not represent tax advice either express or implied. You are encouraged to seek professional tax advice for income tax questions and assistance.
IMPORTANT NEWSLETTER DISCLOSURE:The hypothetical performance results for investment newsletters that are authored or edited by Louis Navellier, including Louis Navellier’s Growth Investor, Louis Navellier’s Breakthrough Stocks, Louis Navellier’s Accelerated Profits, and Louis Navellier’s Platinum Club, are not based on any actual securities trading, portfolio, or accounts, and the newsletters’ reported hypothetical performances should be considered mere “paper” or proforma hypothetical performance results and are not actual performance of real world trades. Navellier & Associates, Inc. does not have any relation to or affiliation with the owner of these newsletters. There are material differences between Navellier Investment Products’ portfolios and the InvestorPlace Media, LLC newsletter portfolios authored by Louis Navellier. The InvestorPlace Media, LLC newsletters contain hypothetical performance that do not include transaction costs, advisory fees, or other fees a client might incur if actual investments and trades were being made by an investor. As a result, newsletter performance should not be used to evaluate Navellier Investment services which are separate and different from the newsletters. The owner of the newsletters is InvestorPlace Media, LLC and any questions concerning the newsletters, including any newsletter advertising or hypothetical Newsletter performance claims, (which are calculated solely by Investor Place Media and not Navellier) should be referred to InvestorPlace Media, LLC at (800) 718-8289.
Please note that Navellier & Associates and the Navellier Private Client Group are managed completely independent of the newsletters owned and published by InvestorPlace Media, LLC and written and edited by Louis Navellier, and investment performance of the newsletters should in no way be considered indicative of potential future investment performance for any Navellier & Associates separately managed account portfolio. Potential investors should consult with their financial advisor before investing in any Navellier Investment Product.
Navellier claims compliance with Global Investment Performance Standards (GIPS). To receive a complete list and descriptions of Navellier’s composites and/or a presentation that adheres to the GIPS standards, please contact Navellier or click here. It should not be assumed that any securities recommendations made by Navellier & Associates, Inc. in the future will be profitable or equal the performance of securities made in this report.
FactSet Disclosure: Navellier does not independently calculate the statistical information included in the attached report. The calculation and the information are provided by FactSet, a company not related to Navellier. Although information contained in the report has been obtained from FactSet and is based on sources Navellier believes to be reliable, Navellier does not guarantee its accuracy, and it may be incomplete or condensed. The report and the related FactSet sourced information are provided on an “as is” basis. The user assumes the entire risk of any use made of this information. Investors should consider the report as only a single factor in making their investment decision. The report is for informational purposes only and is not intended as an offer or solicitation for the purchase or sale of a security. FactSet sourced information is the exclusive property of FactSet. Without prior written permission of FactSet, this information may not be reproduced, disseminated or used to create any financial products. All indices are unmanaged and performance of the indices include reinvestment of dividends and interest income, unless otherwise noted, are not illustrative of any particular investment and an investment cannot be made in any index. Past performance is no guarantee of future results.