by Jason Bodner
April 25, 2023
Opinions make us human. We spend endless time debating differing views. Having an opinion is easy. Voicing it well is hard. And then standing behind it in the face of vast disagreement is incredibly tough.
Take Graham Hancock’s work, for instance. This controversial figure (born 1950) has some radical opinions about the origins of humanity. He believes there was a lost civilization possessing advanced technological, astronomical, and even potentially telepathic skills that our current civilization has long forgotten. He believes ancient structures were incorrectly dated by archeologists – off by thousands or even tens of thousands of years. He was ridiculed, insulted, written off, and discredited since the 1980’s.
It must have been difficult to stick to his beliefs when he was publicly shamed. But it turns out he may be right… or at least the doors that were once closed to him have cracked open. Things really began to turn for him when a megalithic structure was unearthed in Turkey called Göbekli Tepe. Some call it the world’s first temple. Archeologists have unanimously agreed for decades that modern civilization began 6,000 years ago, but Göbekli Tepe has been undisputedly dated to 9,500 BCE, roughly 11,525 years ago.
Popular opinion may win you friends and influence. Unpopular opinion, however, may turn out to be right… much later on. It may also shift paradigms for a long time. I say this because I have had a bullish view since the fall of 2022. That view was – and in many ways still is – very unpopular. But I gave up on popularity contests long ago. High school convinced me that popularity is short-lived and of limited benefit. Those who pave new paths tend to travel alone for a long while until they are proven right.
In late September, I called for a significant rally, or a “Big Lift”. This was not prophetic. It was based on data analysis. All the data pointed to a media focused on negativity and not seeing the forest through the trees. Back then, we put forth a pile of evidence that suggested that stocks would rally, including:
- 1 ) The Big Money Index (BMI) had gone oversold, forecasting higher prices:
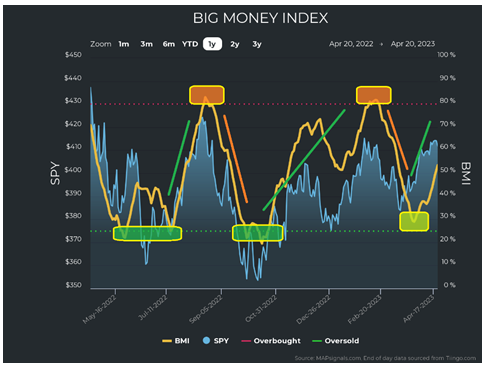
Graphs are for illustrative and discussion purposes only. Please read important disclosures at the end of this commentary.
2 ) Seasonality and mid-term election years pointed to an upside:
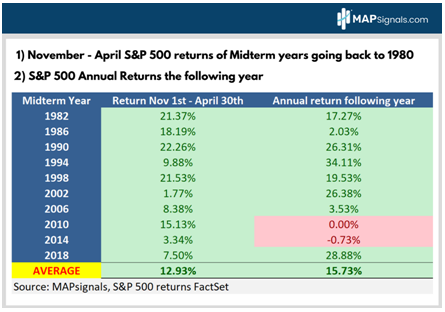
Graphs are for illustrative and discussion purposes only. Please read important disclosures at the end of this commentary.
- 3 ) Buying and selling data for both stocks and ETFs suggested prices were headed higher:
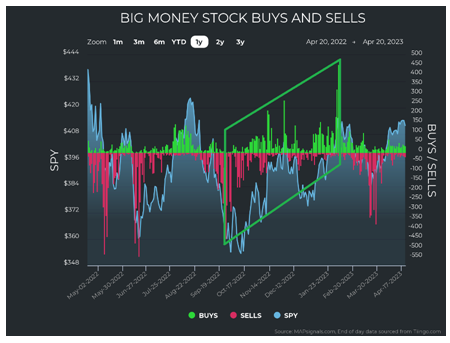
Graphs are for illustrative and discussion purposes only. Please read important disclosures at the end of this commentary.
- 4 ) Least popular of all, I suggested that tech stocks, with a focus on semiconductors and software, would lead the way. I suggested that investors looking for value might look to growth stocks.
Six Months Later – How Did Those Predictions Work Out?
I was told in not-so-many words that I was nuts: I was ignoring the facts. I didn’t understand the severity of the economic situation. Well, let’s move forward six months and see what happened:
- 1 ) Major indexes rallied significantly, roughly 15%:
-
- a. Dow Jones +15.7%
- b. NASDAQ + 15.6%
- c. S&P 500 + 15.3%
- 2 ) The Information Technology Sector Index rallied an eye-popping +26.3%. The NASDAQ 100 rallied +20.3%. And the PHLX Semis index rocketed 37.2%.
- 3 ) Russell Growth (c. 14%) outperformed Russell Value (averaging under 9%) significantly.
I’ve highlighted the above in the performance table below:
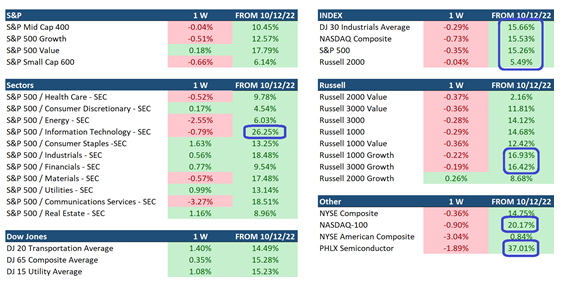
Graphs are for illustrative and discussion purposes only. Please read important disclosures at the end of this commentary.
They say it’s better to be lucky than smart. I say I’d rather be unpopular and right than popular and wrong. But, again, just to stress this: It wasn’t my opinion. That view was born from data and cultivated from the analysis of what the data said, so today’s question is: What is the data saying now?
-
- 1 ) The data says markets should continue marching higher – at least for a little while. First and foremost, the Big Money Index is on the rise. Consulting the BMI chart above, we can see it went within a kiss of being oversold in March, and has been rising ever since.
-
- 2 ) Selling has evaporated and the stage is set for buying to potentially take control. For clarity, that hasn’t happened decisively yet, but seeing more buying than selling is definitely a good sign:
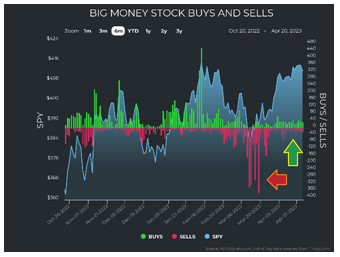
Graphs are for illustrative and discussion purposes only. Please read important disclosures at the end of this commentary.
- 3 ) Sector leadership is still in the strength areas I forecast in the fall of 2022. Tech and discretionary remain in the top positions while financials, communications, and real estate bring up the rear:
![]()
Graphs are for illustrative and discussion purposes only. Please read important disclosures at the end of this commentary.
- 4 ) If we look at individual sectors, we see strength returning to previously weak areas. Here I’d like to focus on the “middle” sectors. As I mentioned before, tech and discretionary remain strong:
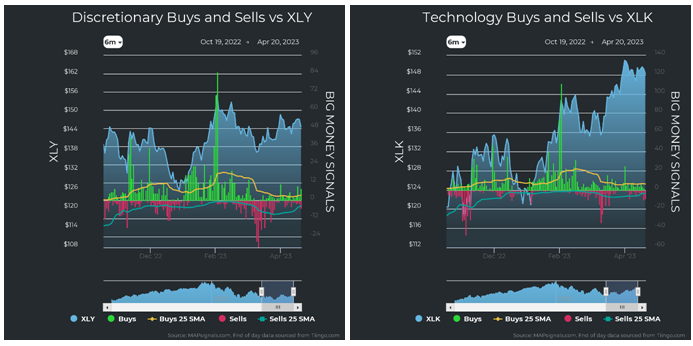
Graphs are for illustrative and discussion purposes only. Please read important disclosures at the end of this commentary.
But look at how selling ripped through some sectors only to give way to new strength. We see that in industrials, materials, energy, staples, health care, and utilities:
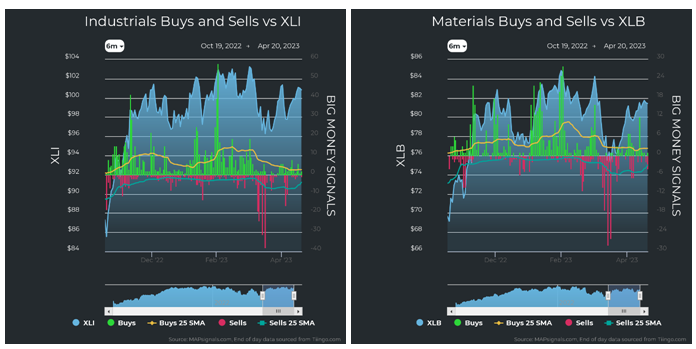
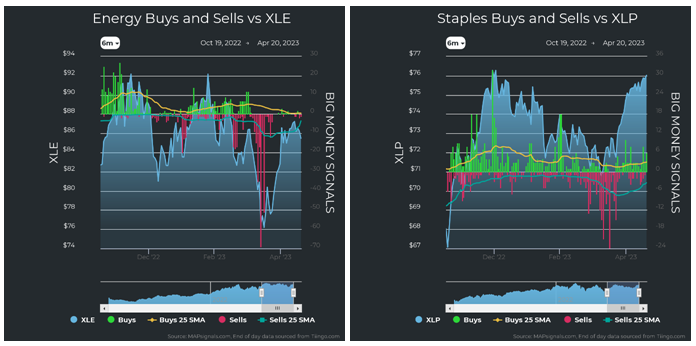
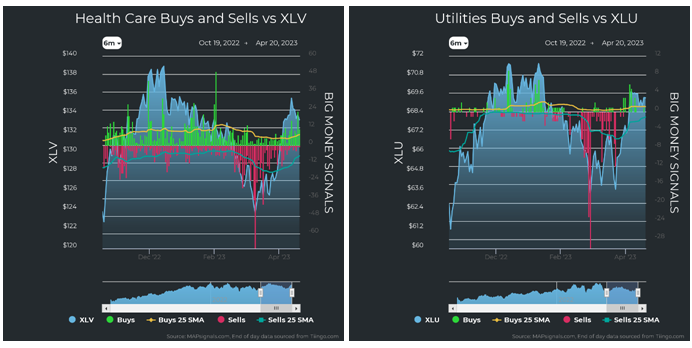
Graphs are for illustrative and discussion purposes only. Please read important disclosures at the end of this commentary.
This is crucial because if we want a strong bull market, we can’t just have it in two sectors. We need other weakened areas to firm up, and that’s what we have seen here. Heck, even in the scarier sectors like financials, communications, and real estate we see signs of vanishing selling and small chutes of buying:
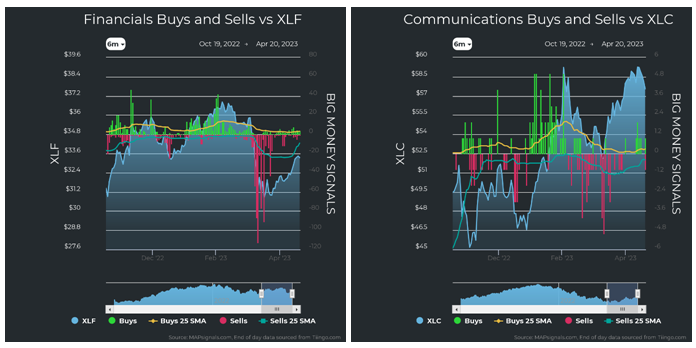
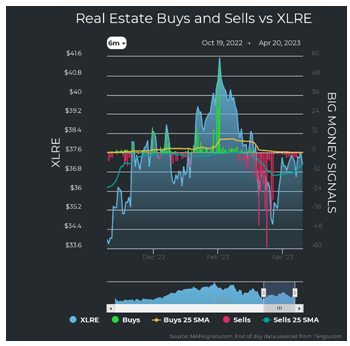
Graphs are for illustrative and discussion purposes only. Please read important disclosures at the end of this commentary.
- 5 ) Perhaps the macro situation isn’t as cataclysmic as the headlines want us to believe the past few months. It’s telling in the following chart that the Fed Funds Effective rate is nearly at parity with inflation (all items). The last time it was this close was almost exactly three years ago:
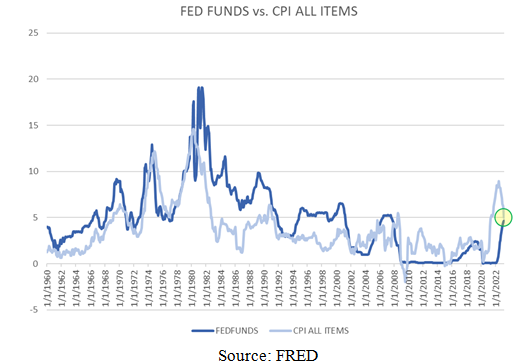
Graphs are for illustrative and discussion purposes only. Please read important disclosures at the end of this commentary.
- 6 ) Lastly, earnings season is upon us. Early indications show that earnings are working. According to the FactSet Earnings Insight (which admittedly was last updated 4/14/23) 90% of S&P 500 companies beat EPS surprise and 63% beat revenue estimates. Earnings are declining, as expected. That said, large bank earnings were good. And as I write this, more than half the 83 companies reporting to this point are beating earnings estimates.
The short story is that there is a lot to be positive about. As earnings continue to emerge and inflation continues to fall, the data points to more upside.
Opinions may not be popular, but that doesn’t mean they are wrong. Perhaps William Penn thought so when he said: “Avoid popularity; it has many snares, and no real benefit.”
All content above represents the opinion of Jason Bodner of Navellier & Associates, Inc.
Also In This Issue
A Look Ahead by Louis Navellier
The G7 Nations Struggle with Climate Change Policy
Income Mail by Bryan Perry
Confluence of Data, Earnings, and Fed Policy Take Center Stage
Growth Mail by Gary Alexander
No Downside Risk! What a Wonderful World!
Global Mail by Ivan Martchev
The Stock Market Has Reached a Fork in the Road
Sector Spotlight by Jason Bodner
Opinions are Cheap – Accurate Data Is Priceless
View Full Archive
Read Past Issues Here

Jason Bodner
MARKETMAIL EDITOR FOR SECTOR SPOTLIGHT
Jason Bodner writes Sector Spotlight in the weekly Marketmail publication and has authored several white papers for the company. He is also Co-Founder of Macro Analytics for Professionals which produces proprietary equity accumulation/distribution research for its clients. Previously, Mr. Bodner served as Director of European Equity Derivatives for Cantor Fitzgerald Europe in London, then moved to the role of Head of Equity Derivatives North America for the same company in New York. He also served as S.V.P. Equity Derivatives for Jefferies, LLC. He received a B.S. in business administration in 1996, with honors, from Skidmore College as a member of the Periclean Honors Society. All content of “Sector Spotlight” represents the opinion of Jason Bodner
Important Disclosures:
Jason Bodner is a co-founder and co-owner of Mapsignals. Mr. Bodner is an independent contractor who is occasionally hired by Navellier & Associates to write an article and or provide opinions for possible use in articles that appear in Navellier & Associates weekly Market Mail. Mr. Bodner is not employed or affiliated with Louis Navellier, Navellier & Associates, Inc., or any other Navellier owned entity. The opinions and statements made here are those of Mr. Bodner and not necessarily those of any other persons or entities. This is not an endorsement, or solicitation or testimonial or investment advice regarding the BMI Index or any statements or recommendations or analysis in the article or the BMI Index or Mapsignals or its products or strategies.
Although information in these reports has been obtained from and is based upon sources that Navellier believes to be reliable, Navellier does not guarantee its accuracy and it may be incomplete or condensed. All opinions and estimates constitute Navellier’s judgment as of the date the report was created and are subject to change without notice. These reports are for informational purposes only and are not a solicitation for the purchase or sale of a security. Any decision to purchase securities mentioned in these reports must take into account existing public information on such securities or any registered prospectus.To the extent permitted by law, neither Navellier & Associates, Inc., nor any of its affiliates, agents, or service providers assumes any liability or responsibility nor owes any duty of care for any consequences of any person acting or refraining to act in reliance on the information contained in this communication or for any decision based on it.
Past performance is no indication of future results. Investment in securities involves significant risk and has the potential for partial or complete loss of funds invested. It should not be assumed that any securities recommendations made by Navellier. in the future will be profitable or equal the performance of securities made in this report. Dividend payments are not guaranteed. The amount of a dividend payment, if any, can vary over time and issuers may reduce dividends paid on securities in the event of a recession or adverse event affecting a specific industry or issuer.
None of the stock information, data, and company information presented herein constitutes a recommendation by Navellier or a solicitation to buy or sell any securities. Any specific securities identified and described do not represent all of the securities purchased, sold, or recommended for advisory clients. The holdings identified do not represent all of the securities purchased, sold, or recommended for advisory clients and the reader should not assume that investments in the securities identified and discussed were or will be profitable.
Information presented is general information that does not take into account your individual circumstances, financial situation, or needs, nor does it present a personalized recommendation to you. Individual stocks presented may not be suitable for every investor. Investment in securities involves significant risk and has the potential for partial or complete loss of funds invested. Investment in fixed income securities has the potential for the investment return and principal value of an investment to fluctuate so that an investor’s holdings, when redeemed, may be worth less than their original cost.
One cannot invest directly in an index. Index is unmanaged and index performance does not reflect deduction of fees, expenses, or taxes. Presentation of Index data does not reflect a belief by Navellier that any stock index constitutes an investment alternative to any Navellier equity strategy or is necessarily comparable to such strategies. Among the most important differences between the Indices and Navellier strategies are that the Navellier equity strategies may (1) incur material management fees, (2) concentrate its investments in relatively few stocks, industries, or sectors, (3) have significantly greater trading activity and related costs, and (4) be significantly more or less volatile than the Indices.
ETF Risk: We may invest in exchange traded funds (“ETFs”) and some of our investment strategies are generally fully invested in ETFs. Like traditional mutual funds, ETFs charge asset-based fees, but they generally do not charge initial sales charges or redemption fees and investors typically pay only customary brokerage fees to buy and sell ETF shares. The fees and costs charged by ETFs held in client accounts will not be deducted from the compensation the client pays Navellier. ETF prices can fluctuate up or down, and a client account could lose money investing in an ETF if the prices of the securities owned by the ETF go down. ETFs are subject to additional risks:
- ETF shares may trade above or below their net asset value;
- An active trading market for an ETF’s shares may not develop or be maintained;
- The value of an ETF may be more volatile than the underlying portfolio of securities the ETF is designed to track;
- The cost of owning shares of the ETF may exceed those a client would incur by directly investing in the underlying securities; and
- Trading of an ETF’s shares may be halted if the listing exchange’s officials deem it appropriate, the shares are delisted from the exchange, or the activation of market-wide “circuit breakers” (which are tied to large decreases in stock prices) halts stock trading generally.
Grader Disclosures: Investment in equity strategies involves substantial risk and has the potential for partial or complete loss of funds invested. The sample portfolio and any accompanying charts are for informational purposes only and are not to be construed as a solicitation to buy or sell any financial instrument and should not be relied upon as the sole factor in an investment making decision. As a matter of normal and important disclosures to you, as a potential investor, please consider the following: The performance presented is not based on any actual securities trading, portfolio, or accounts, and the reported performance of the A, B, C, D, and F portfolios (collectively the “model portfolios”) should be considered mere “paper” or pro forma performance results based on Navellier’s research.
Investors evaluating any of Navellier & Associates, Inc.’s, (or its affiliates’) Investment Products must not use any information presented here, including the performance figures of the model portfolios, in their evaluation of any Navellier Investment Products. Navellier Investment Products include the firm’s mutual funds and managed accounts. The model portfolios, charts, and other information presented do not represent actual funded trades and are not actual funded portfolios. There are material differences between Navellier Investment Products’ portfolios and the model portfolios, research, and performance figures presented here. The model portfolios and the research results (1) may contain stocks or ETFs that are illiquid and difficult to trade; (2) may contain stock or ETF holdings materially different from actual funded Navellier Investment Product portfolios; (3) include the reinvestment of all dividends and other earnings, estimated trading costs, commissions, or management fees; and, (4) may not reflect prices obtained in an actual funded Navellier Investment Product portfolio. For these and other reasons, the reported performances of model portfolios do not reflect the performance results of Navellier’s actually funded and traded Investment Products. In most cases, Navellier’s Investment Products have materially lower performance results than the performances of the model portfolios presented.
This report contains statements that are, or may be considered to be, forward-looking statements. All statements that are not historical facts, including statements about our beliefs or expectations, are “forward-looking statements” within the meaning of The U.S. Private Securities Litigation Reform Act of 1995. These statements may be identified by such forward-looking terminology as “expect,” “estimate,” “plan,” “intend,” “believe,” “anticipate,” “may,” “will,” “should,” “could,” “continue,” “project,” or similar statements or variations of such terms. Our forward-looking statements are based on a series of expectations, assumptions, and projections, are not guarantees of future results or performance, and involve substantial risks and uncertainty as described in Form ADV Part 2A of our filing with the Securities and Exchange Commission (SEC), which is available at www.adviserinfo.sec.gov or by requesting a copy by emailing info@navellier.com. All of our forward-looking statements are as of the date of this report only. We can give no assurance that such expectations or forward-looking statements will prove to be correct. Actual results may differ materially. You are urged to carefully consider all such factors.
FEDERAL TAX ADVICE DISCLAIMER: As required by U.S. Treasury Regulations, you are informed that, to the extent this presentation includes any federal tax advice, the presentation is not written by Navellier to be used, and cannot be used, for the purpose of avoiding federal tax penalties. Navellier does not advise on any income tax requirements or issues. Use of any information presented by Navellier is for general information only and does not represent tax advice either express or implied. You are encouraged to seek professional tax advice for income tax questions and assistance.
IMPORTANT NEWSLETTER DISCLOSURE:The hypothetical performance results for investment newsletters that are authored or edited by Louis Navellier, including Louis Navellier’s Growth Investor, Louis Navellier’s Breakthrough Stocks, Louis Navellier’s Accelerated Profits, and Louis Navellier’s Platinum Club, are not based on any actual securities trading, portfolio, or accounts, and the newsletters’ reported hypothetical performances should be considered mere “paper” or proforma hypothetical performance results and are not actual performance of real world trades. Navellier & Associates, Inc. does not have any relation to or affiliation with the owner of these newsletters. There are material differences between Navellier Investment Products’ portfolios and the InvestorPlace Media, LLC newsletter portfolios authored by Louis Navellier. The InvestorPlace Media, LLC newsletters contain hypothetical performance that do not include transaction costs, advisory fees, or other fees a client might incur if actual investments and trades were being made by an investor. As a result, newsletter performance should not be used to evaluate Navellier Investment services which are separate and different from the newsletters. The owner of the newsletters is InvestorPlace Media, LLC and any questions concerning the newsletters, including any newsletter advertising or hypothetical Newsletter performance claims, (which are calculated solely by Investor Place Media and not Navellier) should be referred to InvestorPlace Media, LLC at (800) 718-8289.
Please note that Navellier & Associates and the Navellier Private Client Group are managed completely independent of the newsletters owned and published by InvestorPlace Media, LLC and written and edited by Louis Navellier, and investment performance of the newsletters should in no way be considered indicative of potential future investment performance for any Navellier & Associates separately managed account portfolio. Potential investors should consult with their financial advisor before investing in any Navellier Investment Product.
Navellier claims compliance with Global Investment Performance Standards (GIPS). To receive a complete list and descriptions of Navellier’s composites and/or a presentation that adheres to the GIPS standards, please contact Navellier or click here. It should not be assumed that any securities recommendations made by Navellier & Associates, Inc. in the future will be profitable or equal the performance of securities made in this report.
FactSet Disclosure: Navellier does not independently calculate the statistical information included in the attached report. The calculation and the information are provided by FactSet, a company not related to Navellier. Although information contained in the report has been obtained from FactSet and is based on sources Navellier believes to be reliable, Navellier does not guarantee its accuracy, and it may be incomplete or condensed. The report and the related FactSet sourced information are provided on an “as is” basis. The user assumes the entire risk of any use made of this information. Investors should consider the report as only a single factor in making their investment decision. The report is for informational purposes only and is not intended as an offer or solicitation for the purchase or sale of a security. FactSet sourced information is the exclusive property of FactSet. Without prior written permission of FactSet, this information may not be reproduced, disseminated or used to create any financial products. All indices are unmanaged and performance of the indices include reinvestment of dividends and interest income, unless otherwise noted, are not illustrative of any particular investment and an investment cannot be made in any index. Past performance is no guarantee of future results.