by Gary Alexander
April 25, 2023
What if the stocks in your portfolio always went up – you could gaze serenely at a field of green on your screen every day. Wouldn’t that be loverly? I think that’s what your friendly Congress, President, Federal Reserve, (and now even the Supreme Court) plan for your future. Here are just a few recent examples:
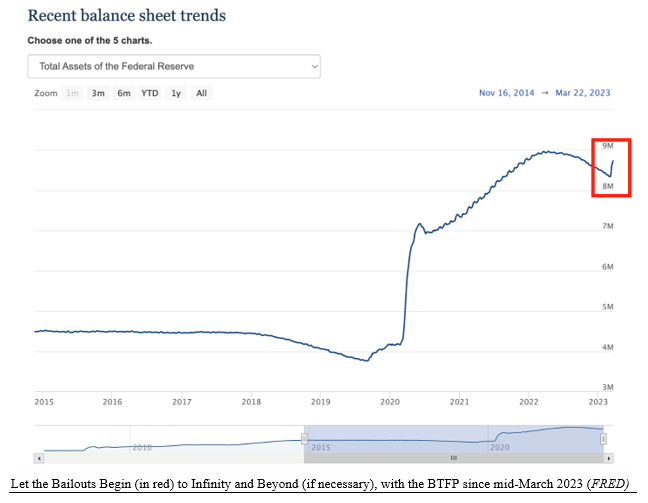
- On Sunday morning, March 12, Treasury Secretary Janet Yellen told CBS’ “Face the Nation” there would be no bailouts after the failure of Silicon Valley Bank the previous Friday. (“Yellen rules out bailout for Silicon Valley Bank: ‘We’re not going to do that again.’”) Later that same day, however, the Federal Reserve declared bailouts “to infinity and beyond,” in their new Bank Term Funding Program, providing relief to “AnyS. federally insured depository institution.” Payments would be at “100% of par value” rather than at the real (“mark to market”) bid value.
Graphs are for illustrative and discussion purposes only. Please read important disclosures at the end of this commentary.
This verified one of my political laws (LOCO: The Law of Cabinet Officers): “To be a Secretary, you must be willing to take Dictation.” In this case, Janet Yellen had to take orders from President Biden.
- On Thursday, April 13, the Supreme Court turned down an appeal from colleges to review a case involving a settlement of $6 billion in student loans. Previously, on March 3, the U.S. Education Departmentbegan discharging hundreds of thousands of loans from borrowers in a class-action lawsuit, clearing the way for the Biden administration to forgive billions more in college loans.
- On April 19, as the debt ceiling approached faster than expected, U.S. House Speaker Kevin McCarthy outlined an austere Republican package that included $4.5 trillion in spending cuts, limiting spending growth to 1% a year and reverting to 2022 spending – trying to force President Biden to the bargaining table – but the President continued to avoid any bargaining offer, as the debt ceiling fast approached, with the sides farther apart than ever, and a debt default looming.
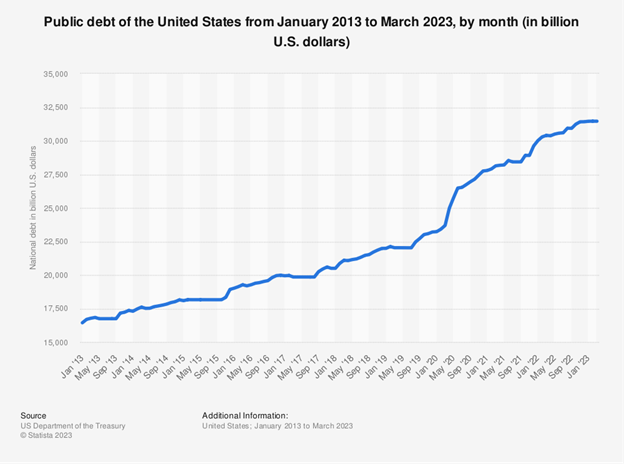
The U.S. debt has soared 10-fold since 1990 and over 5-fold since 2001. It took 200 years and 40 U.S. Presidents to roll up $3 trillion in public debts, but then it took only 32 years and six Presidents to multiply that total 10-fold to nearly $32 trillion – with no Great Depression or World War in that time.
Total debt has nearly doubled in the last decade, from $16 trillion in 2013 to nearly $32 trillion now.
Graphs are for illustrative and discussion purposes only. Please read important disclosures at the end of this commentary.
| Year | Accumulated public debt (billion) | |
| 1990 | $3,233 | (5-year rise) |
| 1995 | $4,975 | $+53.9% |
| 2000 | $5,674 | +14.1% |
| 2005 | $7,932 | +39.8% |
| 2010 | $13,561 | +71.0% |
| 2015 | $18,150 | +33.8% |
| 2020 | $26,945 | +46.0% |
| 2023 (3-31) | $31,463 | +18.8% (in 2+ years) |
| Source: U.S. Department of Treasury; Statista | ||
Despite this, it doesn’t seem like one in 10 members of Congress cares, only promising more programs, more bailouts, unending spending, and imaginary new “taxes on the rich,” which never work, since those investments the rich hold offer no guarantee of always rising. When they all sell their assets – stocks fall!
When Discipline Fails – Printing Presses Heat Up, and Values Break Down
It’s time to enter our historical Time Machine once again. No past period is perfect in comparison, but 100 years ago has some chilling parallels, starting with a global pandemic, a rise in racial tensions, disorder at the southern border, a market crash, controversial presidencies, and more, but the scariest warning is a debt explosion and hyperinflation in Europe, which was not limited to Germany.
- From 1913 to 1921, the British money supply grew from 28.7 billion to 127.3 billion pound sterling, a five-fold increase, in what British economist Edwin Cannon called a “diarrhea of pounds.” British debt grew from 717 million pounds in 1913 to 7.8 billion in 1920 (+988%).
- The French money supply was 5.7 billion francs in 1913 and 38.2 billion in 1920 (+570%). French debt grew from 32.9 billion francs before the war to 240 billion in 1920 (+484%).
- The Italian lire supply grew from 1.6 billion in 1913 to 14.2 billion in 1921 (+788%). Italy did not spend as much, but their debt was 15 billion lire in 1913 and 92 billion in 1921 (+513%).
(Richard Ebeling, “The Great German and Austrian Inflations 100 Years Ago,” fff.org, March 2023)
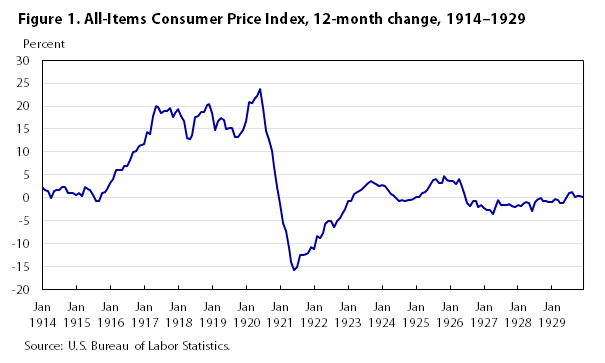
The United States was only involved for the last 18 months of the 52-month war, but U.S. money supply grew by 70% in two years from the non-war year of 1916 to the war year of 1918. Only 22% of U.S. war costs were covered by the new sky-high income tax, with 53% coming from War Bonds and 25% from printing new money. All this created record-high wartime CPI inflation in the U.S. of 18.1% in 1917, 20.4% in 1918, and 14.5% in 1919, for a total price gain of 88% in the five cumulative years, 1916-1920.
President Harding handled the postwar inflation well, enduring the 1920-21 Depression as the right medicine to cure inflation, resulting in the low-inflationary boom of the Roaring 20s that followed.
Graphs are for illustrative and discussion purposes only. Please read important disclosures at the end of this commentary.
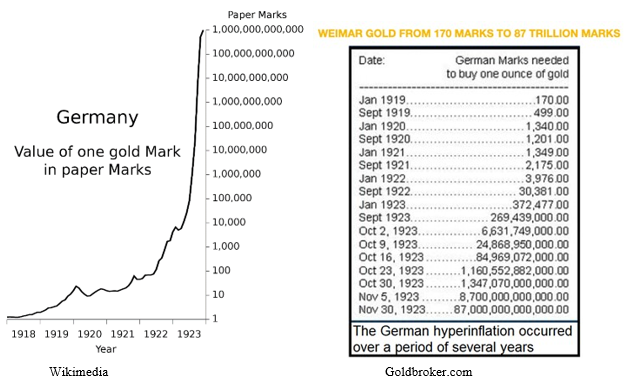
Germany’s hyper-inflation started before the first guns fired. The German government ended all gold redemption for their mark on July 29, 1914. The next week, the German Reichsbank approved a wide array of war spending financed by newly printed money. During the four-year war, German paper money grew 14-fold, from 2.37 to 33.11 billion marks. In the four post-war years of 1919-22, money supply grew 26-fold, from 50 billion to 1,310.7 billion marks, but then the presses went into overdrive. In 1923 alone, the money supply increased to 518,538,326,350,000,000,000 marks. That’s 518 quintillion marks.
Graphs are for illustrative and discussion purposes only. Please read important disclosures at the end of this commentary.
There’s no use getting into percentage increases, or stories about wheelbarrows full of money. According to Gustav Stolper, in The Germany Economy, 1870-1940, “More than 30 paper mills worked at top speed and capacity to deliver notepaper to the Reichsbank, and 150 printing firms had 2,000 presses running day and night to print the Reichsbank notes.” But it was futile, as prices doubled by the hour, then the minute.
Assets seemed to rise in value, but it was an illusion. Elderly couples and families lost their life savings in vehicles like bonds, cash, or stocks. The result was political unrest, including Adolf Hitler’s aborted Beer Hall Putsch in Munich in November 1923. The mark died, replaced by the Rentenmark. In Austria, a gold standard was established, and a new Austrian shilling was issued with printing press restrictions.
None of this nightmare is likely to happen in the U.S. or Europe in the foreseeable future, but the danger we face is rapidly expanding money supplies after nearly 14 years of near-zero interest rates, causing widespread misallocations of capital investment and excessive speculation and consumer spending.
In the last year, the Fed has raised rates at the fastest pace in history while trying to cut back liquidity. Now, they face bailout challenges in a never-ending game of “chicken.” As Janet Yellen discovered, bailouts are NOT a thing of the past. Politicians will continue their bailouts – except for us investors.
Navellier & Associates does not own Silicon Valley Bank (SVB) in managed accounts. Gary Alexander does not own Silicon Valley Bank (SVB), personally.
All content above represents the opinion of Gary Alexander of Navellier & Associates, Inc.
Also In This Issue
A Look Ahead by Louis Navellier
The G7 Nations Struggle with Climate Change Policy
Income Mail by Bryan Perry
Confluence of Data, Earnings, and Fed Policy Take Center Stage
Growth Mail by Gary Alexander
No Downside Risk! What a Wonderful World!
Global Mail by Ivan Martchev
The Stock Market Has Reached a Fork in the Road
Sector Spotlight by Jason Bodner
Opinions are Cheap – Accurate Data Is Priceless
View Full Archive
Read Past Issues Here
About The Author

Gary Alexander
SENIOR EDITOR
Gary Alexander has been Senior Writer at Navellier since 2009. He edits Navellier’s weekly Marketmail and writes a weekly Growth Mail column, in which he uses market history to support the case for growth stocks. For the previous 20 years before joining Navellier, he was Senior Executive Editor at InvestorPlace Media (formerly Phillips Publishing), where he worked with several leading investment analysts, including Louis Navellier (since 1997), helping launch Louis Navellier’s Blue Chip Growth and Global Growth newsletters.
Prior to that, Gary edited Wealth Magazine and Gold Newsletter and wrote various investment research reports for Jefferson Financial in New Orleans in the 1980s. He began his financial newsletter career with KCI Communications in 1980, where he served as consulting editor for Personal Finance newsletter while serving as general manager of KCI’s Alexandria House book division. Before that, he covered the economics beat for news magazines. All content of “Growth Mail” represents the opinion of Gary Alexander
Important Disclosures:
Although information in these reports has been obtained from and is based upon sources that Navellier believes to be reliable, Navellier does not guarantee its accuracy and it may be incomplete or condensed. All opinions and estimates constitute Navellier’s judgment as of the date the report was created and are subject to change without notice. These reports are for informational purposes only and are not a solicitation for the purchase or sale of a security. Any decision to purchase securities mentioned in these reports must take into account existing public information on such securities or any registered prospectus.To the extent permitted by law, neither Navellier & Associates, Inc., nor any of its affiliates, agents, or service providers assumes any liability or responsibility nor owes any duty of care for any consequences of any person acting or refraining to act in reliance on the information contained in this communication or for any decision based on it.
Past performance is no indication of future results. Investment in securities involves significant risk and has the potential for partial or complete loss of funds invested. It should not be assumed that any securities recommendations made by Navellier. in the future will be profitable or equal the performance of securities made in this report. Dividend payments are not guaranteed. The amount of a dividend payment, if any, can vary over time and issuers may reduce dividends paid on securities in the event of a recession or adverse event affecting a specific industry or issuer.
None of the stock information, data, and company information presented herein constitutes a recommendation by Navellier or a solicitation to buy or sell any securities. Any specific securities identified and described do not represent all of the securities purchased, sold, or recommended for advisory clients. The holdings identified do not represent all of the securities purchased, sold, or recommended for advisory clients and the reader should not assume that investments in the securities identified and discussed were or will be profitable.
Information presented is general information that does not take into account your individual circumstances, financial situation, or needs, nor does it present a personalized recommendation to you. Individual stocks presented may not be suitable for every investor. Investment in securities involves significant risk and has the potential for partial or complete loss of funds invested. Investment in fixed income securities has the potential for the investment return and principal value of an investment to fluctuate so that an investor’s holdings, when redeemed, may be worth less than their original cost.
One cannot invest directly in an index. Index is unmanaged and index performance does not reflect deduction of fees, expenses, or taxes. Presentation of Index data does not reflect a belief by Navellier that any stock index constitutes an investment alternative to any Navellier equity strategy or is necessarily comparable to such strategies. Among the most important differences between the Indices and Navellier strategies are that the Navellier equity strategies may (1) incur material management fees, (2) concentrate its investments in relatively few stocks, industries, or sectors, (3) have significantly greater trading activity and related costs, and (4) be significantly more or less volatile than the Indices.
ETF Risk: We may invest in exchange traded funds (“ETFs”) and some of our investment strategies are generally fully invested in ETFs. Like traditional mutual funds, ETFs charge asset-based fees, but they generally do not charge initial sales charges or redemption fees and investors typically pay only customary brokerage fees to buy and sell ETF shares. The fees and costs charged by ETFs held in client accounts will not be deducted from the compensation the client pays Navellier. ETF prices can fluctuate up or down, and a client account could lose money investing in an ETF if the prices of the securities owned by the ETF go down. ETFs are subject to additional risks:
- ETF shares may trade above or below their net asset value;
- An active trading market for an ETF’s shares may not develop or be maintained;
- The value of an ETF may be more volatile than the underlying portfolio of securities the ETF is designed to track;
- The cost of owning shares of the ETF may exceed those a client would incur by directly investing in the underlying securities; and
- Trading of an ETF’s shares may be halted if the listing exchange’s officials deem it appropriate, the shares are delisted from the exchange, or the activation of market-wide “circuit breakers” (which are tied to large decreases in stock prices) halts stock trading generally.
Grader Disclosures: Investment in equity strategies involves substantial risk and has the potential for partial or complete loss of funds invested. The sample portfolio and any accompanying charts are for informational purposes only and are not to be construed as a solicitation to buy or sell any financial instrument and should not be relied upon as the sole factor in an investment making decision. As a matter of normal and important disclosures to you, as a potential investor, please consider the following: The performance presented is not based on any actual securities trading, portfolio, or accounts, and the reported performance of the A, B, C, D, and F portfolios (collectively the “model portfolios”) should be considered mere “paper” or pro forma performance results based on Navellier’s research.
Investors evaluating any of Navellier & Associates, Inc.’s, (or its affiliates’) Investment Products must not use any information presented here, including the performance figures of the model portfolios, in their evaluation of any Navellier Investment Products. Navellier Investment Products include the firm’s mutual funds and managed accounts. The model portfolios, charts, and other information presented do not represent actual funded trades and are not actual funded portfolios. There are material differences between Navellier Investment Products’ portfolios and the model portfolios, research, and performance figures presented here. The model portfolios and the research results (1) may contain stocks or ETFs that are illiquid and difficult to trade; (2) may contain stock or ETF holdings materially different from actual funded Navellier Investment Product portfolios; (3) include the reinvestment of all dividends and other earnings, estimated trading costs, commissions, or management fees; and, (4) may not reflect prices obtained in an actual funded Navellier Investment Product portfolio. For these and other reasons, the reported performances of model portfolios do not reflect the performance results of Navellier’s actually funded and traded Investment Products. In most cases, Navellier’s Investment Products have materially lower performance results than the performances of the model portfolios presented.
This report contains statements that are, or may be considered to be, forward-looking statements. All statements that are not historical facts, including statements about our beliefs or expectations, are “forward-looking statements” within the meaning of The U.S. Private Securities Litigation Reform Act of 1995. These statements may be identified by such forward-looking terminology as “expect,” “estimate,” “plan,” “intend,” “believe,” “anticipate,” “may,” “will,” “should,” “could,” “continue,” “project,” or similar statements or variations of such terms. Our forward-looking statements are based on a series of expectations, assumptions, and projections, are not guarantees of future results or performance, and involve substantial risks and uncertainty as described in Form ADV Part 2A of our filing with the Securities and Exchange Commission (SEC), which is available at www.adviserinfo.sec.gov or by requesting a copy by emailing info@navellier.com. All of our forward-looking statements are as of the date of this report only. We can give no assurance that such expectations or forward-looking statements will prove to be correct. Actual results may differ materially. You are urged to carefully consider all such factors.
FEDERAL TAX ADVICE DISCLAIMER: As required by U.S. Treasury Regulations, you are informed that, to the extent this presentation includes any federal tax advice, the presentation is not written by Navellier to be used, and cannot be used, for the purpose of avoiding federal tax penalties. Navellier does not advise on any income tax requirements or issues. Use of any information presented by Navellier is for general information only and does not represent tax advice either express or implied. You are encouraged to seek professional tax advice for income tax questions and assistance.
IMPORTANT NEWSLETTER DISCLOSURE:The hypothetical performance results for investment newsletters that are authored or edited by Louis Navellier, including Louis Navellier’s Growth Investor, Louis Navellier’s Breakthrough Stocks, Louis Navellier’s Accelerated Profits, and Louis Navellier’s Platinum Club, are not based on any actual securities trading, portfolio, or accounts, and the newsletters’ reported hypothetical performances should be considered mere “paper” or proforma hypothetical performance results and are not actual performance of real world trades. Navellier & Associates, Inc. does not have any relation to or affiliation with the owner of these newsletters. There are material differences between Navellier Investment Products’ portfolios and the InvestorPlace Media, LLC newsletter portfolios authored by Louis Navellier. The InvestorPlace Media, LLC newsletters contain hypothetical performance that do not include transaction costs, advisory fees, or other fees a client might incur if actual investments and trades were being made by an investor. As a result, newsletter performance should not be used to evaluate Navellier Investment services which are separate and different from the newsletters. The owner of the newsletters is InvestorPlace Media, LLC and any questions concerning the newsletters, including any newsletter advertising or hypothetical Newsletter performance claims, (which are calculated solely by Investor Place Media and not Navellier) should be referred to InvestorPlace Media, LLC at (800) 718-8289.
Please note that Navellier & Associates and the Navellier Private Client Group are managed completely independent of the newsletters owned and published by InvestorPlace Media, LLC and written and edited by Louis Navellier, and investment performance of the newsletters should in no way be considered indicative of potential future investment performance for any Navellier & Associates separately managed account portfolio. Potential investors should consult with their financial advisor before investing in any Navellier Investment Product.
Navellier claims compliance with Global Investment Performance Standards (GIPS). To receive a complete list and descriptions of Navellier’s composites and/or a presentation that adheres to the GIPS standards, please contact Navellier or click here. It should not be assumed that any securities recommendations made by Navellier & Associates, Inc. in the future will be profitable or equal the performance of securities made in this report.
FactSet Disclosure: Navellier does not independently calculate the statistical information included in the attached report. The calculation and the information are provided by FactSet, a company not related to Navellier. Although information contained in the report has been obtained from FactSet and is based on sources Navellier believes to be reliable, Navellier does not guarantee its accuracy, and it may be incomplete or condensed. The report and the related FactSet sourced information are provided on an “as is” basis. The user assumes the entire risk of any use made of this information. Investors should consider the report as only a single factor in making their investment decision. The report is for informational purposes only and is not intended as an offer or solicitation for the purchase or sale of a security. FactSet sourced information is the exclusive property of FactSet. Without prior written permission of FactSet, this information may not be reproduced, disseminated or used to create any financial products. All indices are unmanaged and performance of the indices include reinvestment of dividends and interest income, unless otherwise noted, are not illustrative of any particular investment and an investment cannot be made in any index. Past performance is no guarantee of future results.