by Jason Bodner
March 5, 2024
Humans crave stability, above all else. We want predictable outcomes, like safe retirements, with no surprises. We feel most comfortable with nothing to worry about.
Reality, of course, is different. What’s that old saying? “Man plans, God laughs!”
We try to plan our lives based around preventing disruptions. A case in point is our reliance on electricity. Most of the world functions on modern electronics. They govern everything from communications, traffic lights, flight control, work, play … you name it. But what if we woke up tomorrow and it was all gone… dead in the water – non-functioning? We largely discount that as a possibility, but an Electro-Magnetic Pulse (EMP) from space could easily knock us back into the Stone Age in a matter of days.
We laugh that off, but an 1859 solar disruption called the Carrington Event caused telegraph stations to catch fire. The state of technology in 1859 was primitive, compared to today, when a large solar flare could render us powerless instantaneously. We simply can’t plan for this most catastrophic event.
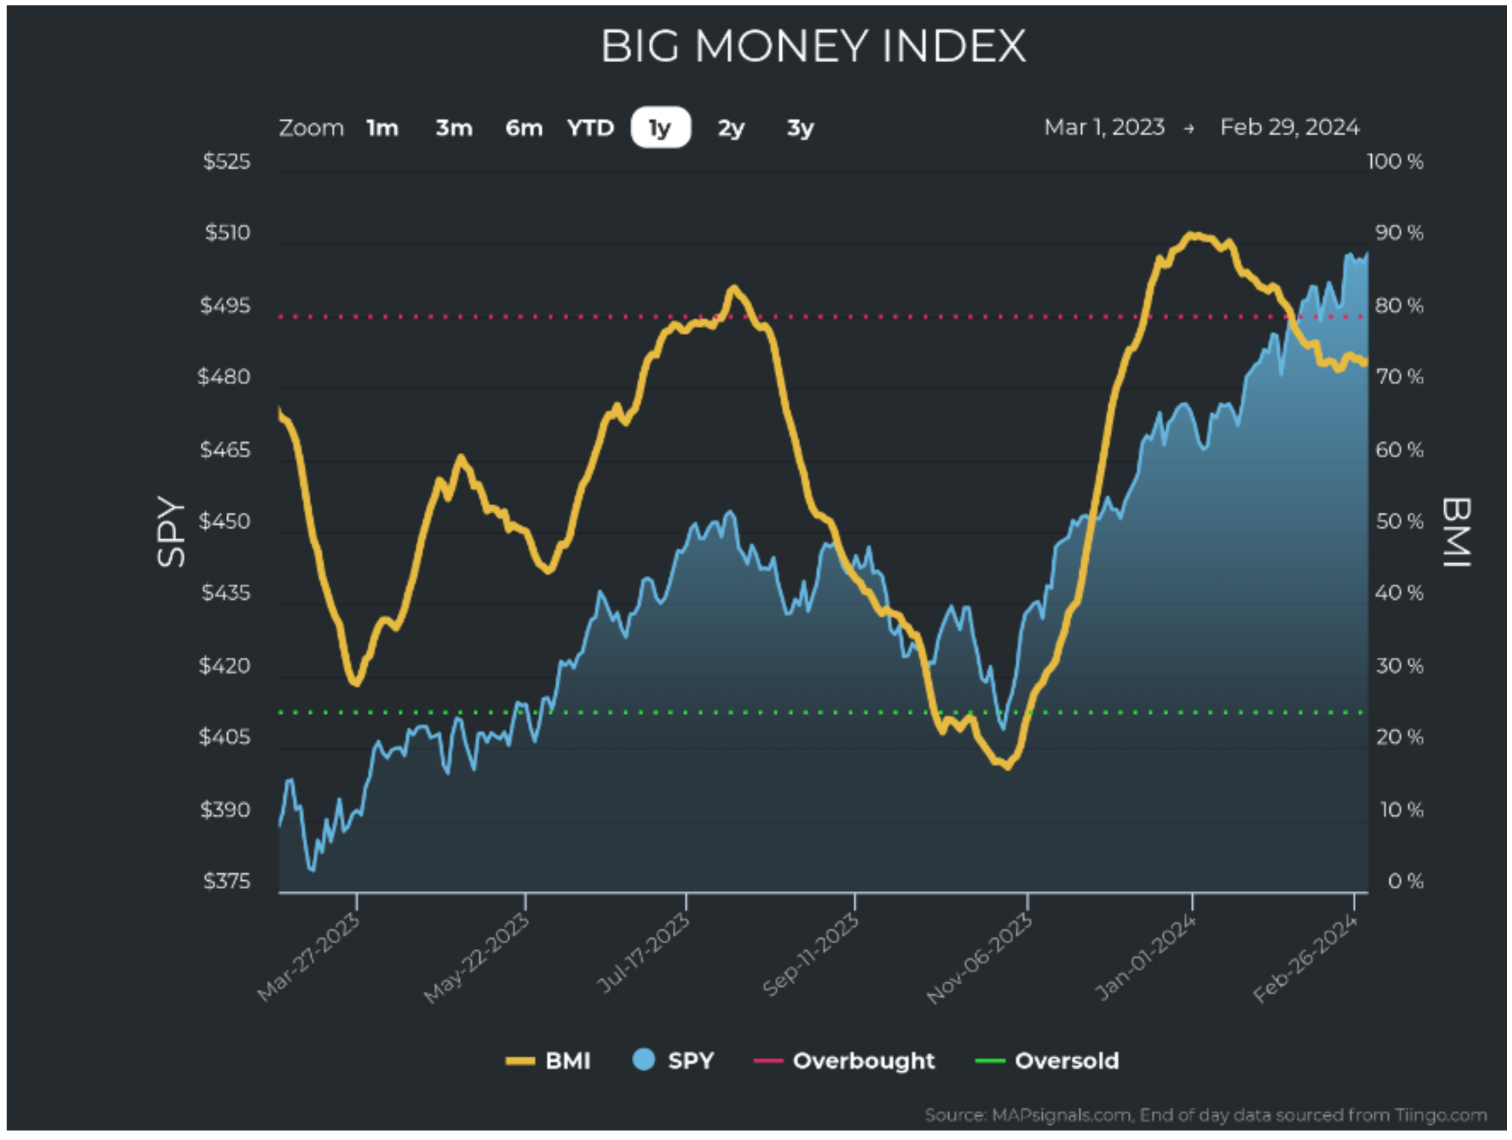
This is why when it comes to investing, I prefer to combine two approaches: First, I plan by stacking the odds in my favor, but then I always react to what the market does in real time. Right now, the planner in me saw the Big Money Index (BMI) fall from overbought, so I prepared for a market drop, and was ready to shed risk. But the drop never came. Instead, the data is constructive for earnings and for price action.
Graphs are for illustrative and discussion purposes only. Please read important disclosures at the end of this commentary.
The message this week is the same: steady as she goes until the data shifts. This is a time when events can be counterintuitive. You may wonder: Isn’t the BMI falling from overbought a negative sign?
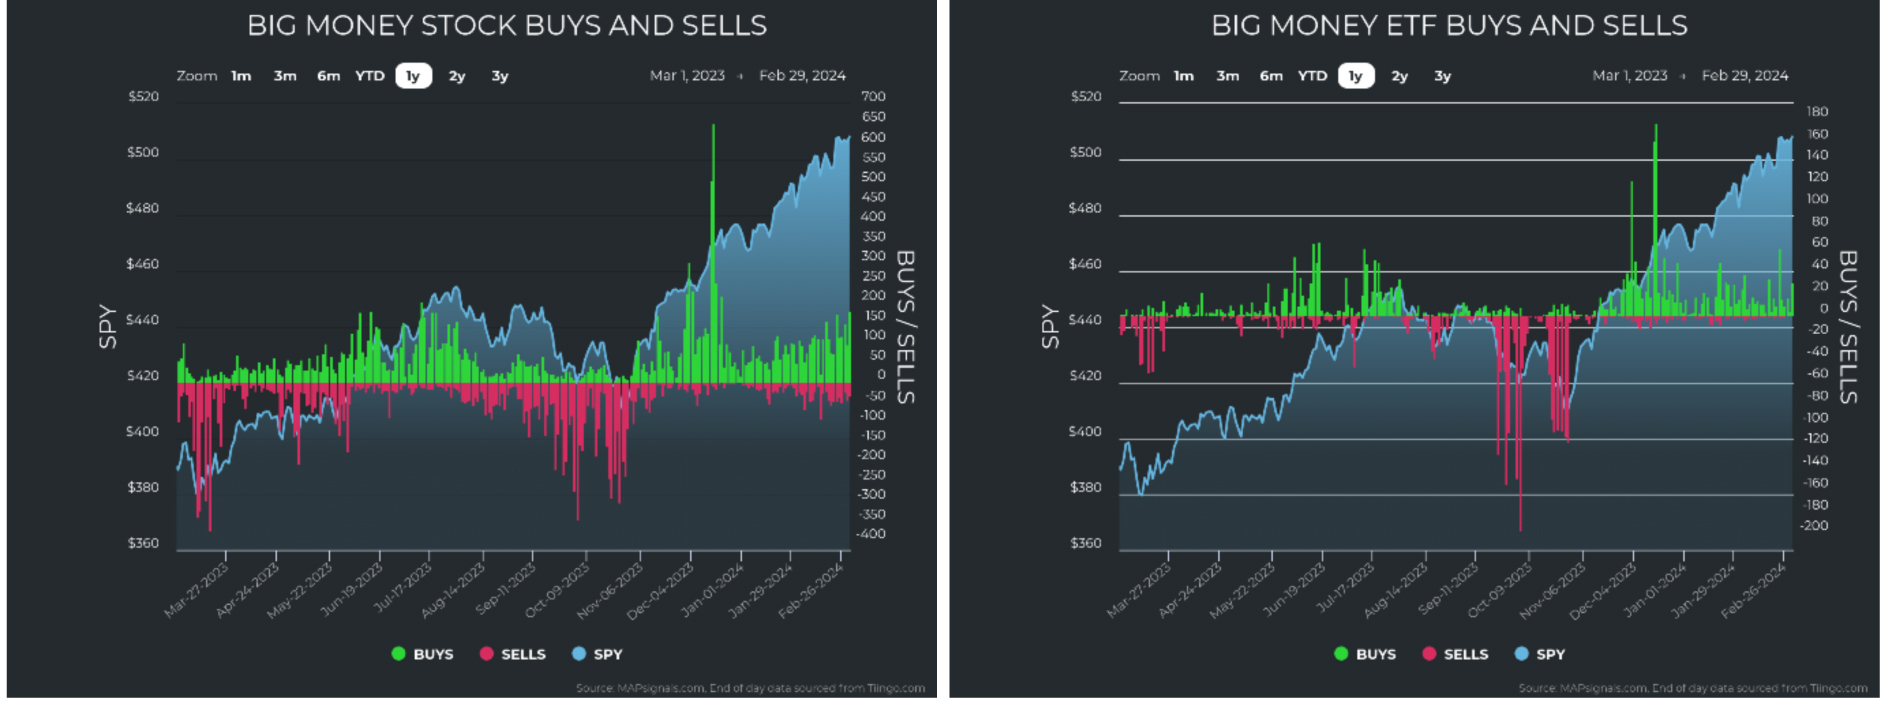
Like most things in life – it depends. In this case, as I have highlighted recently, the fall from overbought was not caused by an increase in selling. It was, in fact, caused by a decrease in buying from high levels in December. We can see that with the huge green spikes below in the stock and ETF charts of unusually large buying and selling. You’ll notice that the red (selling) since has been very low:
Graphs are for illustrative and discussion purposes only. Please read important disclosures at the end of this commentary.
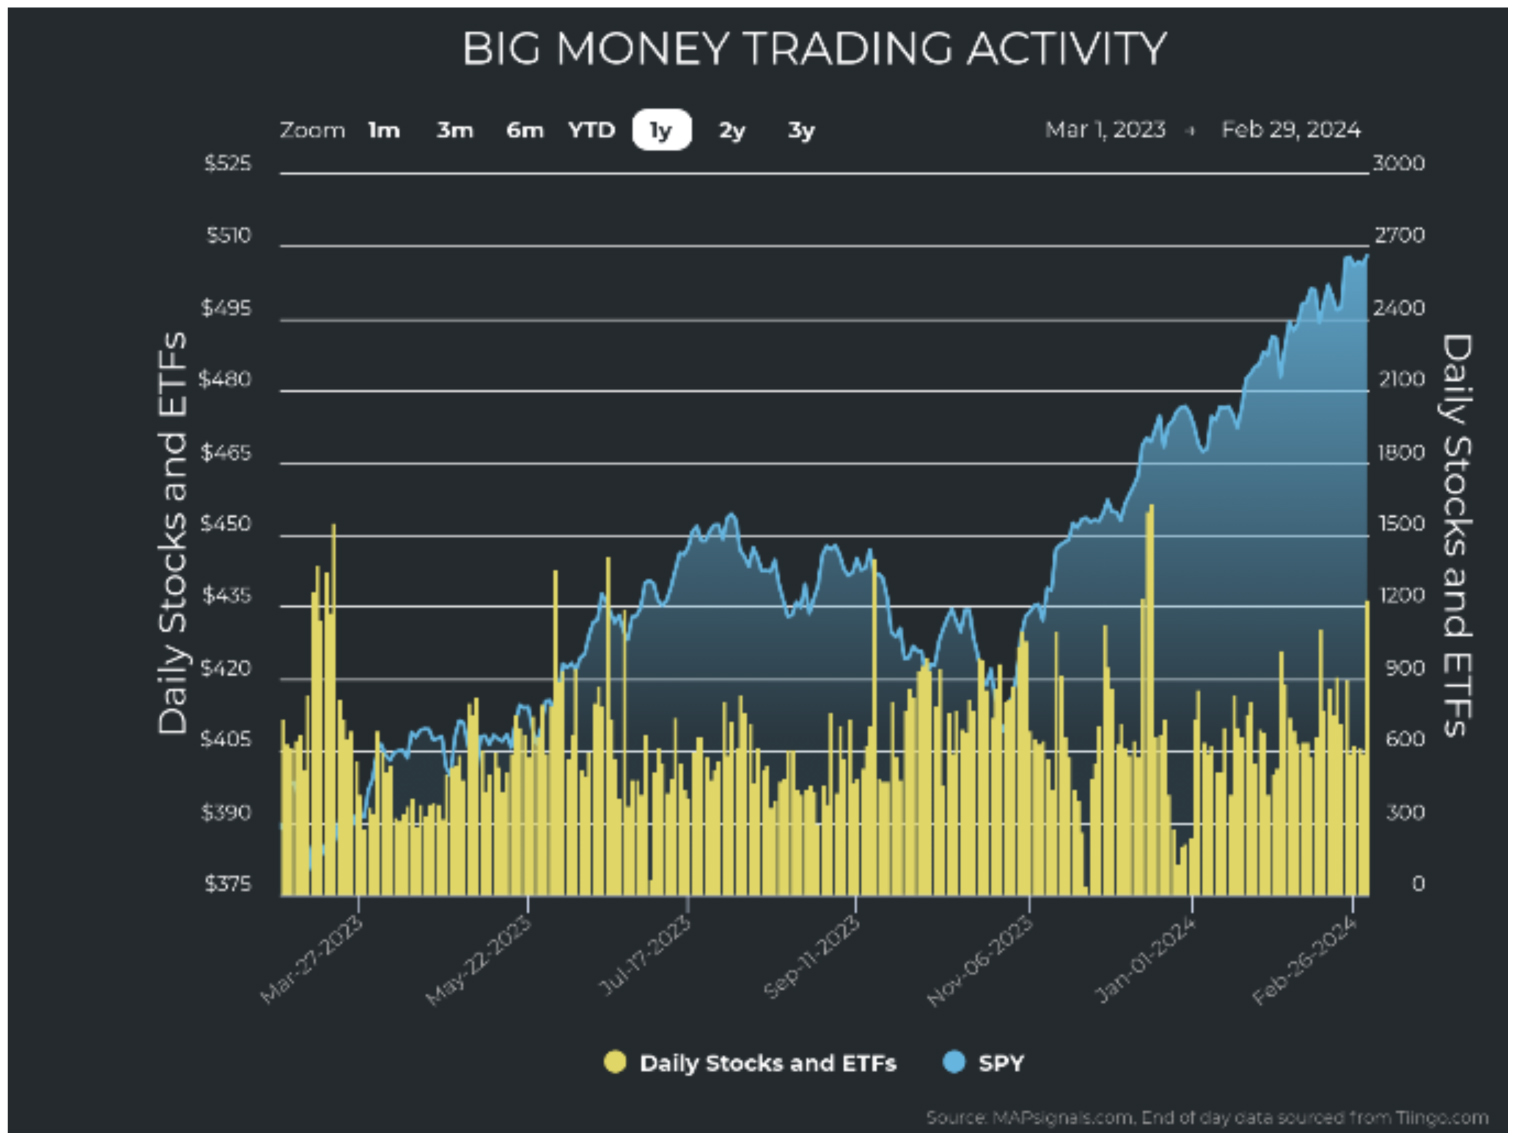
If the selling hasn’t picked up and stock prices keep rising, that indicates a pause in underlying market strength – not a weakening. We can also see that in unusual volumes. The amber bars (below) show when stocks are trading at unusual volumes. Notice the only dip in volume was at Christmas – to be expected:
Graphs are for illustrative and discussion purposes only. Please read important disclosures at the end of this commentary.
So, the market has kept on rising, on steady, unusual volume. The only thing that fell was the level of heavy buying. From my perspective, that’s hardly cause for concern. Now, if we should start to see heavy selling coupled with a falling BMI, that’s a flag worth paying attention to. But that’s not happening now.
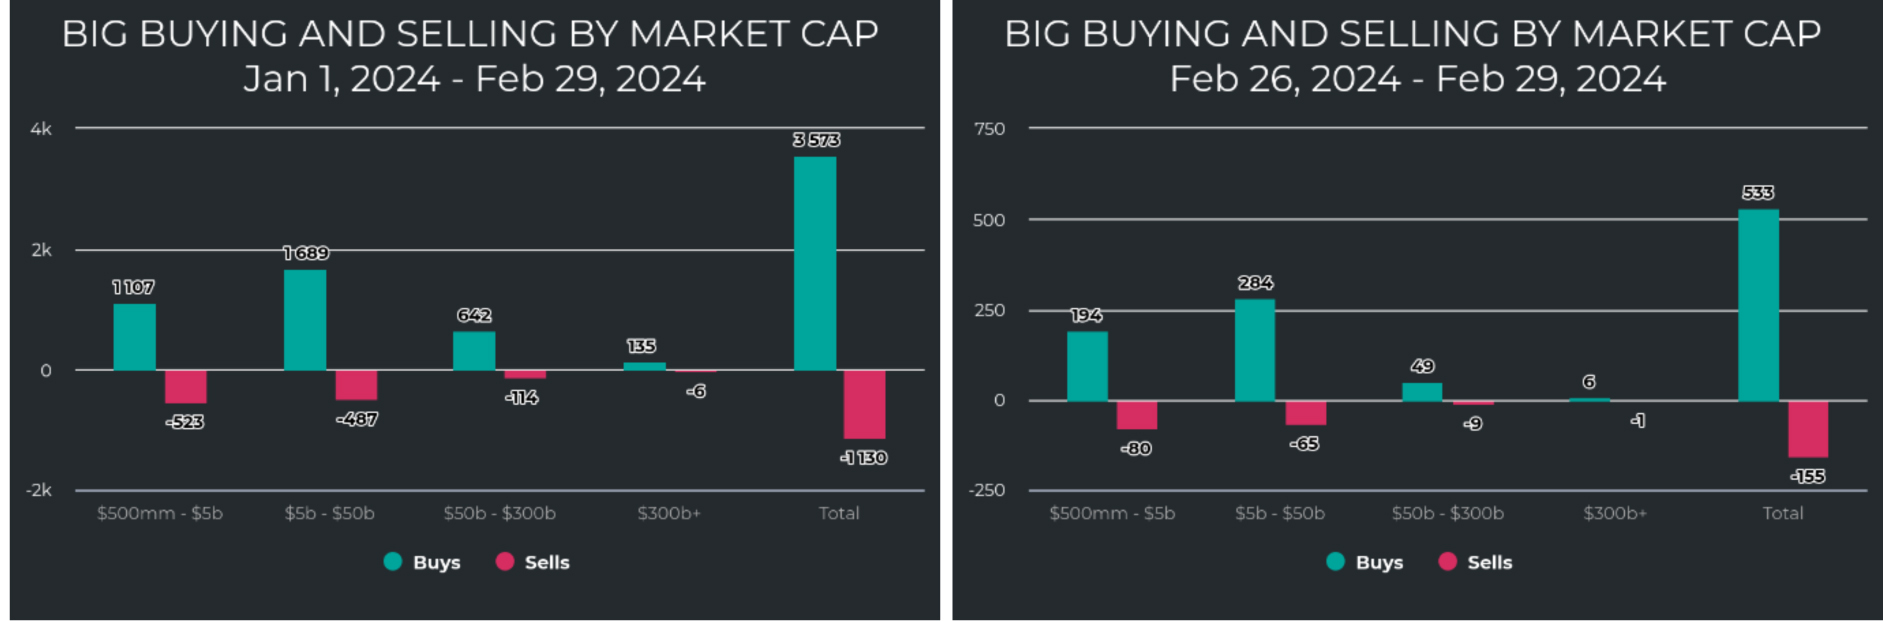
Next, as we analyze where the buy/sell pressure is focused, we notice an interesting reinforcing pattern. Small- and mid-cap stocks are collecting most of the unusually large inflows. Since January 1, buys have been focused mostly on stocks under $50 billion in size (left). That pattern continued last week (right).
Graphs are for illustrative and discussion purposes only. Please read important disclosures at the end of this commentary.
It also matters where the money is flowing into – into what sectors. When we look at sector strength and weakness, we see growth-heavy sectors at the top of the table. Technology, Industrials, Financials, and Discretionary lead. Defensive sectors lag – like Real Estate, Communications, and Utilities:
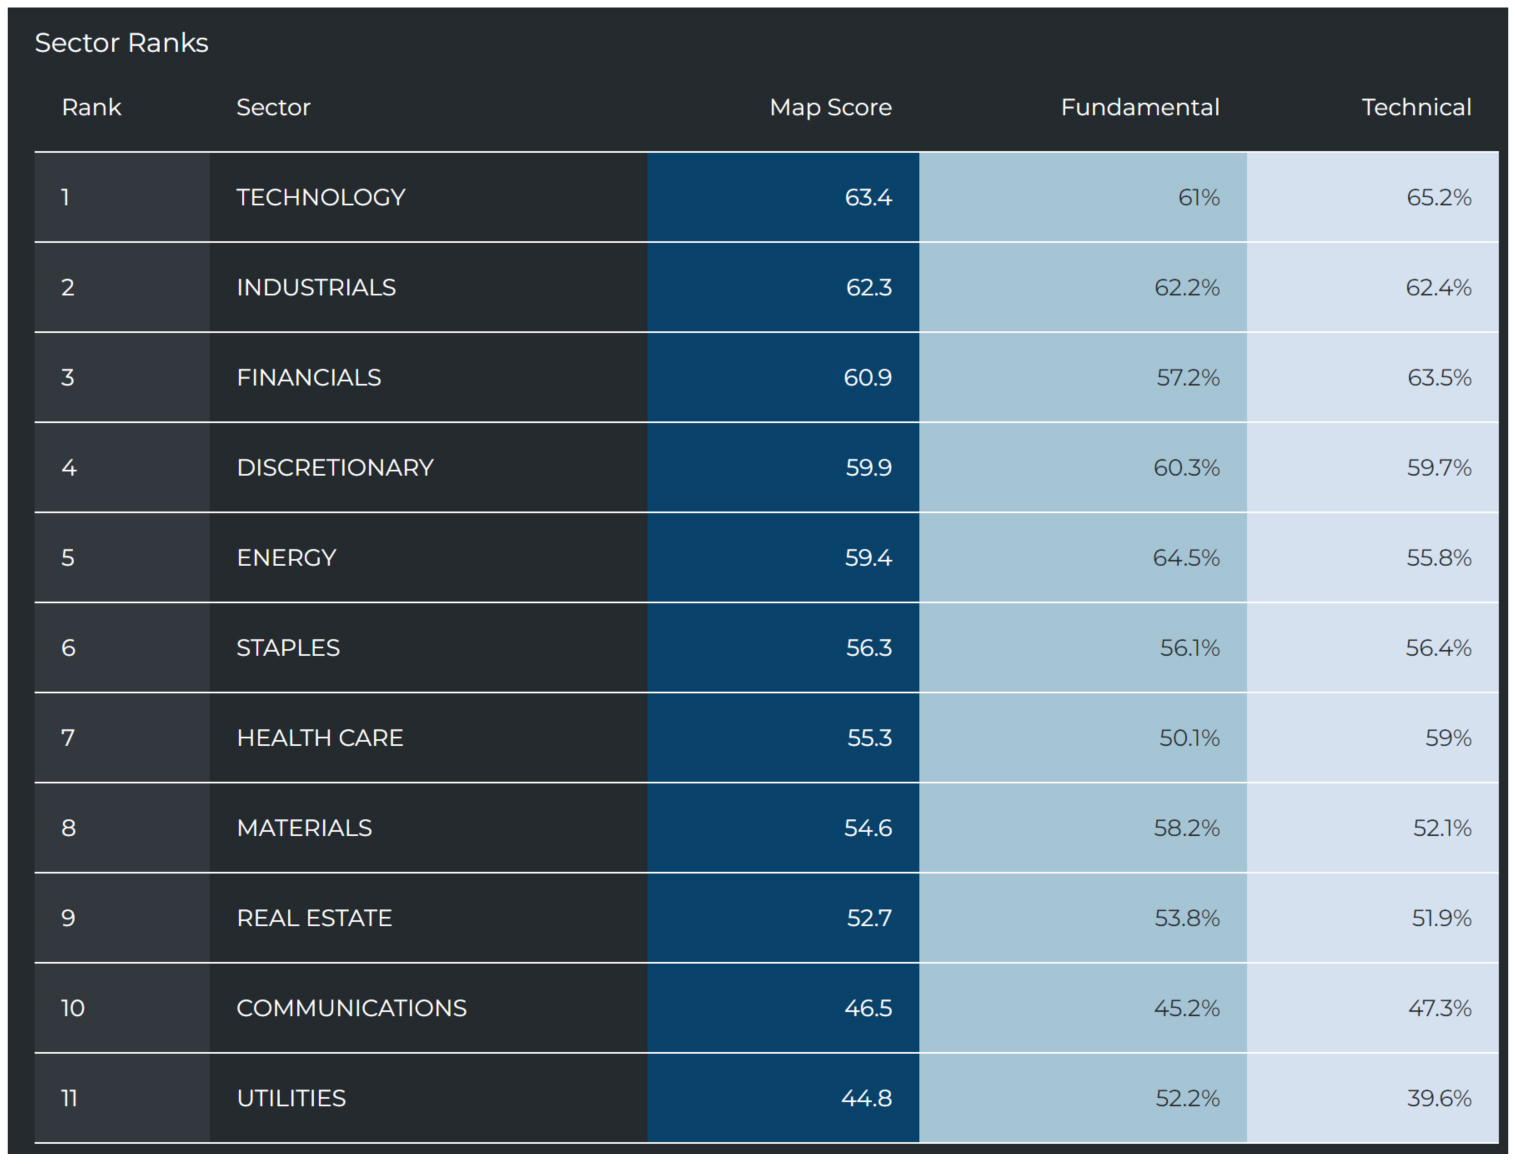
Graphs are for illustrative and discussion purposes only. Please read important disclosures at the end of this commentary.
This pattern is also borne out in the charts of unusual buying and selling of stocks by sector. I think the clearest takeaway from these charts is that 10 of 11 sectors have been on the rise. Eight of 11 have been powered by green (unusually large buying). Only Utilities are weakening. As growth becomes more in demand, yield hungry plays like Utilities, Communications, and Real Estate become less appealing.
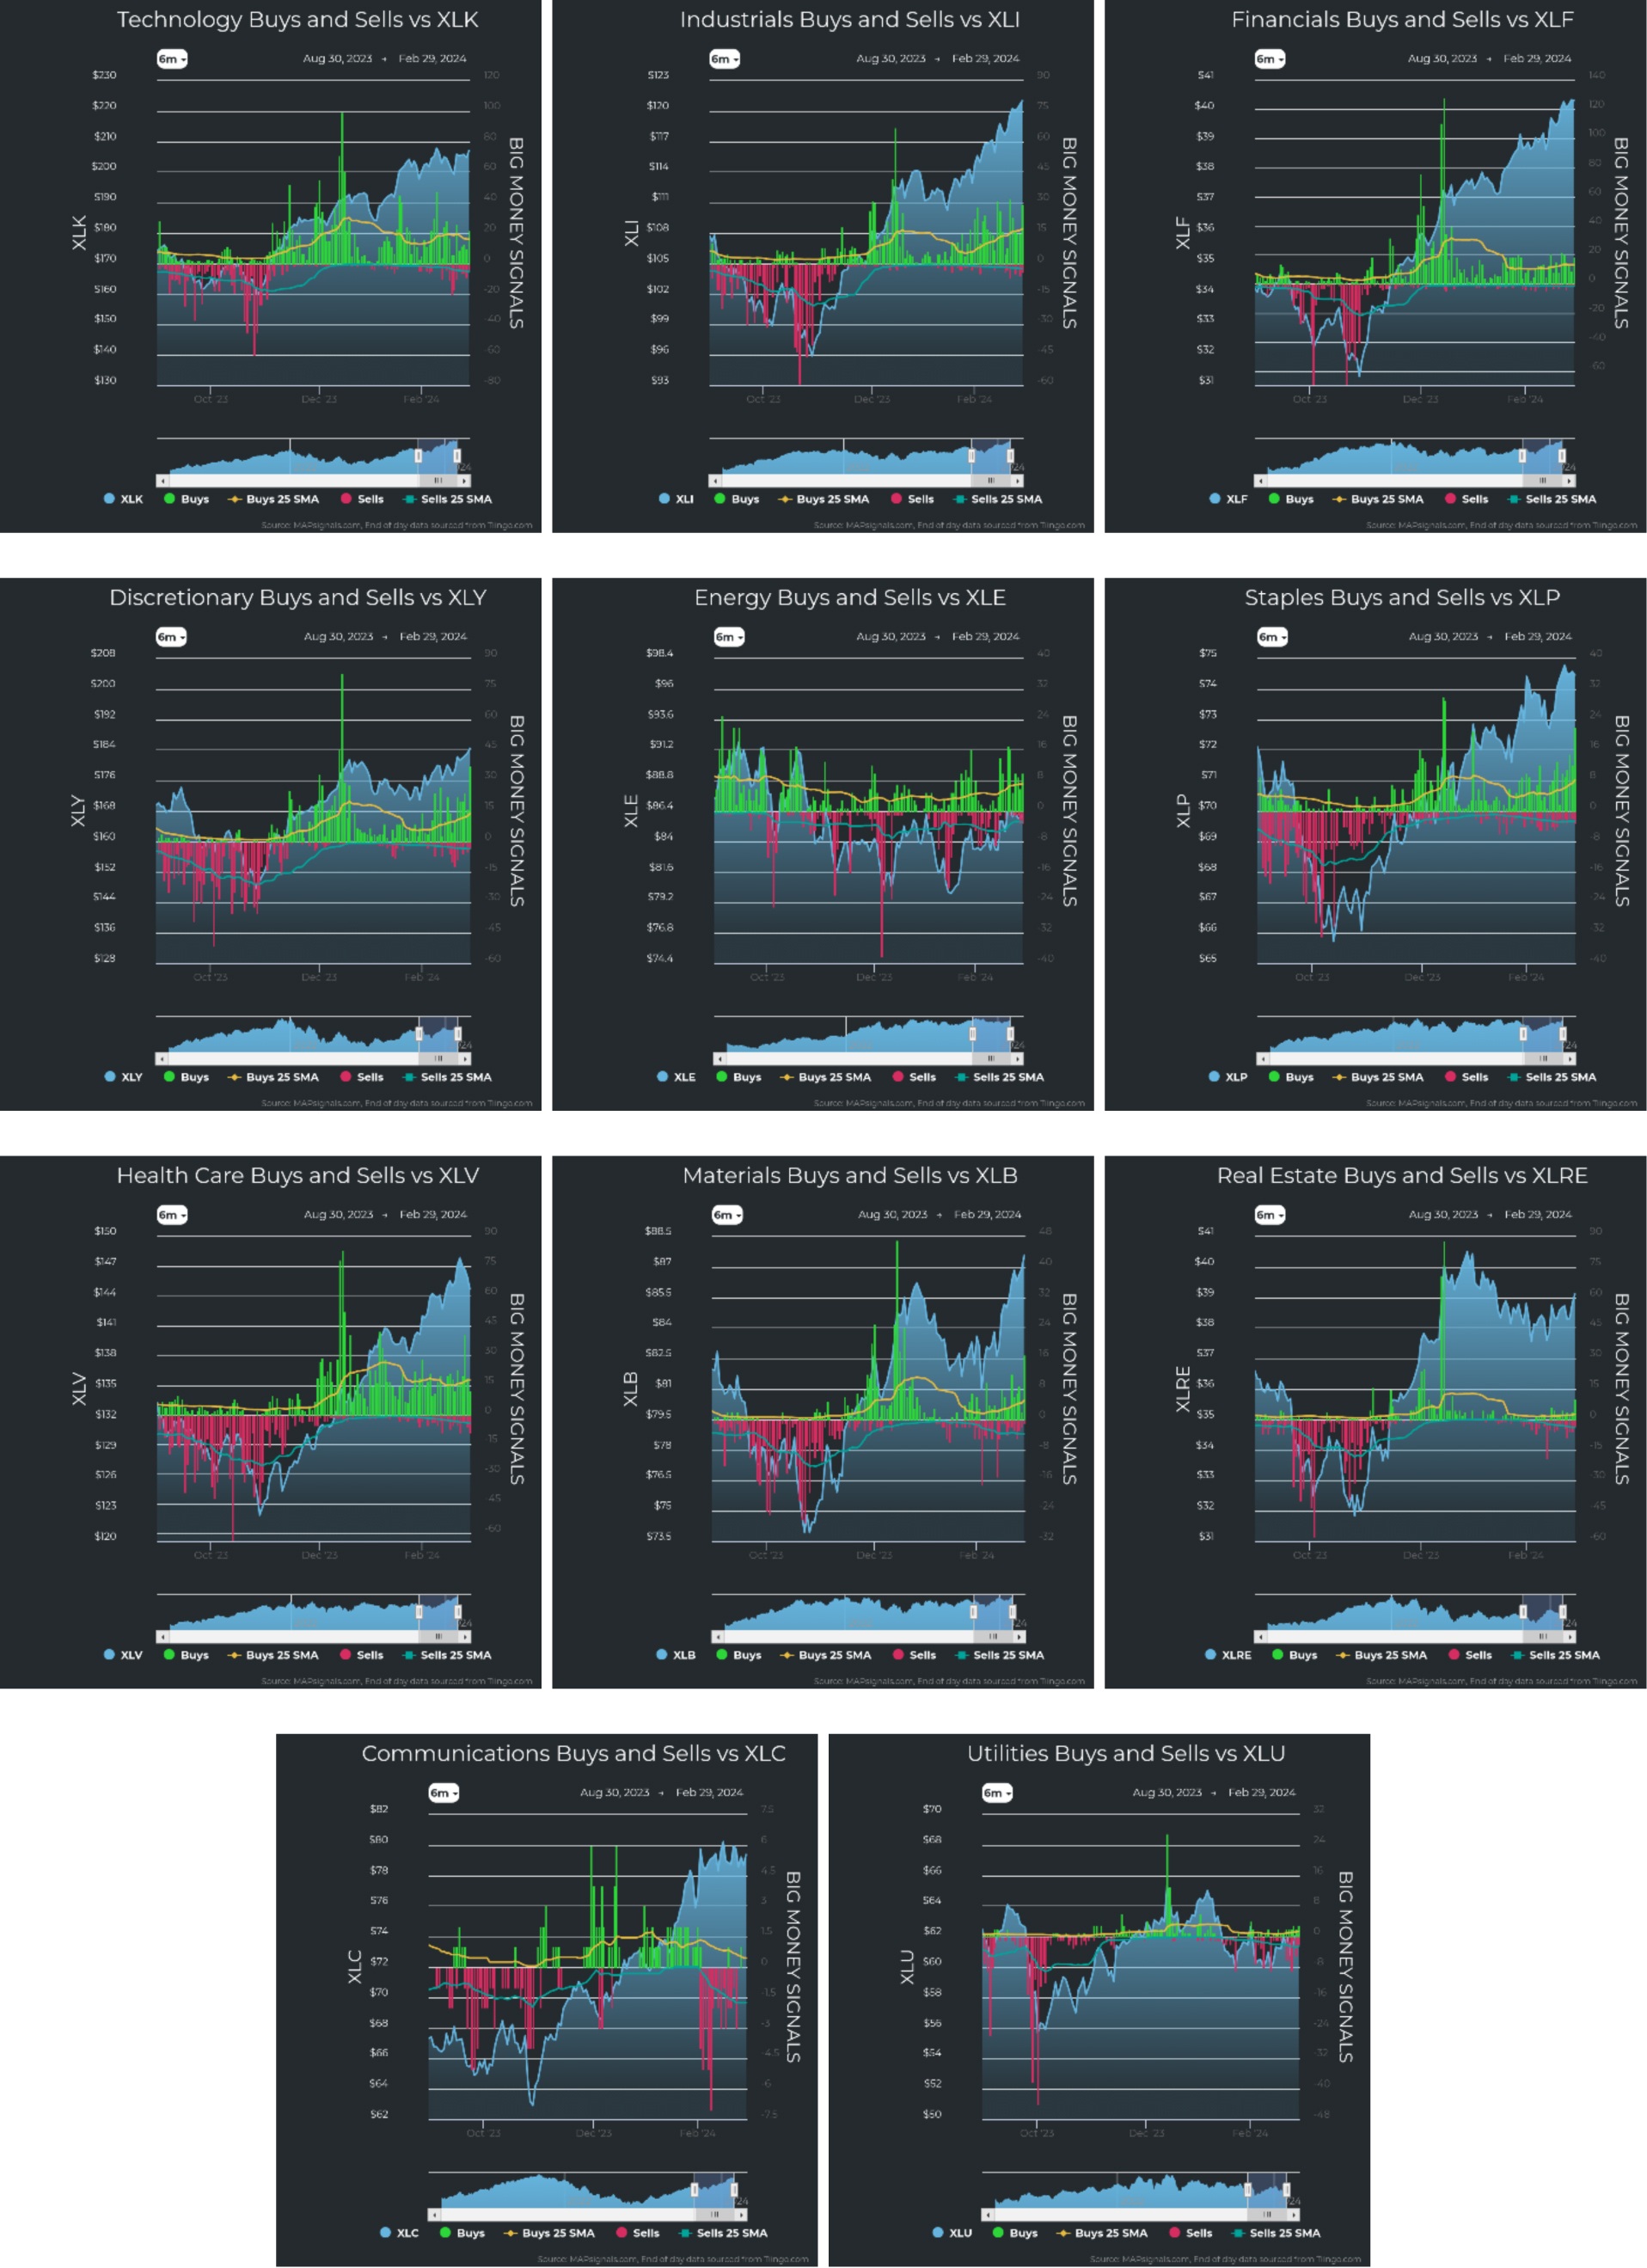
Graphs are for illustrative and discussion purposes only. Please read important disclosures at the end of this commentary.
It’s only human to be constantly waiting for the next shoe to drop. But that doesn’t help us emotionally or psychologically as investors. I for one, don’t want to go through life in a constant state of worry. It is best to understand the environment, infer likely outcomes, plan accordingly and react to reality as it comes.
Right now, the information tells us a few things clearly:
- The stock market is strong. There is more buying than selling.
- Earnings are working: According to FactSet Earnings Insight, with 97% of S&P 500 companies reporting, 75% of companies have beaten earnings, and 64% have beaten revenue expectations for the fourth quarter of 2023.
- Bellwether stocks are leading the market higher. Mega-stocks* like NVDA, Microsoft, AMZN, and META all powered indexes higher, providing solid indications of a continued economic recovery and a resilient consumer.
- The Fed’s stance on interest rates is clear. Rates will fall in 2024 – it’s only a question of when. And the closer we get to the election, the less comfortable the Fed will be in being perceived as interfering with it, so action should come soon.
- The military conflicts in Ukraine/Russia and Israel/Gaza are fizzling out of the media cycle. That to me is a dead giveaway of the lessening implications. If people aren’t clicking the stories and not reading them, the media agencies will likely stop running the story. They will chase other fears to fan the flames of worry. That’s how they get ads seen and make money.
There you have it. The market is strong, earnings are working, and other than taking some strategic profits to use for future purchases, it’s best to remain steady as she goes.
As John Lennon said, “Life is what happens when you’re busy making other plans.”
Navellier & Associates owns Nvidia Corp (NVDA), Amazon (AMZN), and Meta Platforms Inc Class A (META), in managed accounts. Jason Bodner owns Nvidia Corp (NVDA) personally. He does not personally own Amazon (AMZN), and Meta Platforms Inc Class A (META).
All content above represents the opinion of Jason Bodner of Navellier & Associates, Inc.
Also In This Issue
A Look Ahead by Louis Navellier
What Could Go Wrong After This Super Start to 2024?
Income Mail by Bryan Perry
The Coming Tidal Wave of AI-Driven Layoffs
Growth Mail by Gary Alexander
The U.S. Growth Machine Will Likely Rescue the World (Again)
Global Mail by Ivan Martchev
Small Caps are Due to Move Violently to the Upside
Sector Spotlight by Jason Bodner
When Reality and Perfect Planning Clash, Trust Reality
View Full Archive
Read Past Issues Here

Jason Bodner
MARKETMAIL EDITOR FOR SECTOR SPOTLIGHT
Jason Bodner writes Sector Spotlight in the weekly Marketmail publication and has authored several white papers for the company. He is also Co-Founder of Macro Analytics for Professionals which produces proprietary equity accumulation/distribution research for its clients. Previously, Mr. Bodner served as Director of European Equity Derivatives for Cantor Fitzgerald Europe in London, then moved to the role of Head of Equity Derivatives North America for the same company in New York. He also served as S.V.P. Equity Derivatives for Jefferies, LLC. He received a B.S. in business administration in 1996, with honors, from Skidmore College as a member of the Periclean Honors Society. All content of “Sector Spotlight” represents the opinion of Jason Bodner
Important Disclosures:
Jason Bodner is a co-founder and co-owner of Mapsignals. Mr. Bodner is an independent contractor who is occasionally hired by Navellier & Associates to write an article and or provide opinions for possible use in articles that appear in Navellier & Associates weekly Market Mail. Mr. Bodner is not employed or affiliated with Louis Navellier, Navellier & Associates, Inc., or any other Navellier owned entity. The opinions and statements made here are those of Mr. Bodner and not necessarily those of any other persons or entities. This is not an endorsement, or solicitation or testimonial or investment advice regarding the BMI Index or any statements or recommendations or analysis in the article or the BMI Index or Mapsignals or its products or strategies.
Although information in these reports has been obtained from and is based upon sources that Navellier believes to be reliable, Navellier does not guarantee its accuracy and it may be incomplete or condensed. All opinions and estimates constitute Navellier’s judgment as of the date the report was created and are subject to change without notice. These reports are for informational purposes only and are not a solicitation for the purchase or sale of a security. Any decision to purchase securities mentioned in these reports must take into account existing public information on such securities or any registered prospectus.To the extent permitted by law, neither Navellier & Associates, Inc., nor any of its affiliates, agents, or service providers assumes any liability or responsibility nor owes any duty of care for any consequences of any person acting or refraining to act in reliance on the information contained in this communication or for any decision based on it.
Past performance is no indication of future results. Investment in securities involves significant risk and has the potential for partial or complete loss of funds invested. It should not be assumed that any securities recommendations made by Navellier. in the future will be profitable or equal the performance of securities made in this report. Dividend payments are not guaranteed. The amount of a dividend payment, if any, can vary over time and issuers may reduce dividends paid on securities in the event of a recession or adverse event affecting a specific industry or issuer.
None of the stock information, data, and company information presented herein constitutes a recommendation by Navellier or a solicitation to buy or sell any securities. Any specific securities identified and described do not represent all of the securities purchased, sold, or recommended for advisory clients. The holdings identified do not represent all of the securities purchased, sold, or recommended for advisory clients and the reader should not assume that investments in the securities identified and discussed were or will be profitable.
Information presented is general information that does not take into account your individual circumstances, financial situation, or needs, nor does it present a personalized recommendation to you. Individual stocks presented may not be suitable for every investor. Investment in securities involves significant risk and has the potential for partial or complete loss of funds invested. Investment in fixed income securities has the potential for the investment return and principal value of an investment to fluctuate so that an investor’s holdings, when redeemed, may be worth less than their original cost.
One cannot invest directly in an index. Index is unmanaged and index performance does not reflect deduction of fees, expenses, or taxes. Presentation of Index data does not reflect a belief by Navellier that any stock index constitutes an investment alternative to any Navellier equity strategy or is necessarily comparable to such strategies. Among the most important differences between the Indices and Navellier strategies are that the Navellier equity strategies may (1) incur material management fees, (2) concentrate its investments in relatively few stocks, industries, or sectors, (3) have significantly greater trading activity and related costs, and (4) be significantly more or less volatile than the Indices.
ETF Risk: We may invest in exchange traded funds (“ETFs”) and some of our investment strategies are generally fully invested in ETFs. Like traditional mutual funds, ETFs charge asset-based fees, but they generally do not charge initial sales charges or redemption fees and investors typically pay only customary brokerage fees to buy and sell ETF shares. The fees and costs charged by ETFs held in client accounts will not be deducted from the compensation the client pays Navellier. ETF prices can fluctuate up or down, and a client account could lose money investing in an ETF if the prices of the securities owned by the ETF go down. ETFs are subject to additional risks:
- ETF shares may trade above or below their net asset value;
- An active trading market for an ETF’s shares may not develop or be maintained;
- The value of an ETF may be more volatile than the underlying portfolio of securities the ETF is designed to track;
- The cost of owning shares of the ETF may exceed those a client would incur by directly investing in the underlying securities; and
- Trading of an ETF’s shares may be halted if the listing exchange’s officials deem it appropriate, the shares are delisted from the exchange, or the activation of market-wide “circuit breakers” (which are tied to large decreases in stock prices) halts stock trading generally.
Grader Disclosures: Investment in equity strategies involves substantial risk and has the potential for partial or complete loss of funds invested. The sample portfolio and any accompanying charts are for informational purposes only and are not to be construed as a solicitation to buy or sell any financial instrument and should not be relied upon as the sole factor in an investment making decision. As a matter of normal and important disclosures to you, as a potential investor, please consider the following: The performance presented is not based on any actual securities trading, portfolio, or accounts, and the reported performance of the A, B, C, D, and F portfolios (collectively the “model portfolios”) should be considered mere “paper” or pro forma performance results based on Navellier’s research.
Investors evaluating any of Navellier & Associates, Inc.’s, (or its affiliates’) Investment Products must not use any information presented here, including the performance figures of the model portfolios, in their evaluation of any Navellier Investment Products. Navellier Investment Products include the firm’s mutual funds and managed accounts. The model portfolios, charts, and other information presented do not represent actual funded trades and are not actual funded portfolios. There are material differences between Navellier Investment Products’ portfolios and the model portfolios, research, and performance figures presented here. The model portfolios and the research results (1) may contain stocks or ETFs that are illiquid and difficult to trade; (2) may contain stock or ETF holdings materially different from actual funded Navellier Investment Product portfolios; (3) include the reinvestment of all dividends and other earnings, estimated trading costs, commissions, or management fees; and, (4) may not reflect prices obtained in an actual funded Navellier Investment Product portfolio. For these and other reasons, the reported performances of model portfolios do not reflect the performance results of Navellier’s actually funded and traded Investment Products. In most cases, Navellier’s Investment Products have materially lower performance results than the performances of the model portfolios presented.
This report contains statements that are, or may be considered to be, forward-looking statements. All statements that are not historical facts, including statements about our beliefs or expectations, are “forward-looking statements” within the meaning of The U.S. Private Securities Litigation Reform Act of 1995. These statements may be identified by such forward-looking terminology as “expect,” “estimate,” “plan,” “intend,” “believe,” “anticipate,” “may,” “will,” “should,” “could,” “continue,” “project,” or similar statements or variations of such terms. Our forward-looking statements are based on a series of expectations, assumptions, and projections, are not guarantees of future results or performance, and involve substantial risks and uncertainty as described in Form ADV Part 2A of our filing with the Securities and Exchange Commission (SEC), which is available at www.adviserinfo.sec.gov or by requesting a copy by emailing info@navellier.com. All of our forward-looking statements are as of the date of this report only. We can give no assurance that such expectations or forward-looking statements will prove to be correct. Actual results may differ materially. You are urged to carefully consider all such factors.
FEDERAL TAX ADVICE DISCLAIMER: As required by U.S. Treasury Regulations, you are informed that, to the extent this presentation includes any federal tax advice, the presentation is not written by Navellier to be used, and cannot be used, for the purpose of avoiding federal tax penalties. Navellier does not advise on any income tax requirements or issues. Use of any information presented by Navellier is for general information only and does not represent tax advice either express or implied. You are encouraged to seek professional tax advice for income tax questions and assistance.
IMPORTANT NEWSLETTER DISCLOSURE:The hypothetical performance results for investment newsletters that are authored or edited by Louis Navellier, including Louis Navellier’s Growth Investor, Louis Navellier’s Breakthrough Stocks, Louis Navellier’s Accelerated Profits, and Louis Navellier’s Platinum Club, are not based on any actual securities trading, portfolio, or accounts, and the newsletters’ reported hypothetical performances should be considered mere “paper” or proforma hypothetical performance results and are not actual performance of real world trades. Navellier & Associates, Inc. does not have any relation to or affiliation with the owner of these newsletters. There are material differences between Navellier Investment Products’ portfolios and the InvestorPlace Media, LLC newsletter portfolios authored by Louis Navellier. The InvestorPlace Media, LLC newsletters contain hypothetical performance that do not include transaction costs, advisory fees, or other fees a client might incur if actual investments and trades were being made by an investor. As a result, newsletter performance should not be used to evaluate Navellier Investment services which are separate and different from the newsletters. The owner of the newsletters is InvestorPlace Media, LLC and any questions concerning the newsletters, including any newsletter advertising or hypothetical Newsletter performance claims, (which are calculated solely by Investor Place Media and not Navellier) should be referred to InvestorPlace Media, LLC at (800) 718-8289.
Please note that Navellier & Associates and the Navellier Private Client Group are managed completely independent of the newsletters owned and published by InvestorPlace Media, LLC and written and edited by Louis Navellier, and investment performance of the newsletters should in no way be considered indicative of potential future investment performance for any Navellier & Associates separately managed account portfolio. Potential investors should consult with their financial advisor before investing in any Navellier Investment Product.
Navellier claims compliance with Global Investment Performance Standards (GIPS). To receive a complete list and descriptions of Navellier’s composites and/or a presentation that adheres to the GIPS standards, please contact Navellier or click here. It should not be assumed that any securities recommendations made by Navellier & Associates, Inc. in the future will be profitable or equal the performance of securities made in this report.
FactSet Disclosure: Navellier does not independently calculate the statistical information included in the attached report. The calculation and the information are provided by FactSet, a company not related to Navellier. Although information contained in the report has been obtained from FactSet and is based on sources Navellier believes to be reliable, Navellier does not guarantee its accuracy, and it may be incomplete or condensed. The report and the related FactSet sourced information are provided on an “as is” basis. The user assumes the entire risk of any use made of this information. Investors should consider the report as only a single factor in making their investment decision. The report is for informational purposes only and is not intended as an offer or solicitation for the purchase or sale of a security. FactSet sourced information is the exclusive property of FactSet. Without prior written permission of FactSet, this information may not be reproduced, disseminated or used to create any financial products. All indices are unmanaged and performance of the indices include reinvestment of dividends and interest income, unless otherwise noted, are not illustrative of any particular investment and an investment cannot be made in any index. Past performance is no guarantee of future results.