by Jason Bodner
March 19, 2024
We can want to believe something so much we make it true in our heads… especially when there’s money on the line. I offer you the shocking case of Emmanuel Nwude. In the 1990s, as a former Director of Union Bank of Nigeria, he worked extremely hard to sell a Nigerian airport to Brazil’s Banco Noroeste, based in Sao Paolo. Nelson Sakaguchi, a Director there, orchestrated the purchase for $242 million.
Here’s the rub: The airport didn’t exist! But Nwude sold the idea as he impersonated Paul Ogwuma, then Governor of the Central Bank of Nigeria. Sakaguchi was convinced to invest in the fictitious airport due to the lure of a commission of $10 million. It sounded too good to be true… because it was.
Eventually everyone was apprehended but not before Banco Noroeste collapsed in 2001.

Emmanuel Nwude and his phantom airport (YouTube)
Money can sway our emotions and lead us to do stupid things sometimes. Investors love stories of easy riches and secret methods to elevate them above everyone else. Usually, those stories are just stories, and easy riches? Last time I checked, it’s not so easy to earn a quick buck in any market. This is why I prefer an unemotional approach to risking my hard-earned money. Gut reactions are rarely great in everyday life. Why then, would they suit investing? In other words: Use emotions to love your family and data to invest. My philosophy is that the story should come second to the business health of the company.
The same goes for the market. There are never-ending stories to stoke worry and fear, which could cost the emotionally susceptible investor untold piles of money. For proof, look at a 100-year chart of stocks.
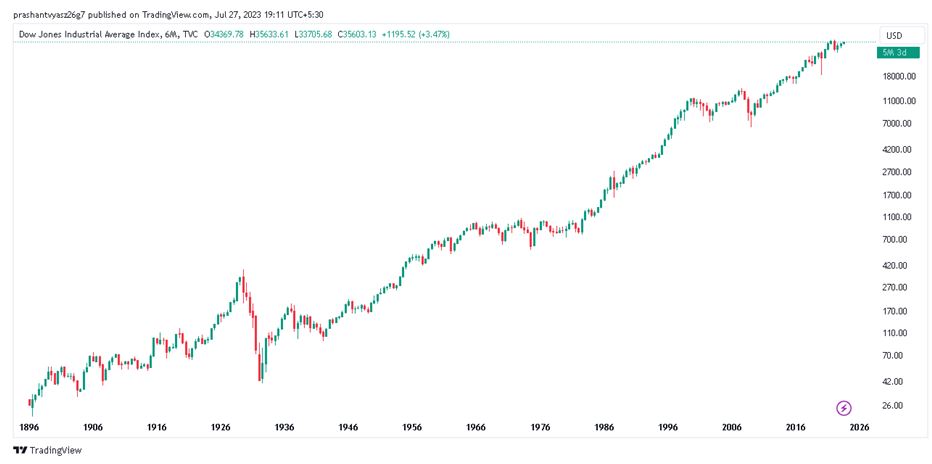
Graphs are for illustrative and discussion purposes only. Please read important disclosures at the end of this commentary.
There are two clear takeaways from the chart:
- Volatility exists. Deep draw-downs happen. The path to glory is not linear. However-
- Stocks have clearly risen since 1900. The Dow Jones has grown over 127,000% since then.
That fact will entice success-hungry investors, but one little-known truth is even more mind-blowing: Only a handful of stocks account for all of that stock market success. The awesome work of Professor Hendrick Bessembinder shows that only 4% of stocks account for all of the net gains of stocks above bonds in the past 100 years, and only 1% of stocks account for 50% of the net gain of stocks over bonds.
Think about that for a moment… it’s a conundrum! Here we have a seemingly sure thing: Invest in stocks, since they go up over time. But digging deeper, we find out that you’re basically treading water with 96% of stocks. In short, while the odds seem incredibly good making money in stocks, to beat the bond market, you must own the top 4%. According to this metric, you have better odds at a slot machine.
How then, do we find those 4%?
THAT is the question I have been asking myself for over 20 years. I devoted an immense amount of time, resources, energy, and money to solve this riddle, so I learned a few things. I boiled it down to three basic requirements. To potentially be a top 4% stock, the company must have all of the following three things:
- Superior Fundamentals. It must grow sales and earnings, meaning it must have positive earnings, make a profit, and manage its debt well, among several other key factors.
- Strong Technicals. The stock should be trending higher, because it is being accumulated (on rising volume) and be leading other stocks in its relevant sector.
- Unusual Buying. Institutions don’t play by the same rules as everyday investors. They deploy massive amounts of money and can disrupt a marketplace for a stock. I seek to buy a stock when they buy massive amounts of that stock.
When these three things align, odds of picking a 4% winner go way higher, historically speaking.
If we extend this thinking to today’s markets, I noticed something interesting that might signal a shift.
Looking at money flows, the Big Money Index (BMI) shows a strong market, despite falling from being overbought. The BMI is not plummeting – rather it is leveling off. The market is strong, but we need to keep our eyes on the fact that earnings season is over, because that’s when volatility typically perks up.
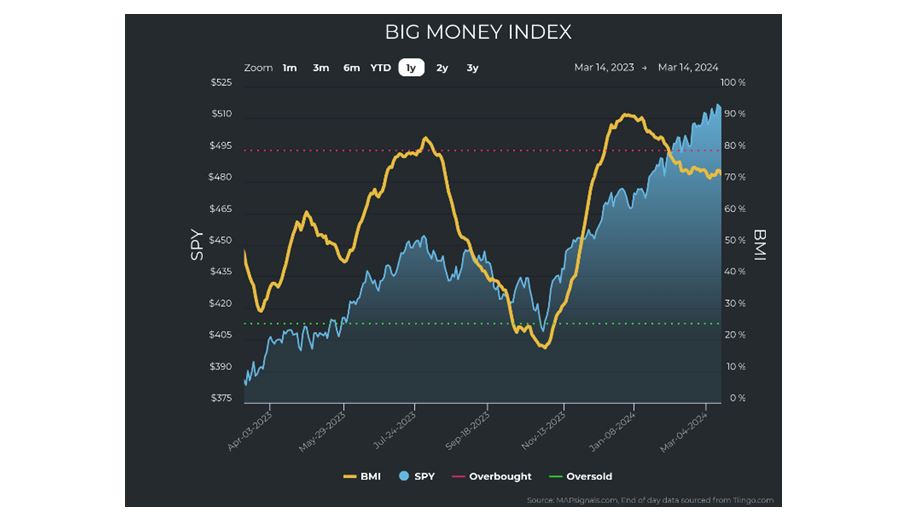
Graphs are for illustrative and discussion purposes only. Please read important disclosures at the end of this commentary.
It is important to note that the BMI has not been falling due to increased selling, at least not yet. In fact, there has only been one day of notable (but not serious) selling – note the arrow, below:
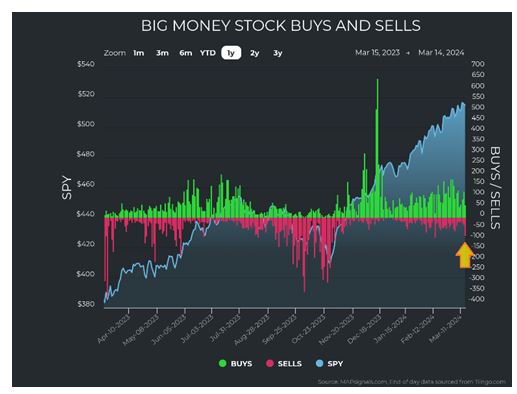
Graphs are for illustrative and discussion purposes only. Please read important disclosures at the end of this commentary.
That’s one part of the shift. The next part is that Technology has been the strongest sector since late 2023.
Late last week, however, Technology was eclipsed by the Energy sector:
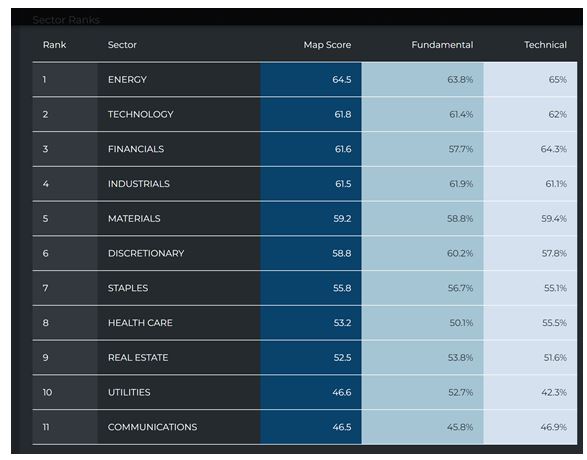
Graphs are for illustrative and discussion purposes only. Please read important disclosures at the end of this commentary.
Again, this is not due to increased Tech selling. The amount of buying has just calmed down. But in the meantime, Energy stocks saw a notable pickup in buying. Wednesday in particular saw a visible spike in buying of Energy Stocks:
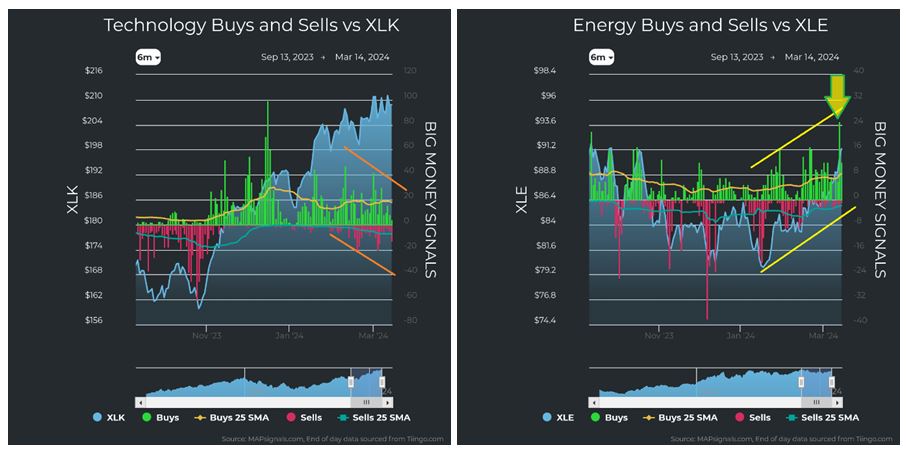
Graphs are for illustrative and discussion purposes only. Please read important disclosures at the end of this commentary.
I investigated the stocks seeing unusual buying to see if it was a reversion, which is typically marked by poor quality stocks being scooped up. In this case, however, the stocks had an average fundamental score of 74%, which is very solid. In general, they were America’s fossil fuel exploration and production companies. This tells us that, for now, stocks remain strong, but volatility may come due to earnings season concluding. I anticipate the next six weeks to be choppy for stocks, then the rise continues.
Seneca could have told us the same thing, long ago: “We suffer more in our imagination than in reality.”
All content above represents the opinion of Jason Bodner of Navellier & Associates, Inc.
Also In This Issue
A Look Ahead by Louis Navellier
The Common-Sense Electrical Energy Solution (Everyone Ignores)
Income Mail by Bryan Perry
Here Comes Another Major Catalyst for the AI-Led Rally
Growth Mail by Gary Alexander
March Madness: Dow 5k Fears (2009) & Bloated Budgets Begin (1964)
Global Mail by Ivan Martchev
The Rotation into the Broad Market Accelerates
Sector Spotlight by Jason Bodner
The Easy Road (After Hard Study) to Riches
View Full Archive
Read Past Issues Here

Jason Bodner
MARKETMAIL EDITOR FOR SECTOR SPOTLIGHT
Jason Bodner writes Sector Spotlight in the weekly Marketmail publication and has authored several white papers for the company. He is also Co-Founder of Macro Analytics for Professionals which produces proprietary equity accumulation/distribution research for its clients. Previously, Mr. Bodner served as Director of European Equity Derivatives for Cantor Fitzgerald Europe in London, then moved to the role of Head of Equity Derivatives North America for the same company in New York. He also served as S.V.P. Equity Derivatives for Jefferies, LLC. He received a B.S. in business administration in 1996, with honors, from Skidmore College as a member of the Periclean Honors Society. All content of “Sector Spotlight” represents the opinion of Jason Bodner
Important Disclosures:
Jason Bodner is a co-founder and co-owner of Mapsignals. Mr. Bodner is an independent contractor who is occasionally hired by Navellier & Associates to write an article and or provide opinions for possible use in articles that appear in Navellier & Associates weekly Market Mail. Mr. Bodner is not employed or affiliated with Louis Navellier, Navellier & Associates, Inc., or any other Navellier owned entity. The opinions and statements made here are those of Mr. Bodner and not necessarily those of any other persons or entities. This is not an endorsement, or solicitation or testimonial or investment advice regarding the BMI Index or any statements or recommendations or analysis in the article or the BMI Index or Mapsignals or its products or strategies.
Although information in these reports has been obtained from and is based upon sources that Navellier believes to be reliable, Navellier does not guarantee its accuracy and it may be incomplete or condensed. All opinions and estimates constitute Navellier’s judgment as of the date the report was created and are subject to change without notice. These reports are for informational purposes only and are not a solicitation for the purchase or sale of a security. Any decision to purchase securities mentioned in these reports must take into account existing public information on such securities or any registered prospectus.To the extent permitted by law, neither Navellier & Associates, Inc., nor any of its affiliates, agents, or service providers assumes any liability or responsibility nor owes any duty of care for any consequences of any person acting or refraining to act in reliance on the information contained in this communication or for any decision based on it.
Past performance is no indication of future results. Investment in securities involves significant risk and has the potential for partial or complete loss of funds invested. It should not be assumed that any securities recommendations made by Navellier. in the future will be profitable or equal the performance of securities made in this report. Dividend payments are not guaranteed. The amount of a dividend payment, if any, can vary over time and issuers may reduce dividends paid on securities in the event of a recession or adverse event affecting a specific industry or issuer.
None of the stock information, data, and company information presented herein constitutes a recommendation by Navellier or a solicitation to buy or sell any securities. Any specific securities identified and described do not represent all of the securities purchased, sold, or recommended for advisory clients. The holdings identified do not represent all of the securities purchased, sold, or recommended for advisory clients and the reader should not assume that investments in the securities identified and discussed were or will be profitable.
Information presented is general information that does not take into account your individual circumstances, financial situation, or needs, nor does it present a personalized recommendation to you. Individual stocks presented may not be suitable for every investor. Investment in securities involves significant risk and has the potential for partial or complete loss of funds invested. Investment in fixed income securities has the potential for the investment return and principal value of an investment to fluctuate so that an investor’s holdings, when redeemed, may be worth less than their original cost.
One cannot invest directly in an index. Index is unmanaged and index performance does not reflect deduction of fees, expenses, or taxes. Presentation of Index data does not reflect a belief by Navellier that any stock index constitutes an investment alternative to any Navellier equity strategy or is necessarily comparable to such strategies. Among the most important differences between the Indices and Navellier strategies are that the Navellier equity strategies may (1) incur material management fees, (2) concentrate its investments in relatively few stocks, industries, or sectors, (3) have significantly greater trading activity and related costs, and (4) be significantly more or less volatile than the Indices.
ETF Risk: We may invest in exchange traded funds (“ETFs”) and some of our investment strategies are generally fully invested in ETFs. Like traditional mutual funds, ETFs charge asset-based fees, but they generally do not charge initial sales charges or redemption fees and investors typically pay only customary brokerage fees to buy and sell ETF shares. The fees and costs charged by ETFs held in client accounts will not be deducted from the compensation the client pays Navellier. ETF prices can fluctuate up or down, and a client account could lose money investing in an ETF if the prices of the securities owned by the ETF go down. ETFs are subject to additional risks:
- ETF shares may trade above or below their net asset value;
- An active trading market for an ETF’s shares may not develop or be maintained;
- The value of an ETF may be more volatile than the underlying portfolio of securities the ETF is designed to track;
- The cost of owning shares of the ETF may exceed those a client would incur by directly investing in the underlying securities; and
- Trading of an ETF’s shares may be halted if the listing exchange’s officials deem it appropriate, the shares are delisted from the exchange, or the activation of market-wide “circuit breakers” (which are tied to large decreases in stock prices) halts stock trading generally.
Grader Disclosures: Investment in equity strategies involves substantial risk and has the potential for partial or complete loss of funds invested. The sample portfolio and any accompanying charts are for informational purposes only and are not to be construed as a solicitation to buy or sell any financial instrument and should not be relied upon as the sole factor in an investment making decision. As a matter of normal and important disclosures to you, as a potential investor, please consider the following: The performance presented is not based on any actual securities trading, portfolio, or accounts, and the reported performance of the A, B, C, D, and F portfolios (collectively the “model portfolios”) should be considered mere “paper” or pro forma performance results based on Navellier’s research.
Investors evaluating any of Navellier & Associates, Inc.’s, (or its affiliates’) Investment Products must not use any information presented here, including the performance figures of the model portfolios, in their evaluation of any Navellier Investment Products. Navellier Investment Products include the firm’s mutual funds and managed accounts. The model portfolios, charts, and other information presented do not represent actual funded trades and are not actual funded portfolios. There are material differences between Navellier Investment Products’ portfolios and the model portfolios, research, and performance figures presented here. The model portfolios and the research results (1) may contain stocks or ETFs that are illiquid and difficult to trade; (2) may contain stock or ETF holdings materially different from actual funded Navellier Investment Product portfolios; (3) include the reinvestment of all dividends and other earnings, estimated trading costs, commissions, or management fees; and, (4) may not reflect prices obtained in an actual funded Navellier Investment Product portfolio. For these and other reasons, the reported performances of model portfolios do not reflect the performance results of Navellier’s actually funded and traded Investment Products. In most cases, Navellier’s Investment Products have materially lower performance results than the performances of the model portfolios presented.
This report contains statements that are, or may be considered to be, forward-looking statements. All statements that are not historical facts, including statements about our beliefs or expectations, are “forward-looking statements” within the meaning of The U.S. Private Securities Litigation Reform Act of 1995. These statements may be identified by such forward-looking terminology as “expect,” “estimate,” “plan,” “intend,” “believe,” “anticipate,” “may,” “will,” “should,” “could,” “continue,” “project,” or similar statements or variations of such terms. Our forward-looking statements are based on a series of expectations, assumptions, and projections, are not guarantees of future results or performance, and involve substantial risks and uncertainty as described in Form ADV Part 2A of our filing with the Securities and Exchange Commission (SEC), which is available at www.adviserinfo.sec.gov or by requesting a copy by emailing info@navellier.com. All of our forward-looking statements are as of the date of this report only. We can give no assurance that such expectations or forward-looking statements will prove to be correct. Actual results may differ materially. You are urged to carefully consider all such factors.
FEDERAL TAX ADVICE DISCLAIMER: As required by U.S. Treasury Regulations, you are informed that, to the extent this presentation includes any federal tax advice, the presentation is not written by Navellier to be used, and cannot be used, for the purpose of avoiding federal tax penalties. Navellier does not advise on any income tax requirements or issues. Use of any information presented by Navellier is for general information only and does not represent tax advice either express or implied. You are encouraged to seek professional tax advice for income tax questions and assistance.
IMPORTANT NEWSLETTER DISCLOSURE:The hypothetical performance results for investment newsletters that are authored or edited by Louis Navellier, including Louis Navellier’s Growth Investor, Louis Navellier’s Breakthrough Stocks, Louis Navellier’s Accelerated Profits, and Louis Navellier’s Platinum Club, are not based on any actual securities trading, portfolio, or accounts, and the newsletters’ reported hypothetical performances should be considered mere “paper” or proforma hypothetical performance results and are not actual performance of real world trades. Navellier & Associates, Inc. does not have any relation to or affiliation with the owner of these newsletters. There are material differences between Navellier Investment Products’ portfolios and the InvestorPlace Media, LLC newsletter portfolios authored by Louis Navellier. The InvestorPlace Media, LLC newsletters contain hypothetical performance that do not include transaction costs, advisory fees, or other fees a client might incur if actual investments and trades were being made by an investor. As a result, newsletter performance should not be used to evaluate Navellier Investment services which are separate and different from the newsletters. The owner of the newsletters is InvestorPlace Media, LLC and any questions concerning the newsletters, including any newsletter advertising or hypothetical Newsletter performance claims, (which are calculated solely by Investor Place Media and not Navellier) should be referred to InvestorPlace Media, LLC at (800) 718-8289.
Please note that Navellier & Associates and the Navellier Private Client Group are managed completely independent of the newsletters owned and published by InvestorPlace Media, LLC and written and edited by Louis Navellier, and investment performance of the newsletters should in no way be considered indicative of potential future investment performance for any Navellier & Associates separately managed account portfolio. Potential investors should consult with their financial advisor before investing in any Navellier Investment Product.
Navellier claims compliance with Global Investment Performance Standards (GIPS). To receive a complete list and descriptions of Navellier’s composites and/or a presentation that adheres to the GIPS standards, please contact Navellier or click here. It should not be assumed that any securities recommendations made by Navellier & Associates, Inc. in the future will be profitable or equal the performance of securities made in this report.
FactSet Disclosure: Navellier does not independently calculate the statistical information included in the attached report. The calculation and the information are provided by FactSet, a company not related to Navellier. Although information contained in the report has been obtained from FactSet and is based on sources Navellier believes to be reliable, Navellier does not guarantee its accuracy, and it may be incomplete or condensed. The report and the related FactSet sourced information are provided on an “as is” basis. The user assumes the entire risk of any use made of this information. Investors should consider the report as only a single factor in making their investment decision. The report is for informational purposes only and is not intended as an offer or solicitation for the purchase or sale of a security. FactSet sourced information is the exclusive property of FactSet. Without prior written permission of FactSet, this information may not be reproduced, disseminated or used to create any financial products. All indices are unmanaged and performance of the indices include reinvestment of dividends and interest income, unless otherwise noted, are not illustrative of any particular investment and an investment cannot be made in any index. Past performance is no guarantee of future results.