by Bryan Perry
February 6, 2024
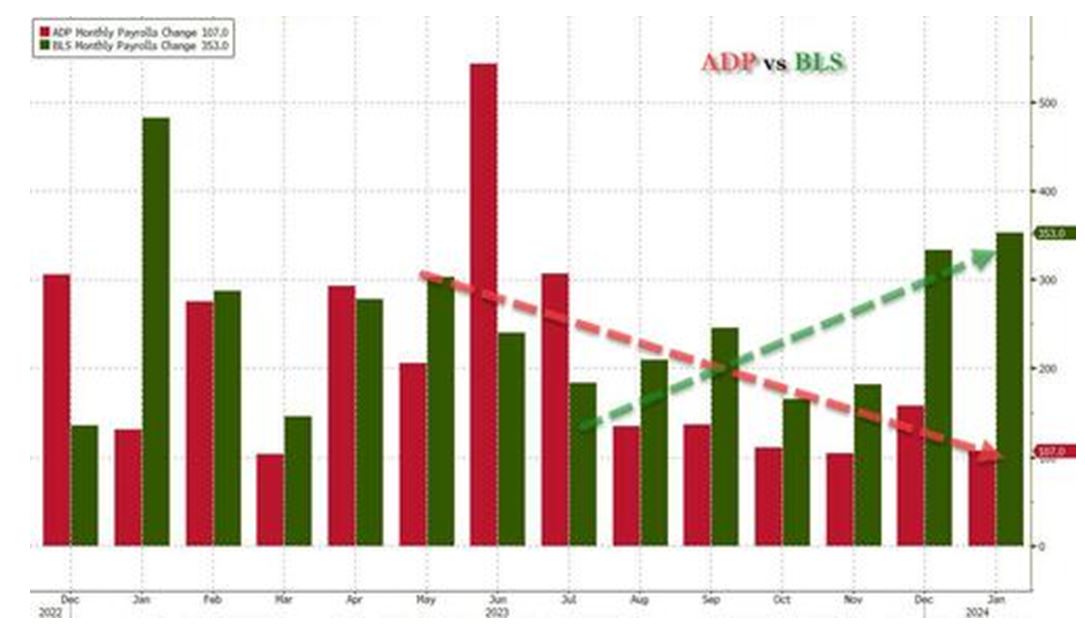
The S&P and NASDAQ soared, and bond prices crashed after last Friday’s release of the January jobs report that blew apart even the most bullish of estimates. The Labor Department reported a whopping 353,000 new jobs with the 3-month average for total non-farm payrolls at 289,000, revised from 227,000, as the December job total gained 117,000 to 333,000 and November non-farm payrolls gained 9,000 to 182,000.
January’s average hourly earnings were up 0.6% (the Briefing.com consensus expected only 0.3%) versus 0.4% in December. Over the last 12 months, average hourly earnings have now risen 4.5%, versus 4.3% for the 12 months ending in December. The lower trend in job growth bottomed out in October 2023 and had been re-accelerating for the past three months, as implied by the upward revisions. (As a footnote, please note that there were some changes in adjustments that the Bureau of Labor Statistics has made to its data, which has critics of the BLS charging extreme data manipulation to generate this strong report).
As evidence that there may some data manipulation going on, the ADP National Employment Report, a measure of the monthly change in non-farm, private employment based on the payroll data of about 400,000 U.S. business clients coming two days ahead of government data, shows private payroll growth slowed to just 107,000 in January, well below expectations of 150,000 and off from the downwardly revised 158,000 in December. ADP reported last Wednesday: “Private payroll growth declined sharply in January, a possible sign that the U.S. labor market is heading for a slowdown this year.” ADP also said hiring was slow across virtually all sectors. Vocal critics argue the use of benchmark revisions, seasonal adjustments and population controls are all keywords for what we can only describe as statistical magic.
The latest Zero Hedge economic commentary also pointed to a “divergence between the Establishment (payrolls) and much more accurate Household (actual employment) survey. To wit, while in January the BLS claims 353K payrolls were added, the Household survey found that the number of actually employed workers dropped again, this time by 31K (from 161.183K to 161.152K).” The plot thickens, as the number of people employed has dropped in three of the past four months, including a drop of 683,000 in December. The Challenger Job Cuts Report showed layoffs of 82,307 for January, a 136% increase from December, a significant jump indicating layoffs are picking up. So, how can Friday’s job totals leap through the roof, counter to that of the ADP report, Household Survey and Challenger Job Cuts reports?
I don’t have an empirical answer, but these jobs data should harmonize, to a large extent, and they do not.
www.zerohedge.com/economics/inside-most-ridiculous-jobs-report-recent-history
Graphs are for illustrative and discussion purposes only. Please read important disclosures at the end of this commentary.
The market’s reaction was many-fold, as bond and commodity prices traded down sharply, Treasury yields and the dollar traded solidly higher, with big-cap tech stocks leading the S&P to new all-time highs, while the Russell 2000 traded lower on a dim outlook for any kind of rate cuts soon. Companies beating Q4 estimates are getting richly rewarded, while those that miss are being sold off aggressively.
The odds of a March rate cut are now super-low, with talk of a rate cut in May now highly questionable. And despite all the euphoria surrounding a couple of big beats by the Magnificent Seven, there are dark clouds forming over some of the regional banks and foreign banks with too much of the wrong kind of commercial real estate exposure. For instance, Bloomberg reported last Thursday night that Tokyo-based Aozora shares plunged by as much as 18.5% to their lowest levels since February 2021 in Tokyo trading.
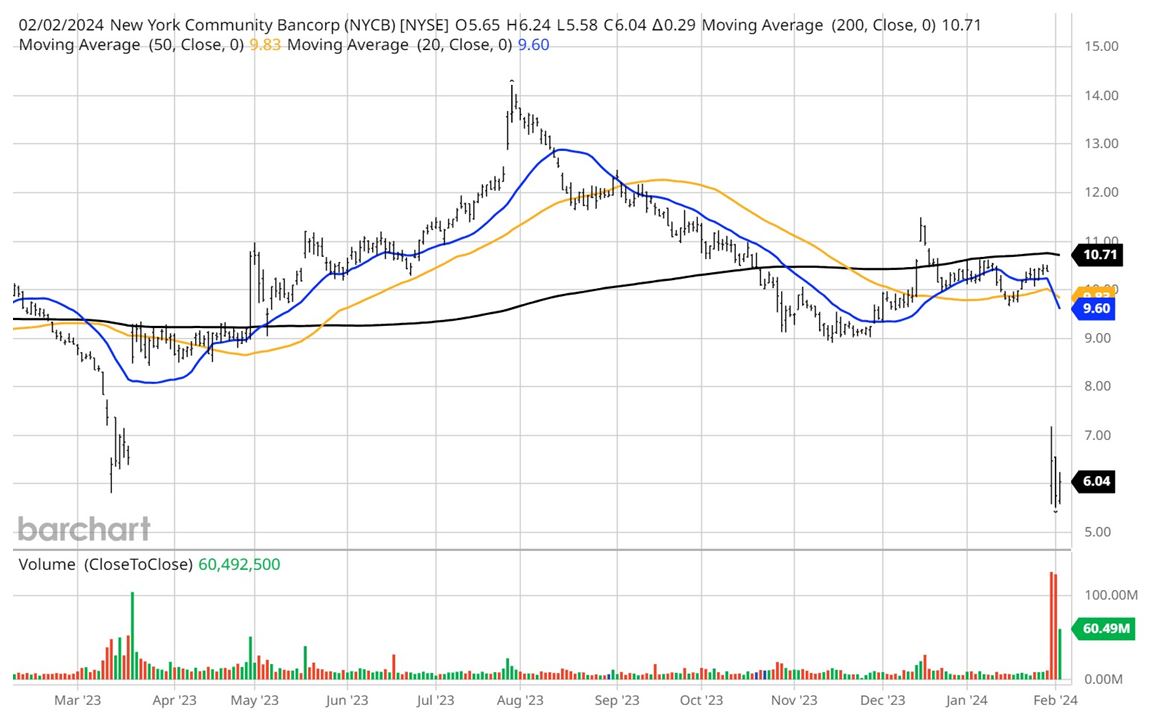
This Tokyo-based commercial lender said it now expects to post a net loss of 28 billion Japanese yen ($191 million) for the fiscal year ending March 31 after warning of U.S. commercial real estate losses. This report came on the heels of an earnings shocker out of New York Community Bancorp (NYCB) that posted an astonishing $522 million loan loss provision related to the acquisition of Signature Bank and Flagstar Bank. NYCB also slashed its quarterly dividend by 70% to a nickel. NYCB shares fell 40% in three days.
Justin Onuekwusi, chief investment officer at wealth manager St. James’s Place, said, “Banks are facing roughly $560 billion in commercial real estate maturities by the end of 2025, representing more than half of the total property debt coming due over that period. And commercial real estate loans account for 28.7% of assets at small banks.”
Graphs are for illustrative and discussion purposes only. Please read important disclosures at the end of this commentary.
Being that we are in a Presidential election cycle, markets tend to be optimistic, putting off unwelcome news into the following post-election year. There is also growing geopolitical risk and some fear of inflation re-igniting if supply chains face wider disruptions, and a federal debt bubble, but the U.S. economy is reporting economic data that generally supports a market that can add to its gains. And with the dollar turning higher, that only attracts further foreign capital flows seeking dollar-based assets.
With that said, at some point the market will care about these risks – just as it did last August through October, when the market swooned – and at that time, there will be a change in the narrative from buying the dips to that of selling into rallies. At present, however, there is a strong bias to keep buying any pullbacks in stocks of companies posting great sales and earnings growth coupled with bullish guidance.
Navellier & Associates does not own Aozora (AOZOY), or New York Community Bancorp (NYCB) in managed accounts. Bryan Perry does not personally own Aozora (AOZOY), or New York Community Bancorp (NYCB).
All content above represents the opinion of Bryan Perry of Navellier & Associates, Inc.
Also In This Issue
A Look Ahead by Louis Navellier
The Latest Economic Data May Postpone Rate Cut Expectations
Income Mail by Bryan Perry
Hot Jobs Report Runs Counter to Soft ADP Data
Growth Mail by Gary Alexander
“President’s Month” Invites Presidential Comparisons
Global Mail by Ivan Martchev
Bonds Are Once Again More Volatile Than Stocks
Sector Spotlight by Jason Bodner
When You Can’t Find Good Answers…Create Your Own
View Full Archive
Read Past Issues Here

Bryan Perry
SENIOR DIRECTOR
Bryan Perry is a Senior Director with Navellier Private Client Group, advising and facilitating high net worth investors in the pursuit of their financial goals.
Bryan’s financial services career spanning the past three decades includes over 20 years of wealth management experience with Wall Street firms that include Bear Stearns, Lehman Brothers and Paine Webber, working with both retail and institutional clients. Bryan earned a B.A. in Political Science from Virginia Polytechnic Institute & State University and currently holds a Series 65 license. All content of “Income Mail” represents the opinion of Bryan Perry
Important Disclosures:
Although information in these reports has been obtained from and is based upon sources that Navellier believes to be reliable, Navellier does not guarantee its accuracy and it may be incomplete or condensed. All opinions and estimates constitute Navellier’s judgment as of the date the report was created and are subject to change without notice. These reports are for informational purposes only and are not a solicitation for the purchase or sale of a security. Any decision to purchase securities mentioned in these reports must take into account existing public information on such securities or any registered prospectus.To the extent permitted by law, neither Navellier & Associates, Inc., nor any of its affiliates, agents, or service providers assumes any liability or responsibility nor owes any duty of care for any consequences of any person acting or refraining to act in reliance on the information contained in this communication or for any decision based on it.
Past performance is no indication of future results. Investment in securities involves significant risk and has the potential for partial or complete loss of funds invested. It should not be assumed that any securities recommendations made by Navellier. in the future will be profitable or equal the performance of securities made in this report. Dividend payments are not guaranteed. The amount of a dividend payment, if any, can vary over time and issuers may reduce dividends paid on securities in the event of a recession or adverse event affecting a specific industry or issuer.
None of the stock information, data, and company information presented herein constitutes a recommendation by Navellier or a solicitation to buy or sell any securities. Any specific securities identified and described do not represent all of the securities purchased, sold, or recommended for advisory clients. The holdings identified do not represent all of the securities purchased, sold, or recommended for advisory clients and the reader should not assume that investments in the securities identified and discussed were or will be profitable.
Information presented is general information that does not take into account your individual circumstances, financial situation, or needs, nor does it present a personalized recommendation to you. Individual stocks presented may not be suitable for every investor. Investment in securities involves significant risk and has the potential for partial or complete loss of funds invested. Investment in fixed income securities has the potential for the investment return and principal value of an investment to fluctuate so that an investor’s holdings, when redeemed, may be worth less than their original cost.
One cannot invest directly in an index. Index is unmanaged and index performance does not reflect deduction of fees, expenses, or taxes. Presentation of Index data does not reflect a belief by Navellier that any stock index constitutes an investment alternative to any Navellier equity strategy or is necessarily comparable to such strategies. Among the most important differences between the Indices and Navellier strategies are that the Navellier equity strategies may (1) incur material management fees, (2) concentrate its investments in relatively few stocks, industries, or sectors, (3) have significantly greater trading activity and related costs, and (4) be significantly more or less volatile than the Indices.
ETF Risk: We may invest in exchange traded funds (“ETFs”) and some of our investment strategies are generally fully invested in ETFs. Like traditional mutual funds, ETFs charge asset-based fees, but they generally do not charge initial sales charges or redemption fees and investors typically pay only customary brokerage fees to buy and sell ETF shares. The fees and costs charged by ETFs held in client accounts will not be deducted from the compensation the client pays Navellier. ETF prices can fluctuate up or down, and a client account could lose money investing in an ETF if the prices of the securities owned by the ETF go down. ETFs are subject to additional risks:
- ETF shares may trade above or below their net asset value;
- An active trading market for an ETF’s shares may not develop or be maintained;
- The value of an ETF may be more volatile than the underlying portfolio of securities the ETF is designed to track;
- The cost of owning shares of the ETF may exceed those a client would incur by directly investing in the underlying securities; and
- Trading of an ETF’s shares may be halted if the listing exchange’s officials deem it appropriate, the shares are delisted from the exchange, or the activation of market-wide “circuit breakers” (which are tied to large decreases in stock prices) halts stock trading generally.
Grader Disclosures: Investment in equity strategies involves substantial risk and has the potential for partial or complete loss of funds invested. The sample portfolio and any accompanying charts are for informational purposes only and are not to be construed as a solicitation to buy or sell any financial instrument and should not be relied upon as the sole factor in an investment making decision. As a matter of normal and important disclosures to you, as a potential investor, please consider the following: The performance presented is not based on any actual securities trading, portfolio, or accounts, and the reported performance of the A, B, C, D, and F portfolios (collectively the “model portfolios”) should be considered mere “paper” or pro forma performance results based on Navellier’s research.
Investors evaluating any of Navellier & Associates, Inc.’s, (or its affiliates’) Investment Products must not use any information presented here, including the performance figures of the model portfolios, in their evaluation of any Navellier Investment Products. Navellier Investment Products include the firm’s mutual funds and managed accounts. The model portfolios, charts, and other information presented do not represent actual funded trades and are not actual funded portfolios. There are material differences between Navellier Investment Products’ portfolios and the model portfolios, research, and performance figures presented here. The model portfolios and the research results (1) may contain stocks or ETFs that are illiquid and difficult to trade; (2) may contain stock or ETF holdings materially different from actual funded Navellier Investment Product portfolios; (3) include the reinvestment of all dividends and other earnings, estimated trading costs, commissions, or management fees; and, (4) may not reflect prices obtained in an actual funded Navellier Investment Product portfolio. For these and other reasons, the reported performances of model portfolios do not reflect the performance results of Navellier’s actually funded and traded Investment Products. In most cases, Navellier’s Investment Products have materially lower performance results than the performances of the model portfolios presented.
This report contains statements that are, or may be considered to be, forward-looking statements. All statements that are not historical facts, including statements about our beliefs or expectations, are “forward-looking statements” within the meaning of The U.S. Private Securities Litigation Reform Act of 1995. These statements may be identified by such forward-looking terminology as “expect,” “estimate,” “plan,” “intend,” “believe,” “anticipate,” “may,” “will,” “should,” “could,” “continue,” “project,” or similar statements or variations of such terms. Our forward-looking statements are based on a series of expectations, assumptions, and projections, are not guarantees of future results or performance, and involve substantial risks and uncertainty as described in Form ADV Part 2A of our filing with the Securities and Exchange Commission (SEC), which is available at www.adviserinfo.sec.gov or by requesting a copy by emailing info@navellier.com. All of our forward-looking statements are as of the date of this report only. We can give no assurance that such expectations or forward-looking statements will prove to be correct. Actual results may differ materially. You are urged to carefully consider all such factors.
FEDERAL TAX ADVICE DISCLAIMER: As required by U.S. Treasury Regulations, you are informed that, to the extent this presentation includes any federal tax advice, the presentation is not written by Navellier to be used, and cannot be used, for the purpose of avoiding federal tax penalties. Navellier does not advise on any income tax requirements or issues. Use of any information presented by Navellier is for general information only and does not represent tax advice either express or implied. You are encouraged to seek professional tax advice for income tax questions and assistance.
IMPORTANT NEWSLETTER DISCLOSURE:The hypothetical performance results for investment newsletters that are authored or edited by Louis Navellier, including Louis Navellier’s Growth Investor, Louis Navellier’s Breakthrough Stocks, Louis Navellier’s Accelerated Profits, and Louis Navellier’s Platinum Club, are not based on any actual securities trading, portfolio, or accounts, and the newsletters’ reported hypothetical performances should be considered mere “paper” or proforma hypothetical performance results and are not actual performance of real world trades. Navellier & Associates, Inc. does not have any relation to or affiliation with the owner of these newsletters. There are material differences between Navellier Investment Products’ portfolios and the InvestorPlace Media, LLC newsletter portfolios authored by Louis Navellier. The InvestorPlace Media, LLC newsletters contain hypothetical performance that do not include transaction costs, advisory fees, or other fees a client might incur if actual investments and trades were being made by an investor. As a result, newsletter performance should not be used to evaluate Navellier Investment services which are separate and different from the newsletters. The owner of the newsletters is InvestorPlace Media, LLC and any questions concerning the newsletters, including any newsletter advertising or hypothetical Newsletter performance claims, (which are calculated solely by Investor Place Media and not Navellier) should be referred to InvestorPlace Media, LLC at (800) 718-8289.
Please note that Navellier & Associates and the Navellier Private Client Group are managed completely independent of the newsletters owned and published by InvestorPlace Media, LLC and written and edited by Louis Navellier, and investment performance of the newsletters should in no way be considered indicative of potential future investment performance for any Navellier & Associates separately managed account portfolio. Potential investors should consult with their financial advisor before investing in any Navellier Investment Product.
Navellier claims compliance with Global Investment Performance Standards (GIPS). To receive a complete list and descriptions of Navellier’s composites and/or a presentation that adheres to the GIPS standards, please contact Navellier or click here. It should not be assumed that any securities recommendations made by Navellier & Associates, Inc. in the future will be profitable or equal the performance of securities made in this report.
FactSet Disclosure: Navellier does not independently calculate the statistical information included in the attached report. The calculation and the information are provided by FactSet, a company not related to Navellier. Although information contained in the report has been obtained from FactSet and is based on sources Navellier believes to be reliable, Navellier does not guarantee its accuracy, and it may be incomplete or condensed. The report and the related FactSet sourced information are provided on an “as is” basis. The user assumes the entire risk of any use made of this information. Investors should consider the report as only a single factor in making their investment decision. The report is for informational purposes only and is not intended as an offer or solicitation for the purchase or sale of a security. FactSet sourced information is the exclusive property of FactSet. Without prior written permission of FactSet, this information may not be reproduced, disseminated or used to create any financial products. All indices are unmanaged and performance of the indices include reinvestment of dividends and interest income, unless otherwise noted, are not illustrative of any particular investment and an investment cannot be made in any index. Past performance is no guarantee of future results.