by Jason Bodner
December 27, 2023
Winston Churchill was one of the finest statesmen the world has ever known. He was renowned for his speeches, so it’s a bit remarkable he had a speech impediment: he had difficulty pronouncing “s” sounds. Not that he let that slow him down. He had many interesting quotes. He once said that if you put two economists in a room, you get two opinions, but if one of them is Lord Keynes, you get three opinions.
Opinions form the basis of endless debate over what’s going to happen next. When it comes to investing, we can have 1,000 opinions about the coming year! For the past three years, there was an endless debate over a certain recession that never materialized. Debates over a market crash raged on. And now, some are debating whether the market will keep going higher or collapse under today’s “overbought” conditions.
Even immutable laws can generate conflicting opinions. The law of gravity says that, “what goes up must come down” (fitting for the current stock market). But objects that are lighter than air don’t come down, and Newton’s law of motion says, “a body in motion tends to stay in motion.” So … is gravity universal?
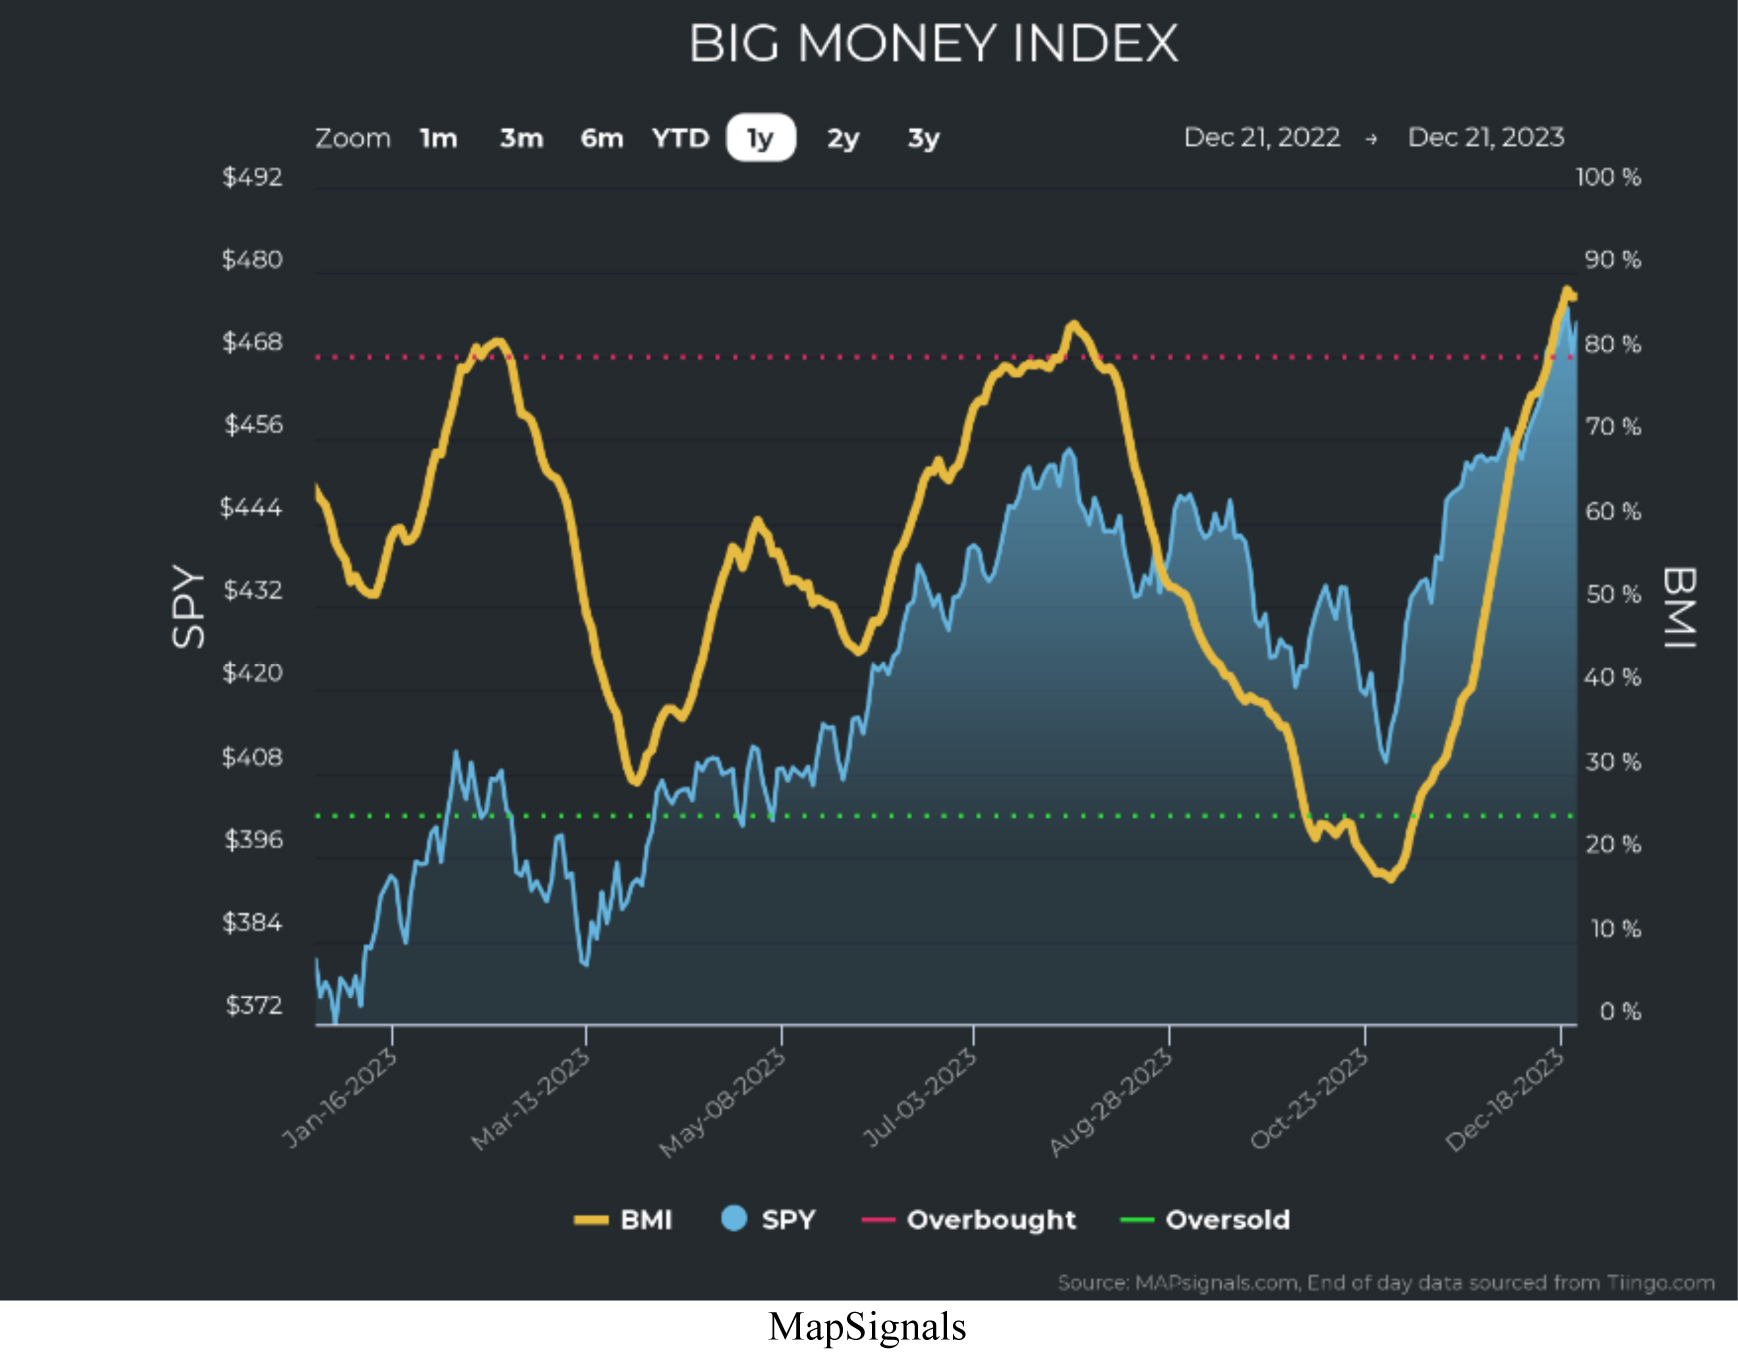
I have an answer for you: In order to know where we are going – we need to know where we are, and where we were. Let’s begin with the Big Money Index (BMI). The BMI’s threshold for an overbought market is when 80% of all unusual trading signals over the past 25 trading days are Buys, and the BMI is now grossly overbought, at 87.2%. This means that over 87% of all unusual trading was big buying:
Graphs are for illustrative and discussion purposes only. Please read important disclosures at the end of this commentary.
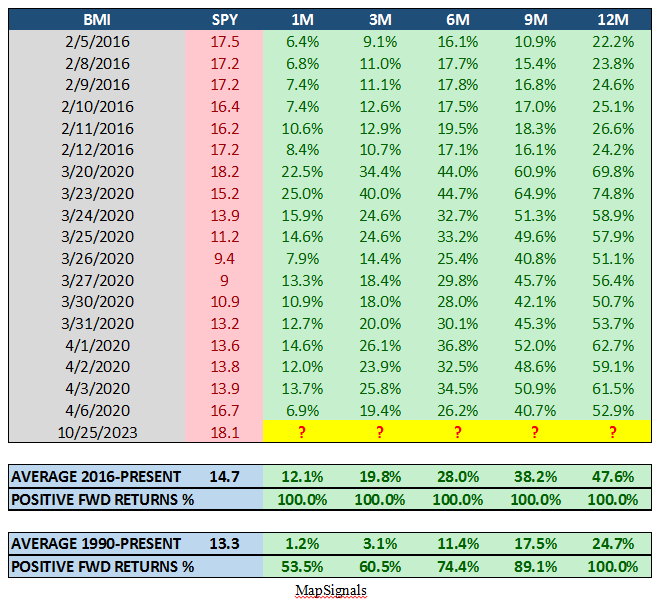
Note how quickly the BMI went from oversold to overbought. It took only 28 trading days (about six weeks) to flip from grossly oversold to overbought. The SPY (S&P 500 Tracking ETF) rose 16% from its oversold trough on October 27th, to its recent overbought peak on December 19. Along the way, debate raged over what stocks might do next. At MAPsignals, however, there was no debate. We shouted from the rooftops that an oversold BMI signals a massive rally. We even showed the statistics of forward returns during a grossly oversold BMI. Let me refresh your memory- I created this table on October 26th:
Graphs are for illustrative and discussion purposes only. Please read important disclosures at the end of this commentary.
We all know how that turned out (I just told you): It was great for the longs and terrible for the shorts.
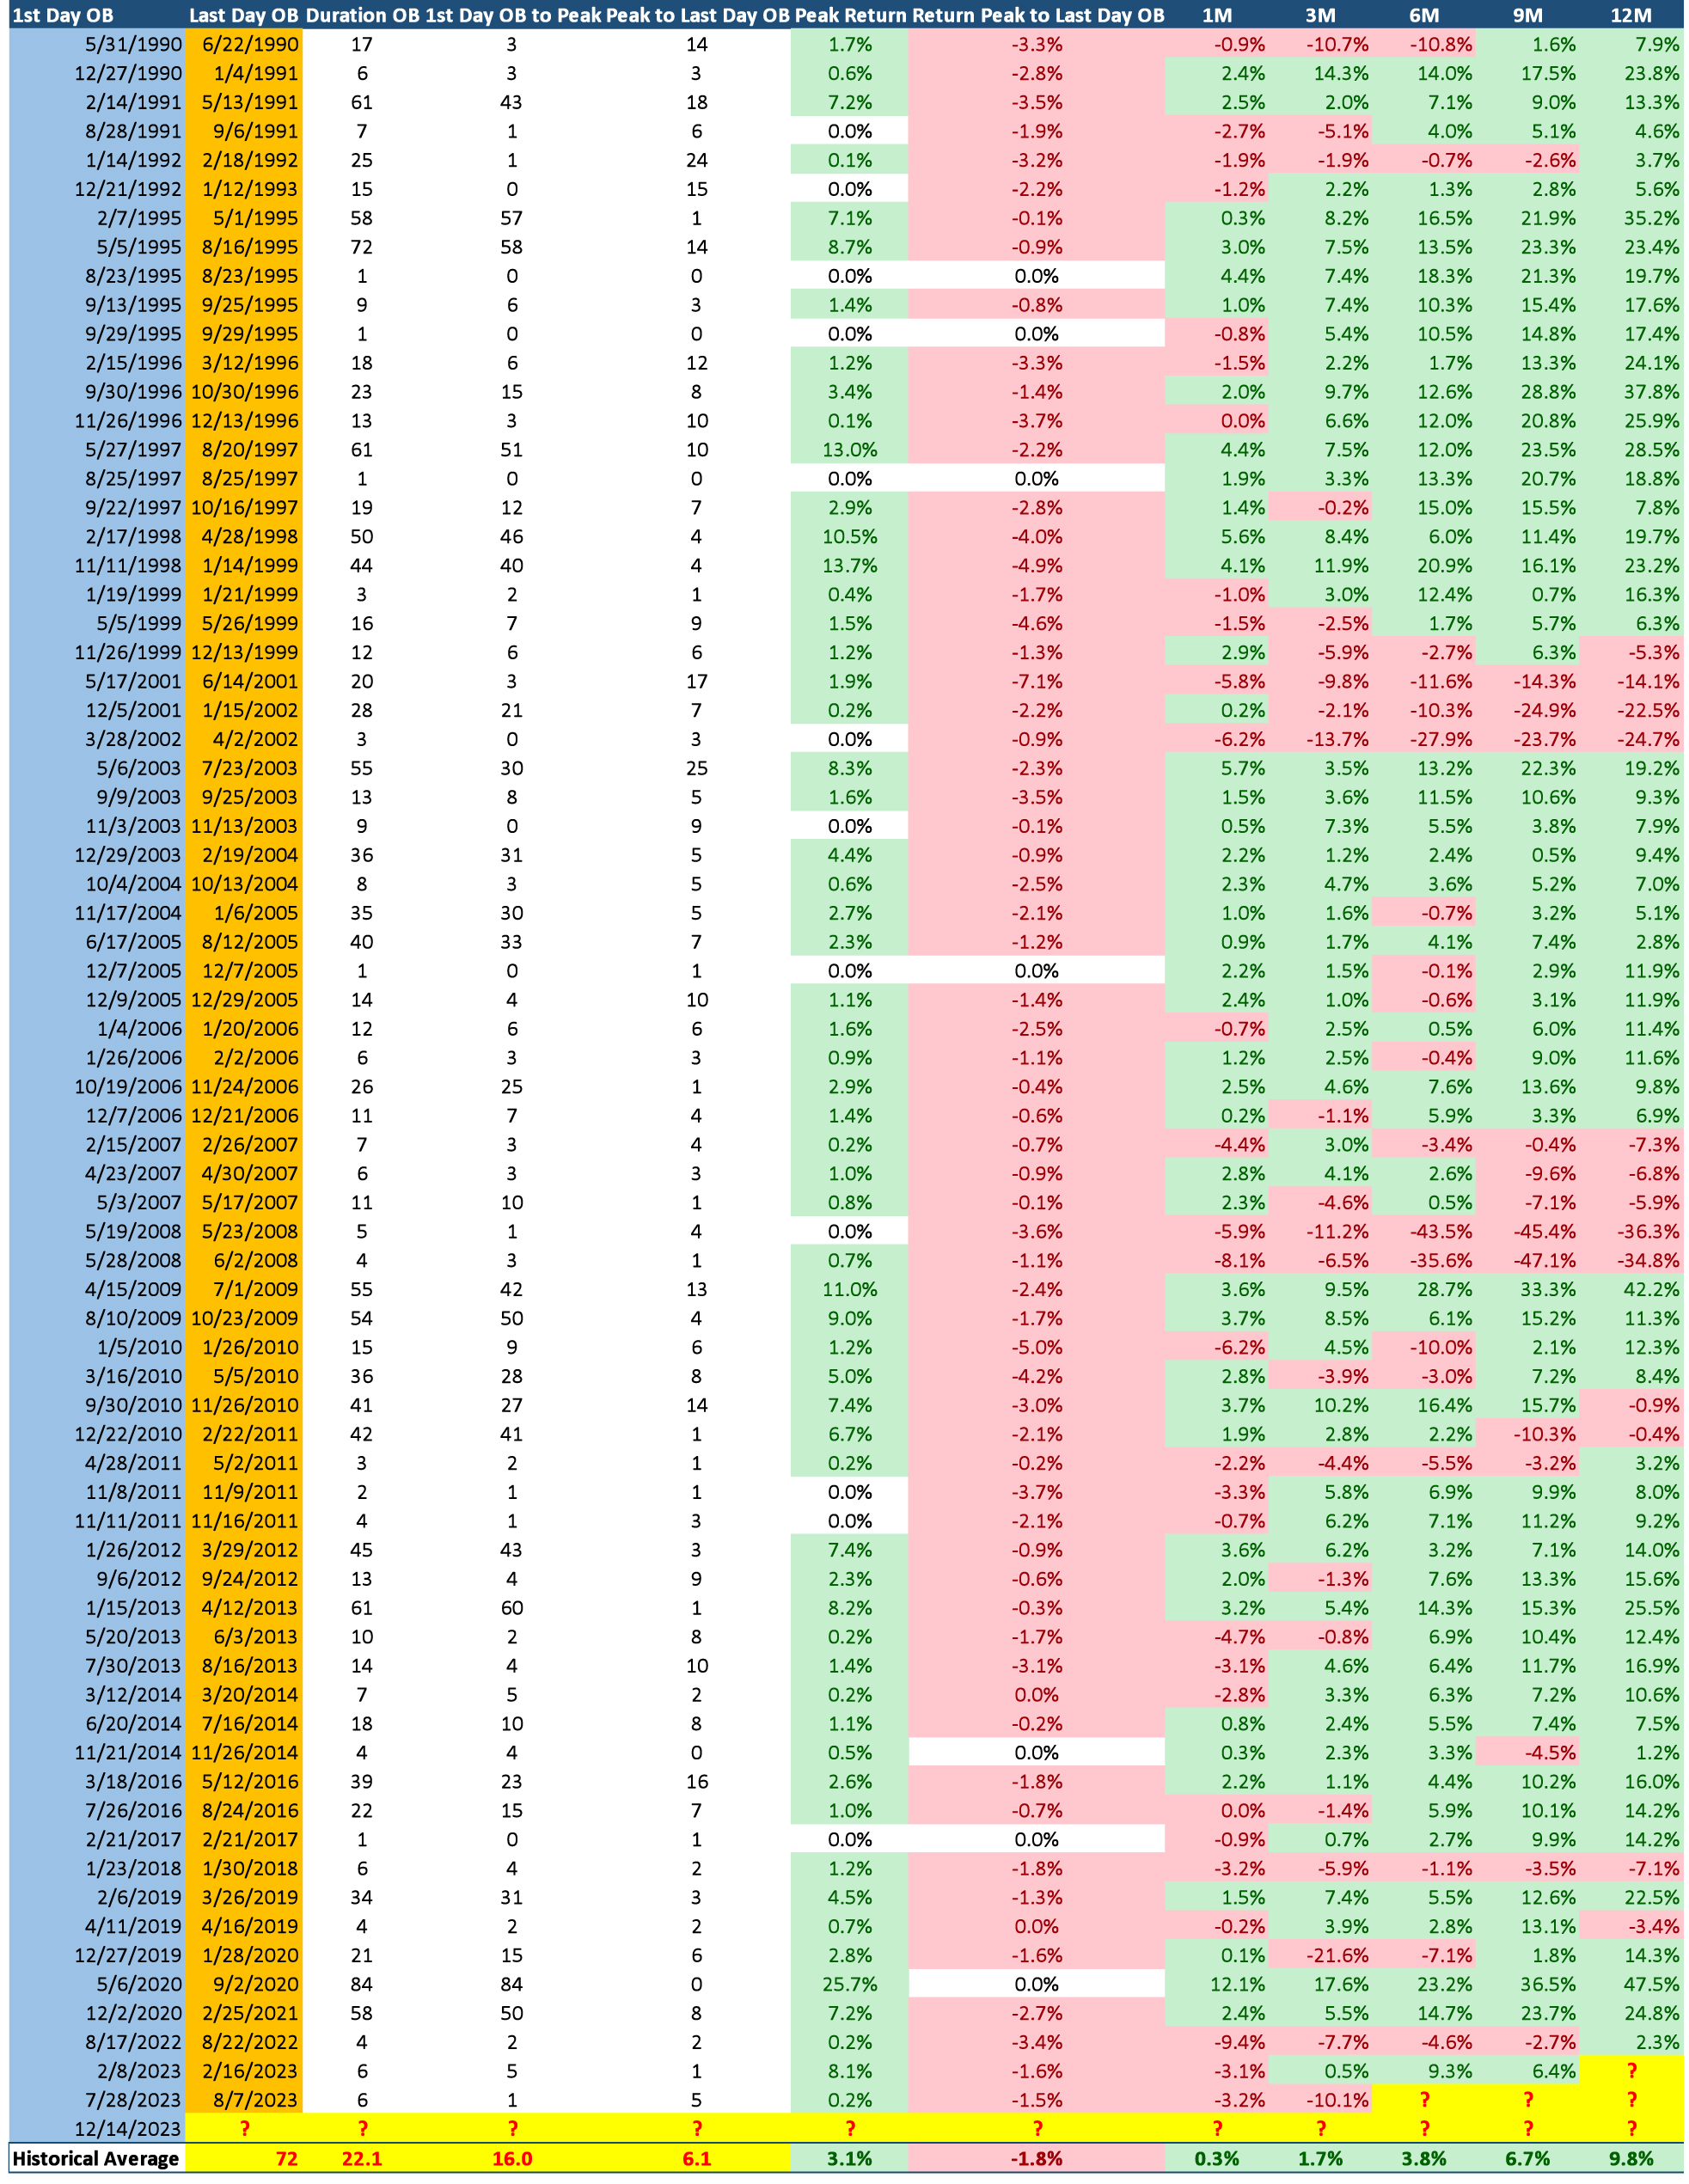
Having seen how oversold markets work out, let’s see what happens with overbought markets. You may think that the moment we go overbought, that would be the time to reduce risk, but you would be wrong. It turns out that overbought markets are more nuanced. Whereas oversold markets imply high conviction to buy stocks, oversold markets don’t necessarily mean it’s time to sell. Below you will find every instance when the BMI went overbought since our data began in 1990. I will give you the summary first.
The BMI has been overbought about 18% of the trading days since January 1st, 1990. There were 72 instances of going overbought. The average duration was 22 trading days. It took six days from the market peak after we went overbought until the BMI fell from overbought. From the first day of being overbought, the average return for the S&P 500 (SPY) was higher after 1 month (+0.3%), three months (+1.7%), six months (+3.8%), nine months (+6.7%), and 12 months later (by an average +9.8%).
Below, I’ve listed each of the 72 incidences of overbought. Note that the negative forward returns were mainly in severe crises – like the dot.com bubble (1999), 9/11 (2001) and the 2007-09 Financial Crisis.
Graphs are for illustrative and discussion purposes only. Please read important disclosures at the end of this commentary.
As of this writing (December 22, 2003), we are six trading days overbought, so the averages say we have another 16 trading days until we fall from overbought. That is the key moment when reducing risk makes most sense. Historically speaking, when the BMI falls from overbought we can expect market volatility.
That said, the forward returns are clear: From the first day of overbought, the SPY is positive on average each interval – 1 ,3, 6, 9 and 12 months later – so I wouldn’t sweat it for the following reasons:
The Fed funds target rate is currently 5.25-5.50%. The Consumer Price Index (CPI) – our most quoted and most trusted inflation indicator – is at 3.1%. On a six-month basis, the CPI is significantly lower, at roughly 2%. The 10-year bond has fallen from just under 5% to 3.9%, so the Fed is way out of whack with market rates – which are falling. Interest rates are assured to fall further – the Fed said so – for 2024 and 2025. You are seeing this being priced into stocks, fueling the massive recovery that just took place.
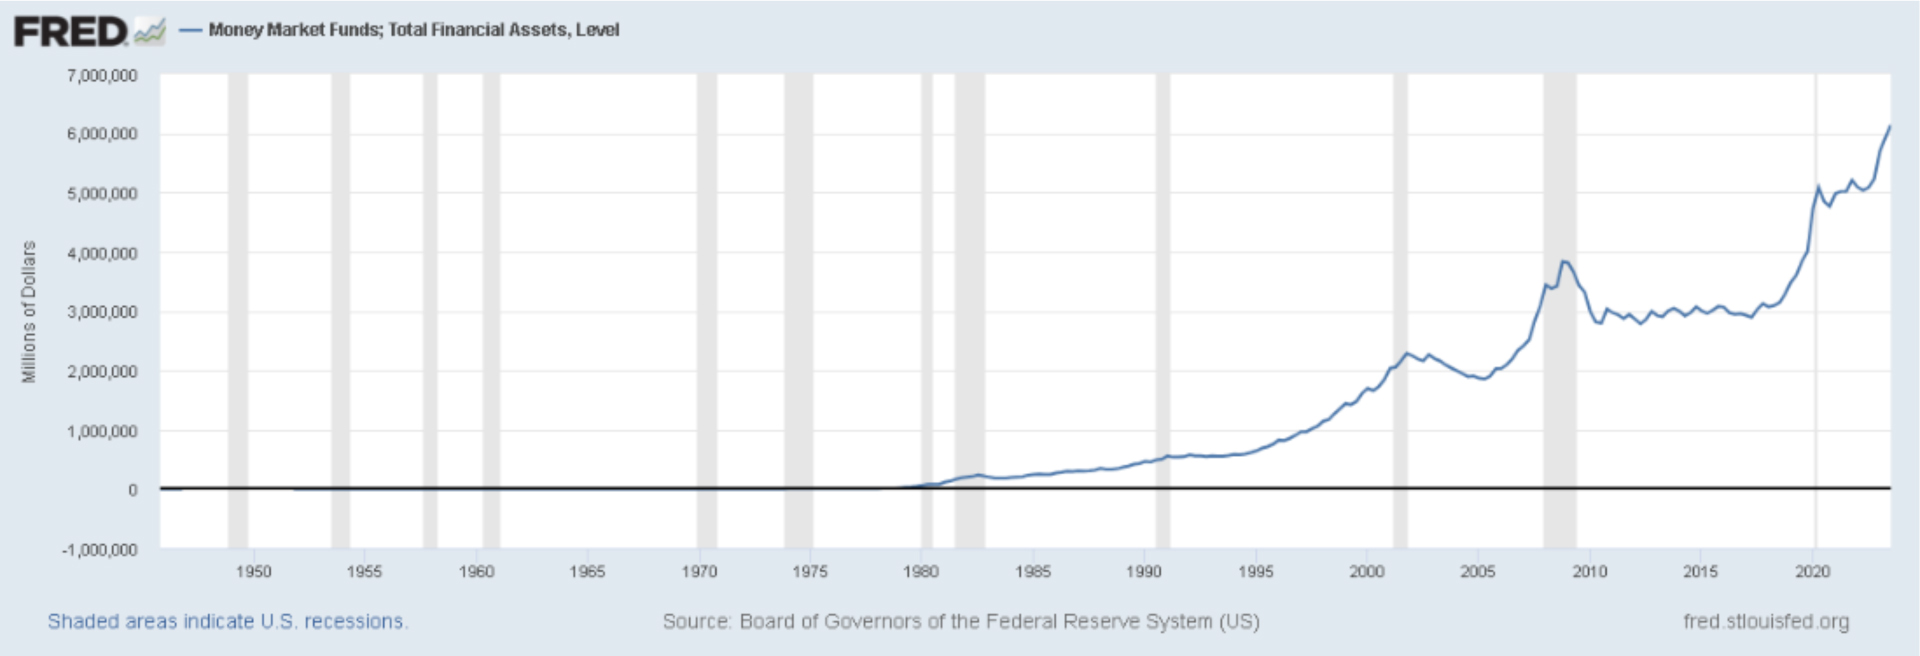
But if you think you’ve missed out, remember this: There is still a record $6.142 trillion of cash in money market accounts waiting to enter the stock market. This is the highest on record:
Graphs are for illustrative and discussion purposes only. Please read important disclosures at the end of this commentary.
As rates fall and the Fed cuts the Fed funds rate to bring it closer to market rates, we have a setup for a boom-time in stocks. The market has already rocketed 16% up from its October lows. As rates fall, money market yields will collapse, and all that safe-haven cash will look for returns. And it will flow into stocks.
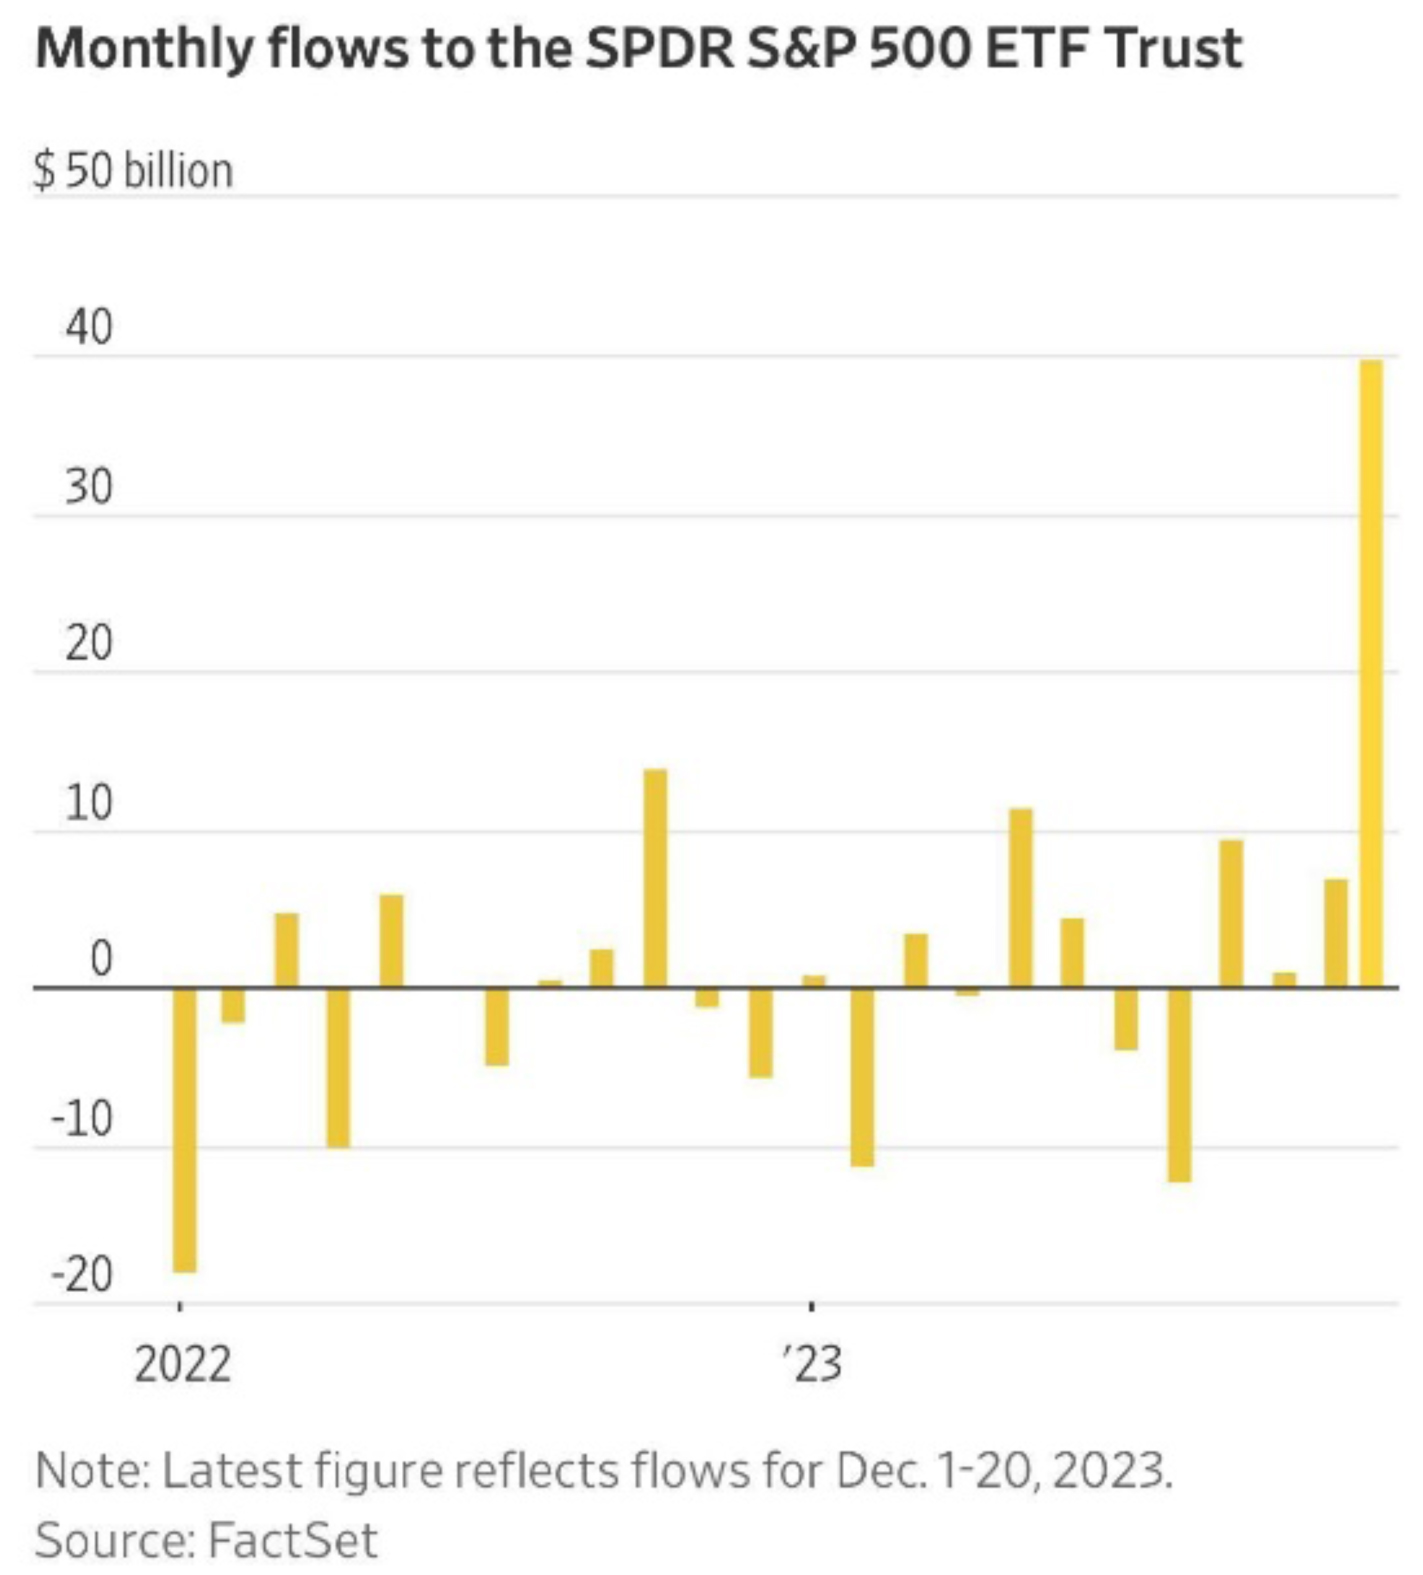
I believe that the smart money has priced this in and has already begun making monstrous inflows. As my colleague Kevin points out, December is on pace for the highest monthly inflows into the SPY on record!
Graphs are for illustrative and discussion purposes only. Please read important disclosures at the end of this commentary.
As exciting as this $40 billion of inflows looks, in chart form, it only accounts for 0.6% of the cash out there in money markets. By that logic, there’s still $6.1 trillion lurking behind that December surge.
Opinions may differ, but I prefer to count on the data, which shows us a very promising picture for the year ahead. I expect some short-term giveback in this very strong market, but I also think we are just getting underway. I am often at risk of being labelled an “eternal optimist,” but as Churchill said: “A pessimist sees the difficulty in every opportunity; an optimist sees the opportunity in every difficulty.”
All content above represents the opinion of Jason Bodner of Navellier & Associates, Inc.
Also In This Issue
A Look Ahead by Louis Navellier
The Fed’s Favorite Inflation Indicator Says “Mission Accomplished”
Income Mail by Bryan Perry
What The Tea Leaves Are Telling Us For 2024
Growth Mail by Gary Alexander
Twelve (Or More) Reasons to Expect a Prosperous 2024
Global Mail by Ivan Martchev
Awaiting the Santa Claus Rally
Sector Spotlight by Jason Bodner
When Opinions Go to War, Rely on the Data
View Full Archive
Read Past Issues Here

Jason Bodner
MARKETMAIL EDITOR FOR SECTOR SPOTLIGHT
Jason Bodner writes Sector Spotlight in the weekly Marketmail publication and has authored several white papers for the company. He is also Co-Founder of Macro Analytics for Professionals which produces proprietary equity accumulation/distribution research for its clients. Previously, Mr. Bodner served as Director of European Equity Derivatives for Cantor Fitzgerald Europe in London, then moved to the role of Head of Equity Derivatives North America for the same company in New York. He also served as S.V.P. Equity Derivatives for Jefferies, LLC. He received a B.S. in business administration in 1996, with honors, from Skidmore College as a member of the Periclean Honors Society. All content of “Sector Spotlight” represents the opinion of Jason Bodner
Important Disclosures:
Jason Bodner is a co-founder and co-owner of Mapsignals. Mr. Bodner is an independent contractor who is occasionally hired by Navellier & Associates to write an article and or provide opinions for possible use in articles that appear in Navellier & Associates weekly Market Mail. Mr. Bodner is not employed or affiliated with Louis Navellier, Navellier & Associates, Inc., or any other Navellier owned entity. The opinions and statements made here are those of Mr. Bodner and not necessarily those of any other persons or entities. This is not an endorsement, or solicitation or testimonial or investment advice regarding the BMI Index or any statements or recommendations or analysis in the article or the BMI Index or Mapsignals or its products or strategies.
Although information in these reports has been obtained from and is based upon sources that Navellier believes to be reliable, Navellier does not guarantee its accuracy and it may be incomplete or condensed. All opinions and estimates constitute Navellier’s judgment as of the date the report was created and are subject to change without notice. These reports are for informational purposes only and are not a solicitation for the purchase or sale of a security. Any decision to purchase securities mentioned in these reports must take into account existing public information on such securities or any registered prospectus.To the extent permitted by law, neither Navellier & Associates, Inc., nor any of its affiliates, agents, or service providers assumes any liability or responsibility nor owes any duty of care for any consequences of any person acting or refraining to act in reliance on the information contained in this communication or for any decision based on it.
Past performance is no indication of future results. Investment in securities involves significant risk and has the potential for partial or complete loss of funds invested. It should not be assumed that any securities recommendations made by Navellier. in the future will be profitable or equal the performance of securities made in this report. Dividend payments are not guaranteed. The amount of a dividend payment, if any, can vary over time and issuers may reduce dividends paid on securities in the event of a recession or adverse event affecting a specific industry or issuer.
None of the stock information, data, and company information presented herein constitutes a recommendation by Navellier or a solicitation to buy or sell any securities. Any specific securities identified and described do not represent all of the securities purchased, sold, or recommended for advisory clients. The holdings identified do not represent all of the securities purchased, sold, or recommended for advisory clients and the reader should not assume that investments in the securities identified and discussed were or will be profitable.
Information presented is general information that does not take into account your individual circumstances, financial situation, or needs, nor does it present a personalized recommendation to you. Individual stocks presented may not be suitable for every investor. Investment in securities involves significant risk and has the potential for partial or complete loss of funds invested. Investment in fixed income securities has the potential for the investment return and principal value of an investment to fluctuate so that an investor’s holdings, when redeemed, may be worth less than their original cost.
One cannot invest directly in an index. Index is unmanaged and index performance does not reflect deduction of fees, expenses, or taxes. Presentation of Index data does not reflect a belief by Navellier that any stock index constitutes an investment alternative to any Navellier equity strategy or is necessarily comparable to such strategies. Among the most important differences between the Indices and Navellier strategies are that the Navellier equity strategies may (1) incur material management fees, (2) concentrate its investments in relatively few stocks, industries, or sectors, (3) have significantly greater trading activity and related costs, and (4) be significantly more or less volatile than the Indices.
ETF Risk: We may invest in exchange traded funds (“ETFs”) and some of our investment strategies are generally fully invested in ETFs. Like traditional mutual funds, ETFs charge asset-based fees, but they generally do not charge initial sales charges or redemption fees and investors typically pay only customary brokerage fees to buy and sell ETF shares. The fees and costs charged by ETFs held in client accounts will not be deducted from the compensation the client pays Navellier. ETF prices can fluctuate up or down, and a client account could lose money investing in an ETF if the prices of the securities owned by the ETF go down. ETFs are subject to additional risks:
- ETF shares may trade above or below their net asset value;
- An active trading market for an ETF’s shares may not develop or be maintained;
- The value of an ETF may be more volatile than the underlying portfolio of securities the ETF is designed to track;
- The cost of owning shares of the ETF may exceed those a client would incur by directly investing in the underlying securities; and
- Trading of an ETF’s shares may be halted if the listing exchange’s officials deem it appropriate, the shares are delisted from the exchange, or the activation of market-wide “circuit breakers” (which are tied to large decreases in stock prices) halts stock trading generally.
Grader Disclosures: Investment in equity strategies involves substantial risk and has the potential for partial or complete loss of funds invested. The sample portfolio and any accompanying charts are for informational purposes only and are not to be construed as a solicitation to buy or sell any financial instrument and should not be relied upon as the sole factor in an investment making decision. As a matter of normal and important disclosures to you, as a potential investor, please consider the following: The performance presented is not based on any actual securities trading, portfolio, or accounts, and the reported performance of the A, B, C, D, and F portfolios (collectively the “model portfolios”) should be considered mere “paper” or pro forma performance results based on Navellier’s research.
Investors evaluating any of Navellier & Associates, Inc.’s, (or its affiliates’) Investment Products must not use any information presented here, including the performance figures of the model portfolios, in their evaluation of any Navellier Investment Products. Navellier Investment Products include the firm’s mutual funds and managed accounts. The model portfolios, charts, and other information presented do not represent actual funded trades and are not actual funded portfolios. There are material differences between Navellier Investment Products’ portfolios and the model portfolios, research, and performance figures presented here. The model portfolios and the research results (1) may contain stocks or ETFs that are illiquid and difficult to trade; (2) may contain stock or ETF holdings materially different from actual funded Navellier Investment Product portfolios; (3) include the reinvestment of all dividends and other earnings, estimated trading costs, commissions, or management fees; and, (4) may not reflect prices obtained in an actual funded Navellier Investment Product portfolio. For these and other reasons, the reported performances of model portfolios do not reflect the performance results of Navellier’s actually funded and traded Investment Products. In most cases, Navellier’s Investment Products have materially lower performance results than the performances of the model portfolios presented.
This report contains statements that are, or may be considered to be, forward-looking statements. All statements that are not historical facts, including statements about our beliefs or expectations, are “forward-looking statements” within the meaning of The U.S. Private Securities Litigation Reform Act of 1995. These statements may be identified by such forward-looking terminology as “expect,” “estimate,” “plan,” “intend,” “believe,” “anticipate,” “may,” “will,” “should,” “could,” “continue,” “project,” or similar statements or variations of such terms. Our forward-looking statements are based on a series of expectations, assumptions, and projections, are not guarantees of future results or performance, and involve substantial risks and uncertainty as described in Form ADV Part 2A of our filing with the Securities and Exchange Commission (SEC), which is available at www.adviserinfo.sec.gov or by requesting a copy by emailing info@navellier.com. All of our forward-looking statements are as of the date of this report only. We can give no assurance that such expectations or forward-looking statements will prove to be correct. Actual results may differ materially. You are urged to carefully consider all such factors.
FEDERAL TAX ADVICE DISCLAIMER: As required by U.S. Treasury Regulations, you are informed that, to the extent this presentation includes any federal tax advice, the presentation is not written by Navellier to be used, and cannot be used, for the purpose of avoiding federal tax penalties. Navellier does not advise on any income tax requirements or issues. Use of any information presented by Navellier is for general information only and does not represent tax advice either express or implied. You are encouraged to seek professional tax advice for income tax questions and assistance.
IMPORTANT NEWSLETTER DISCLOSURE:The hypothetical performance results for investment newsletters that are authored or edited by Louis Navellier, including Louis Navellier’s Growth Investor, Louis Navellier’s Breakthrough Stocks, Louis Navellier’s Accelerated Profits, and Louis Navellier’s Platinum Club, are not based on any actual securities trading, portfolio, or accounts, and the newsletters’ reported hypothetical performances should be considered mere “paper” or proforma hypothetical performance results and are not actual performance of real world trades. Navellier & Associates, Inc. does not have any relation to or affiliation with the owner of these newsletters. There are material differences between Navellier Investment Products’ portfolios and the InvestorPlace Media, LLC newsletter portfolios authored by Louis Navellier. The InvestorPlace Media, LLC newsletters contain hypothetical performance that do not include transaction costs, advisory fees, or other fees a client might incur if actual investments and trades were being made by an investor. As a result, newsletter performance should not be used to evaluate Navellier Investment services which are separate and different from the newsletters. The owner of the newsletters is InvestorPlace Media, LLC and any questions concerning the newsletters, including any newsletter advertising or hypothetical Newsletter performance claims, (which are calculated solely by Investor Place Media and not Navellier) should be referred to InvestorPlace Media, LLC at (800) 718-8289.
Please note that Navellier & Associates and the Navellier Private Client Group are managed completely independent of the newsletters owned and published by InvestorPlace Media, LLC and written and edited by Louis Navellier, and investment performance of the newsletters should in no way be considered indicative of potential future investment performance for any Navellier & Associates separately managed account portfolio. Potential investors should consult with their financial advisor before investing in any Navellier Investment Product.
Navellier claims compliance with Global Investment Performance Standards (GIPS). To receive a complete list and descriptions of Navellier’s composites and/or a presentation that adheres to the GIPS standards, please contact Navellier or click here. It should not be assumed that any securities recommendations made by Navellier & Associates, Inc. in the future will be profitable or equal the performance of securities made in this report.
FactSet Disclosure: Navellier does not independently calculate the statistical information included in the attached report. The calculation and the information are provided by FactSet, a company not related to Navellier. Although information contained in the report has been obtained from FactSet and is based on sources Navellier believes to be reliable, Navellier does not guarantee its accuracy, and it may be incomplete or condensed. The report and the related FactSet sourced information are provided on an “as is” basis. The user assumes the entire risk of any use made of this information. Investors should consider the report as only a single factor in making their investment decision. The report is for informational purposes only and is not intended as an offer or solicitation for the purchase or sale of a security. FactSet sourced information is the exclusive property of FactSet. Without prior written permission of FactSet, this information may not be reproduced, disseminated or used to create any financial products. All indices are unmanaged and performance of the indices include reinvestment of dividends and interest income, unless otherwise noted, are not illustrative of any particular investment and an investment cannot be made in any index. Past performance is no guarantee of future results.