by Jason Bodner
December 19, 2023
Good things come to those who wait. Cicadas can wait a long time. They wait 17 years in hibernation before emerging. We didn’t have to wait 17 years before a raging bull reared its head, even if it felt like it.
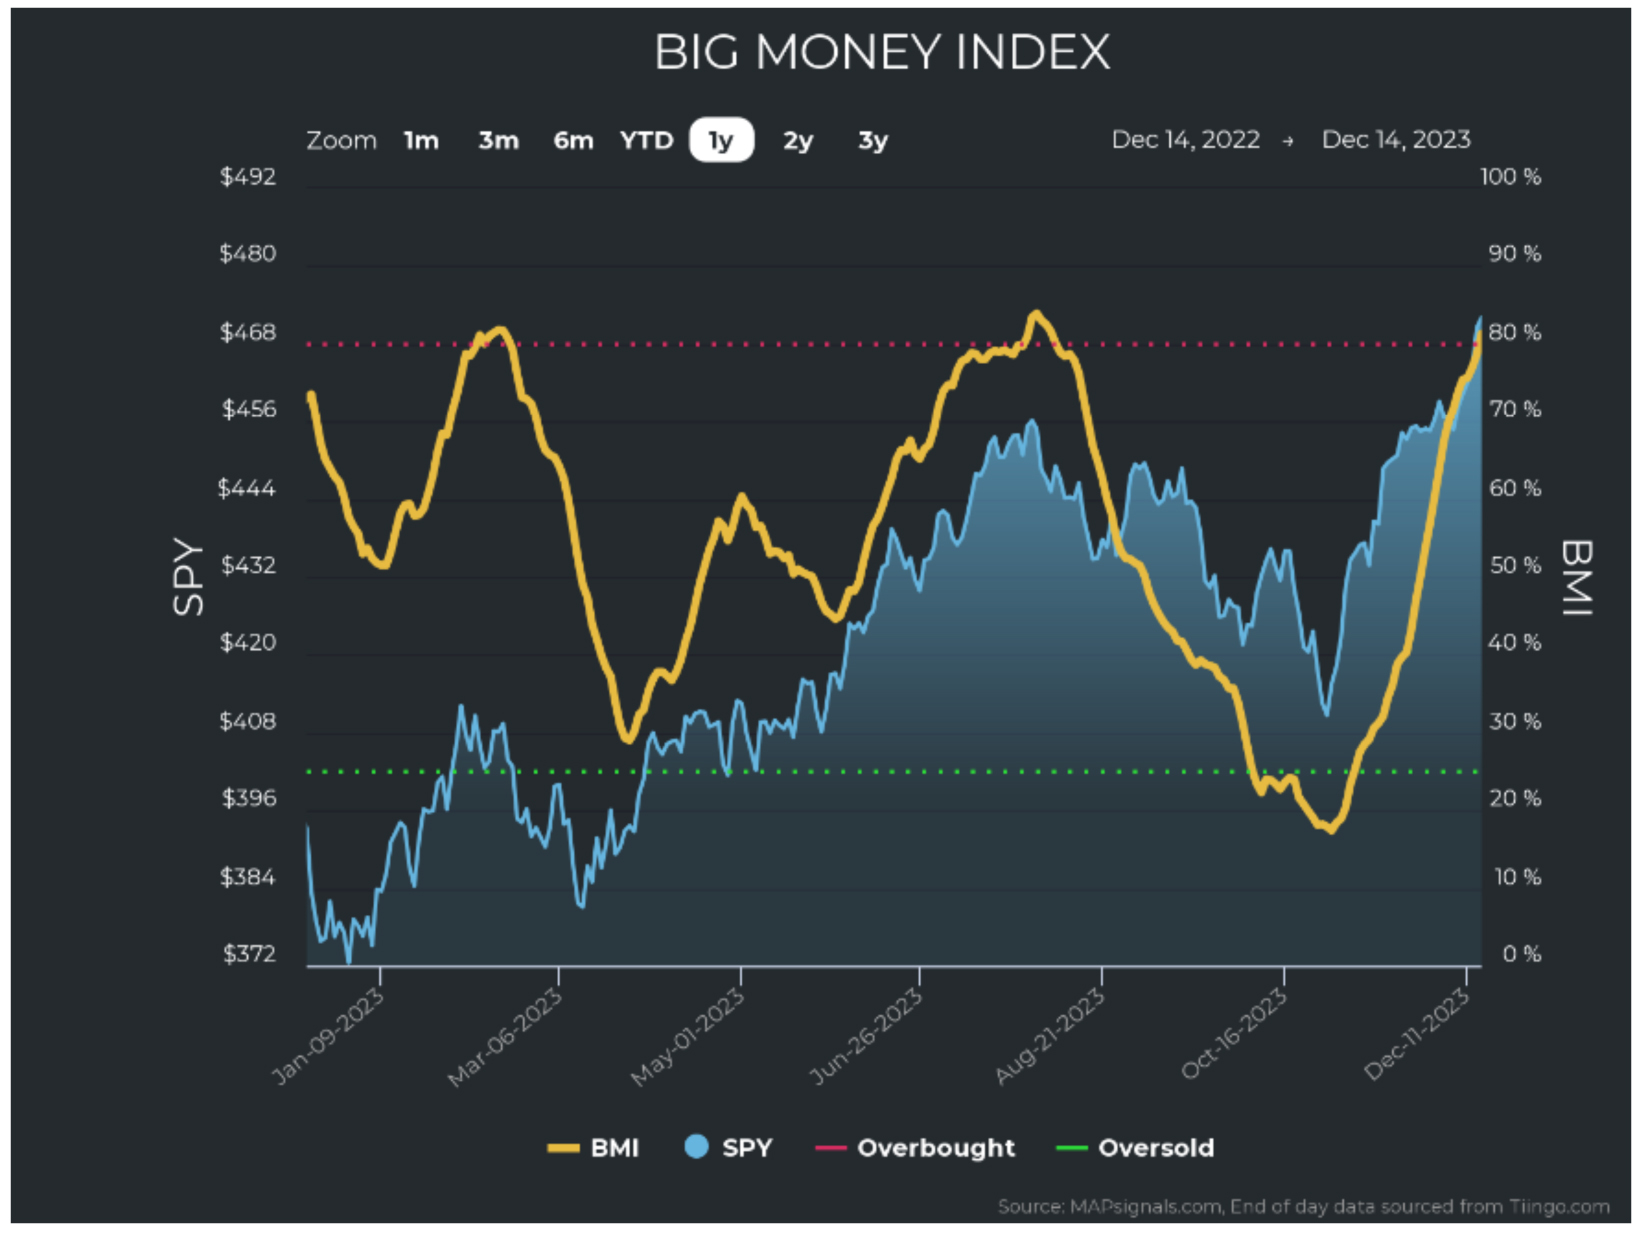
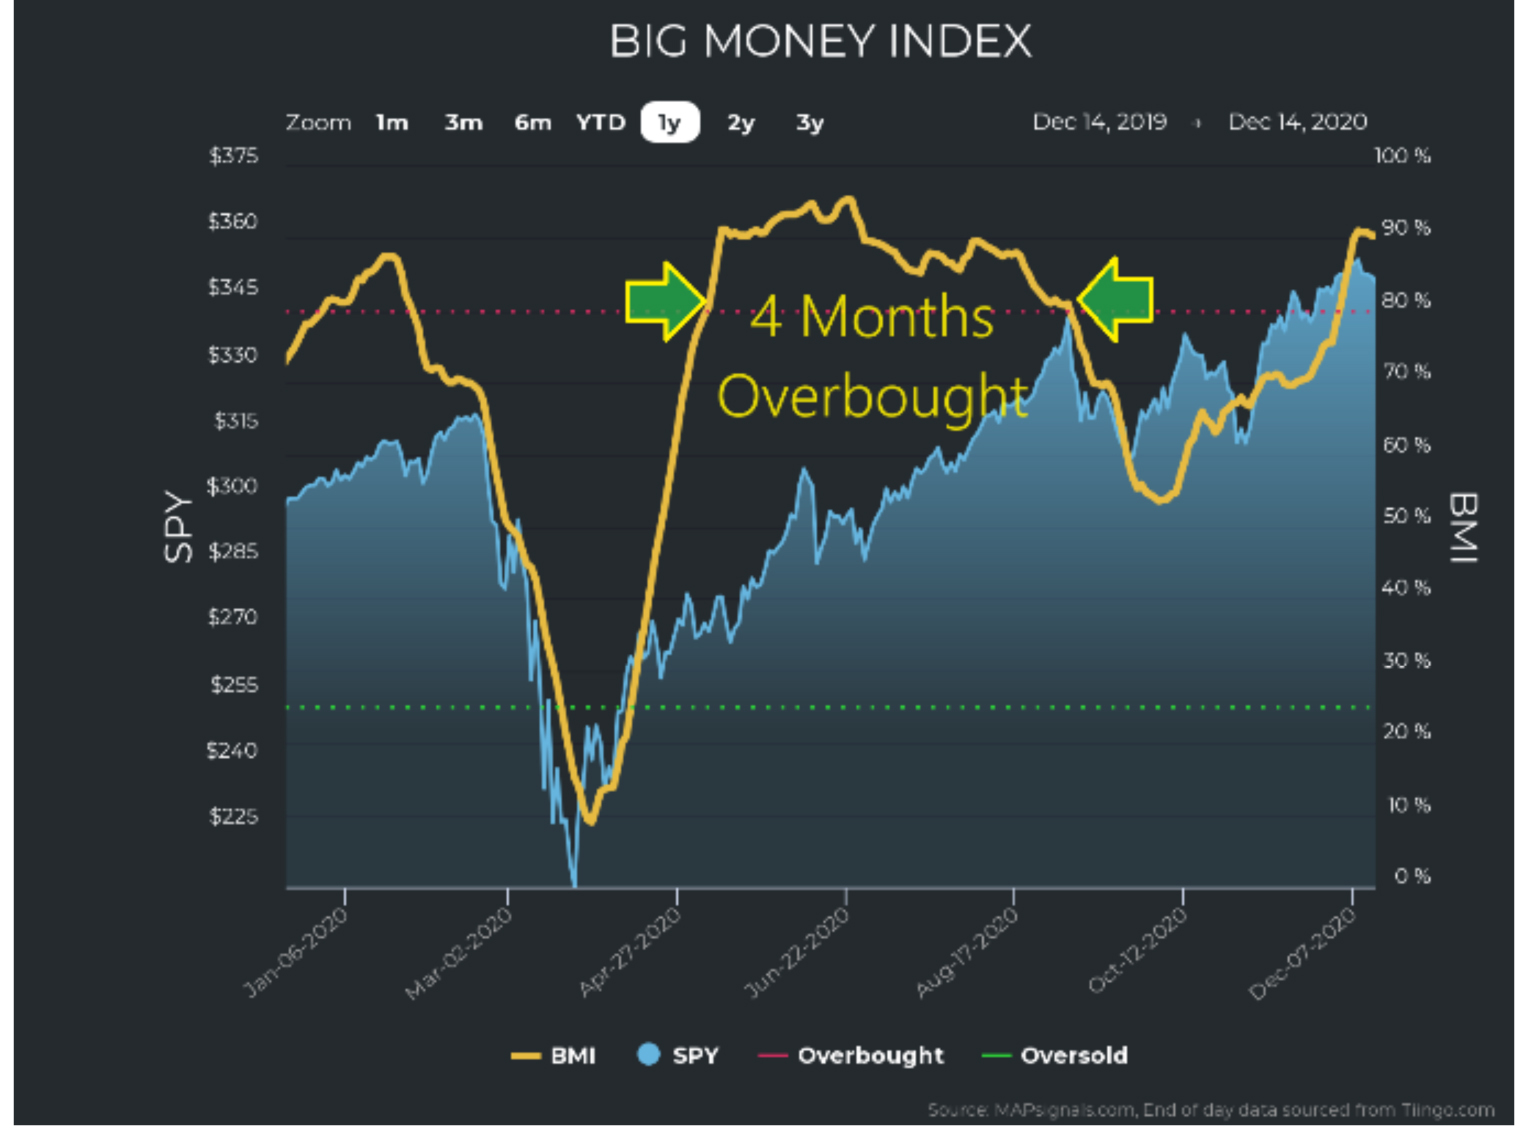
As I had been anticipating, the Big Money Index (BMI) has gone overbought, but that doesn’t mean you should sell your stocks because it doesn’t matter much when the BMI goes overbought; it matters when it falls from overbought. I’ll explain, but first, something about the BMI: pretext is context, meaning, what happened before, greatly impacts how the BMI behaves. That’s how it was designed. Allow me to explain:
The BMI is a proxy for unusual money flows. The BMI takes all unusual buying and selling of stocks and ETFs and plots them on a 25-day moving average. It’s a totally unique measure and unavailable anywhere else. It allows pinpointing market pivot points with stunning accuracy.
Let’s take recent events: the stock market quickly flipped from oversold to overbought. On November 3rd, the BMI was oversold and less than six weeks later, on December 14th, the BMI became overbought.
Graphs are for illustrative and discussion purposes only. Please read important disclosures at the end of this commentary.
As rapid as that seems, it makes sense – especially after times of heavy turbulence. When markets become grossly oversold, the bears have control and there is usually no good news around. Liquidity is dry and volatility is high. That was October’s climate. It is important to acknowledge that October came on the heels of intense volatility in August and September. This is an important distinction. For three months – or more than 60 days – there was constant selling, reaching a fever pitch in late October.
One key component of an unusual buy or sell signal is that it violates a 55-day high or low on extreme volume. Three months of trading lines up nicely with that critical component of signal generation. When the switch finally flipped from selling to buying, those 55-day highs became easier and easier to achieve. That meant more and more buy signals could be generated each day – especially on rising volumes.
And that’s exactly what we saw:
Graphs are for illustrative and discussion purposes only. Please read important disclosures at the end of this commentary.
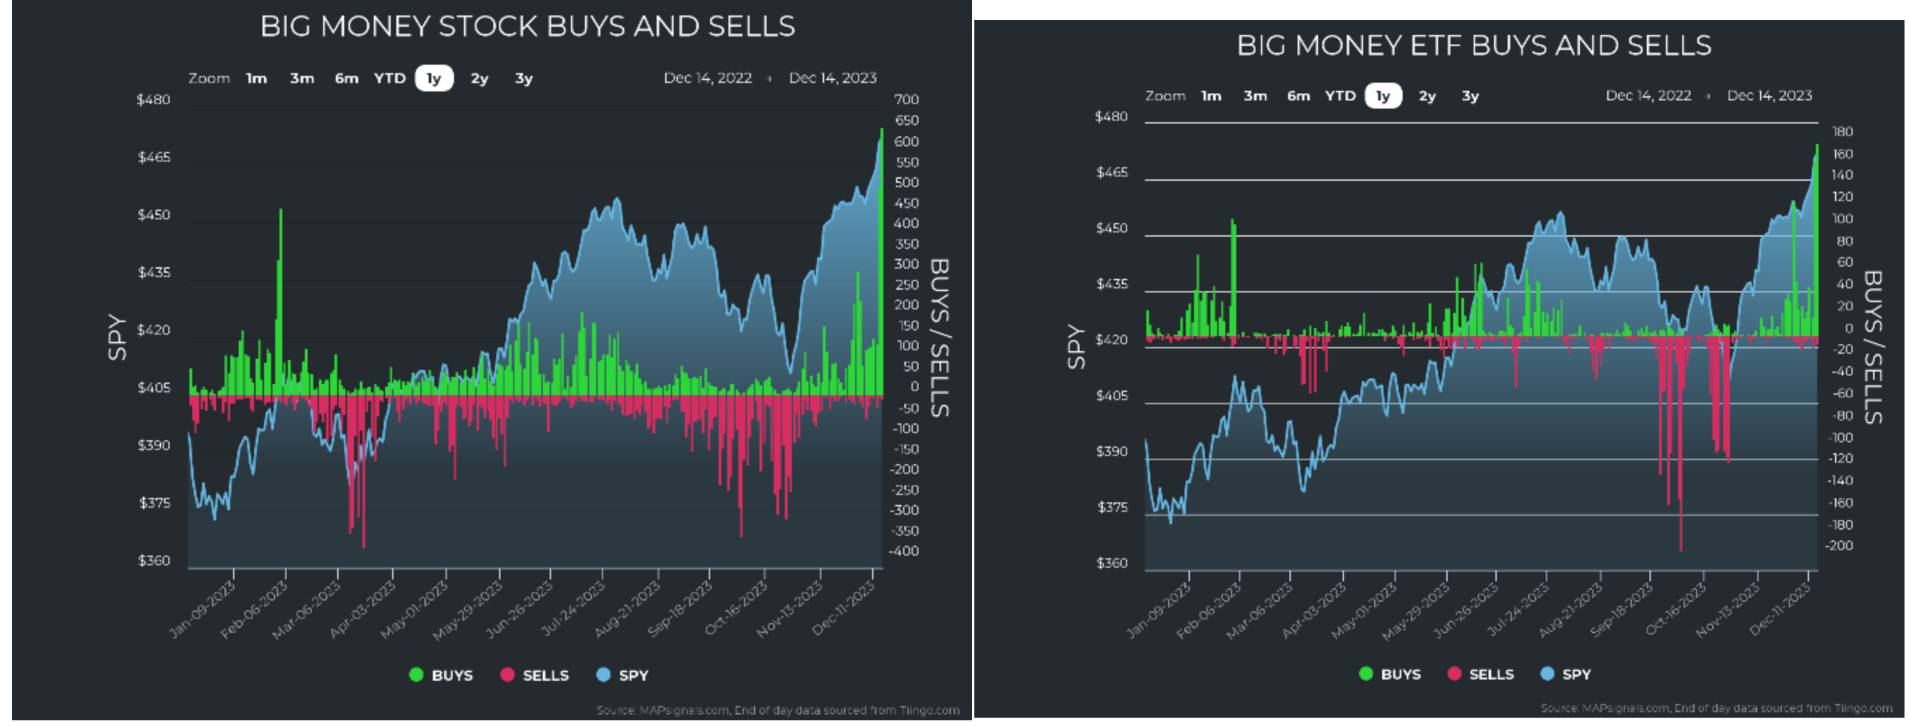
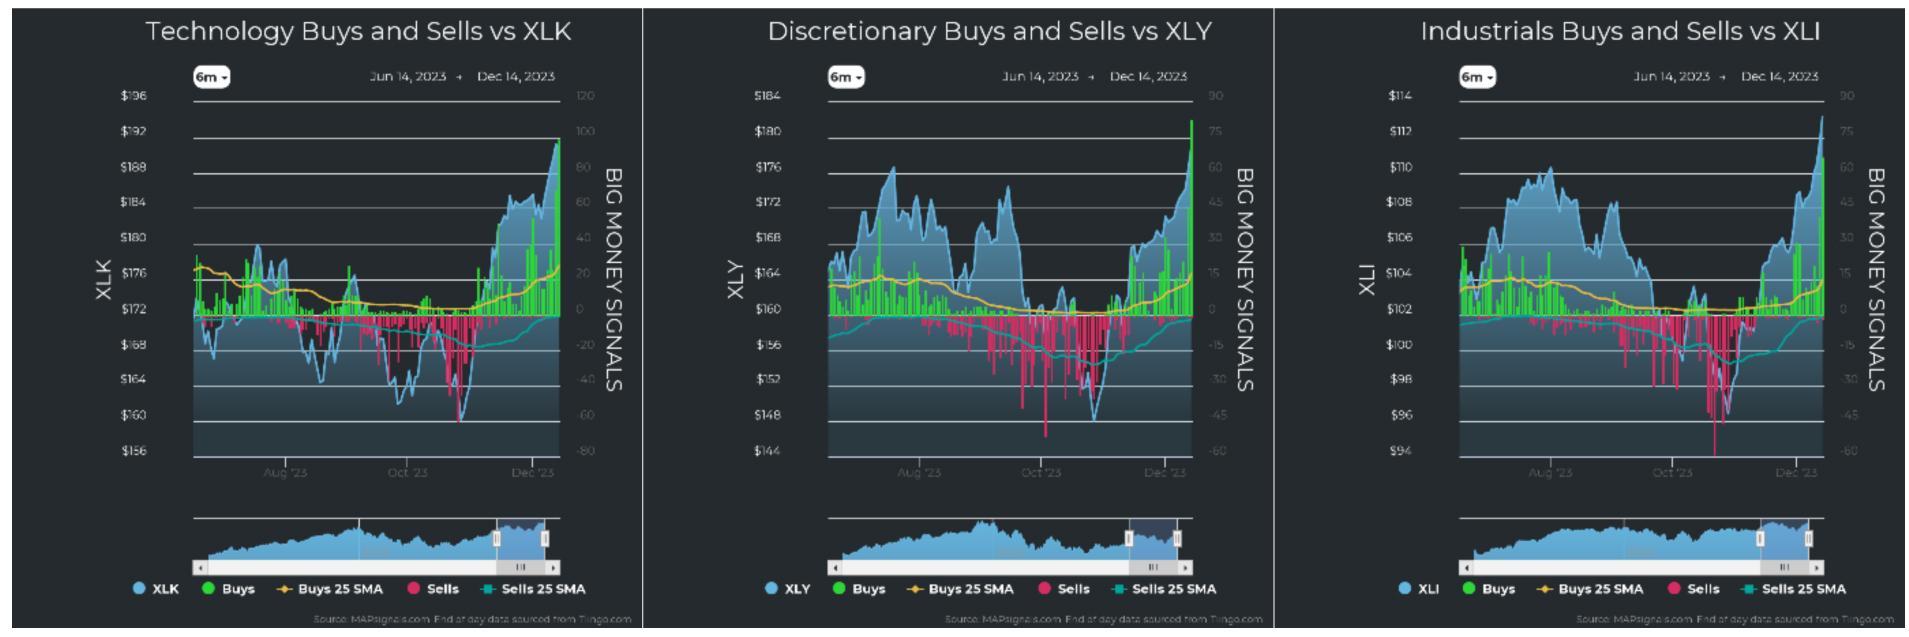
You can clearly see, in the charts above, the green buying bars launched in early November. Not only have they not stopped but they have intensified. And the latest data shows extreme buying.
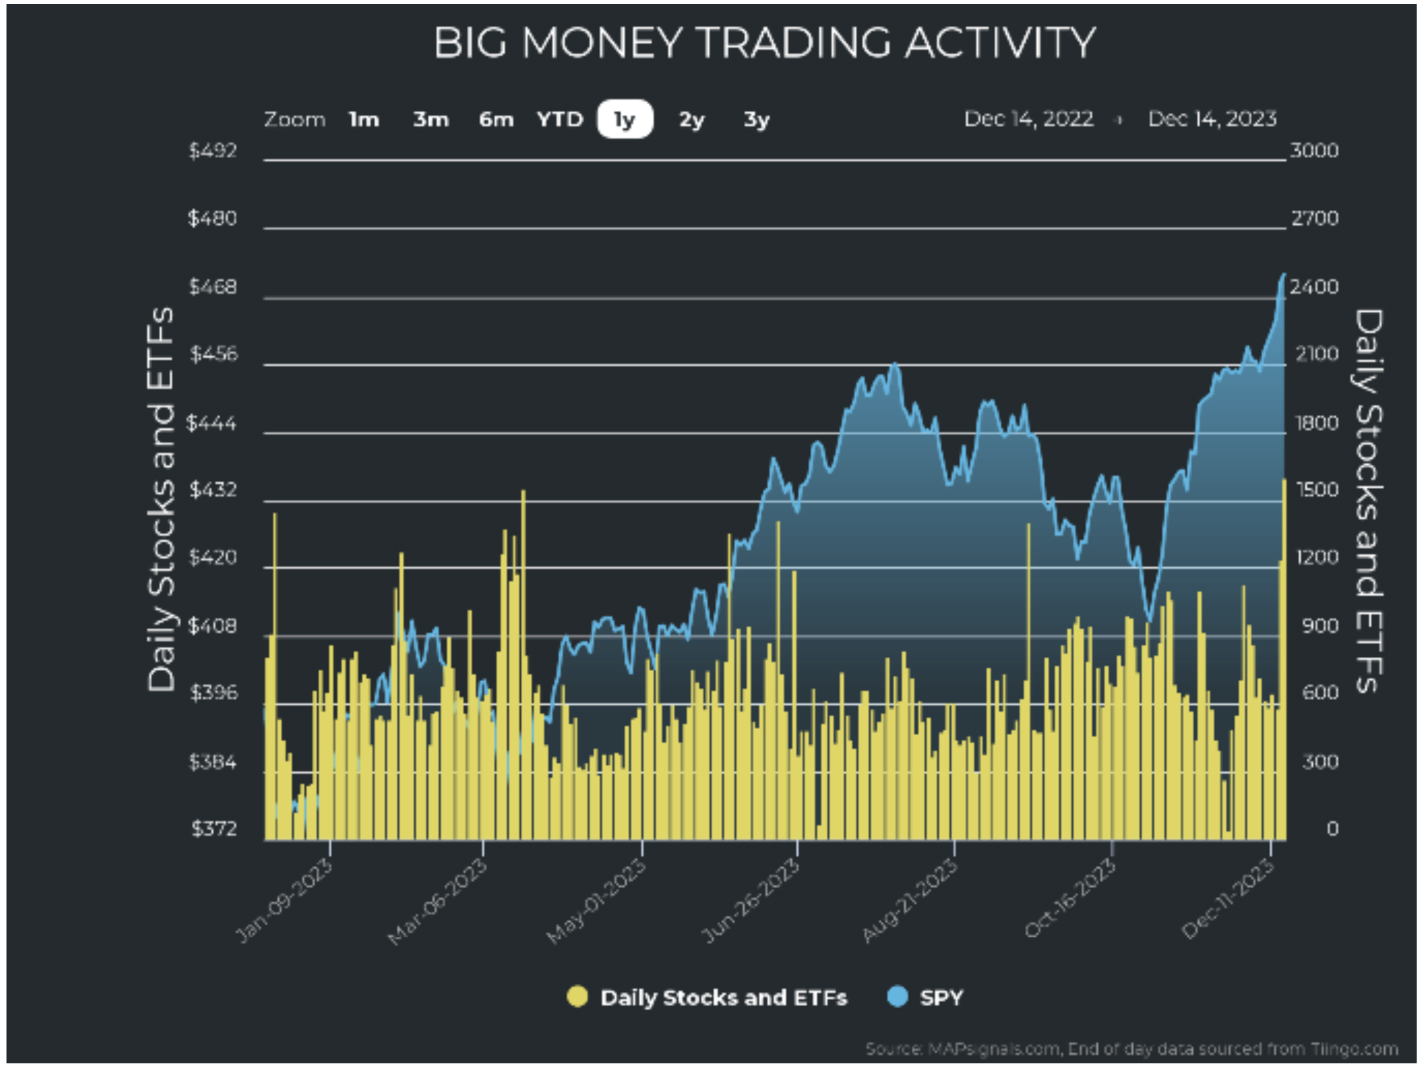
This is corroborated from the chart of unusual trading (not necessarily up-trends of buying or downtrend selling – but just big trading). We can see that the latest push higher was on huge volume:
Graphs are for illustrative and discussion purposes only. Please read important disclosures at the end of this commentary.
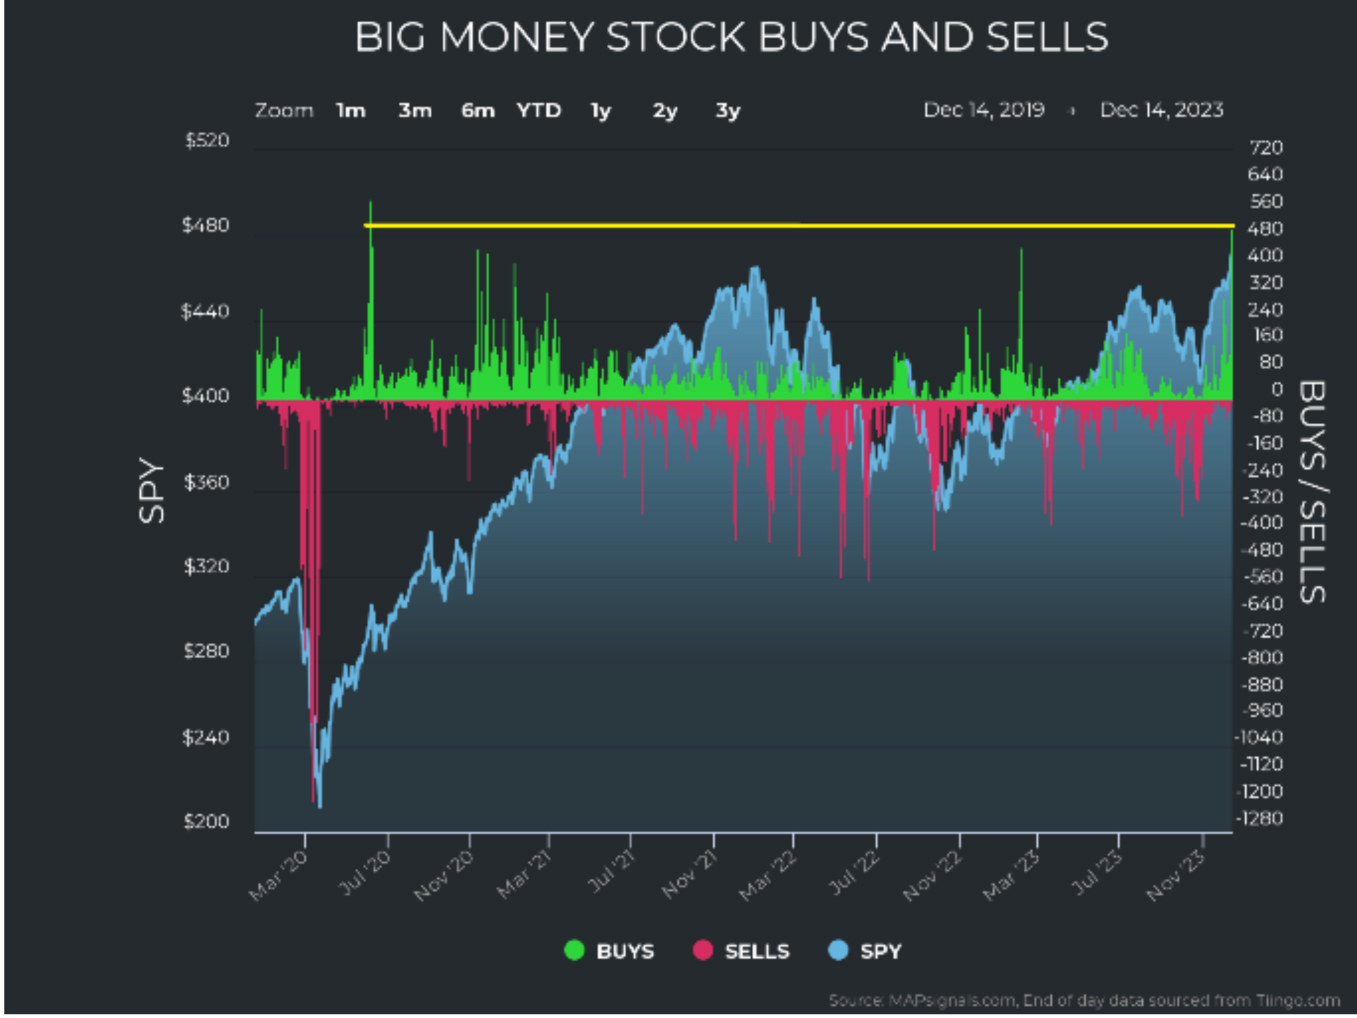
We haven’t seen buying like this since June 9th of 2020:
Graphs are for illustrative and discussion purposes only. Please read important disclosures at the end of this commentary.
That 2020 buying spike directly prefaced a -6.8% drop in the SPY that took place over a few days, but for context, this buying peak was out of the depth of the COVID uncertainty and lock-down period.
The latest buying might indeed preview a market pullback. And given the speed and intensity of the rally, that would seem warranted, and natural. But before you get scared out of stocks, understand this:
The June 9, 2020, buying peak marked a 45% rally from the market’s ultimate COVID low on March 23, 2020. Let’s say you had exited stocks because the BMI went overbought on May 6, 2020. Then you would have missed out on a substantial +13% rally until the peak June buying. Now if you had exited stocks because of that peak June buying, you still would have been very early. That’s because from the June 9th green spike, the SPY still rallied another +52%!
Now, this is the key point I want you to take away – this is because the BMI can stay overbought for a long time – especially after deeply oversold conditions like October of this year.
Look at this chart of the BMI reflecting the post-COVID time period we just discussed. You can see the BMI stayed overbought for a shockingly long period of 87 trading days – almost exactly 4 months:
Graphs are for illustrative and discussion purposes only. Please read important disclosures at the end of this commentary.
The takeaway here is to watch for when the BMI falls from 80% (overbought). This buying could sustain itself for a while because the world got the closest equivalent to the Fed flashing a “green light” (which they sort of did). In its latest announcement, the Fed announced that rate cuts are coming in 2024 and 2025. They telegraphed six cuts, with the dot-plots indicating rates falling by 0.75% in 2024 alone.
I believe rate cuts will come sooner than later. The first reason is that the Fed target rate of 5.25-5.50% is wildly higher than both the CPI (3.1%) and the 10-year bond (3.93%). This can’t last. And let’s not forget that inflation is falling along with market rates. The Fed does not like to fight against the market grain.
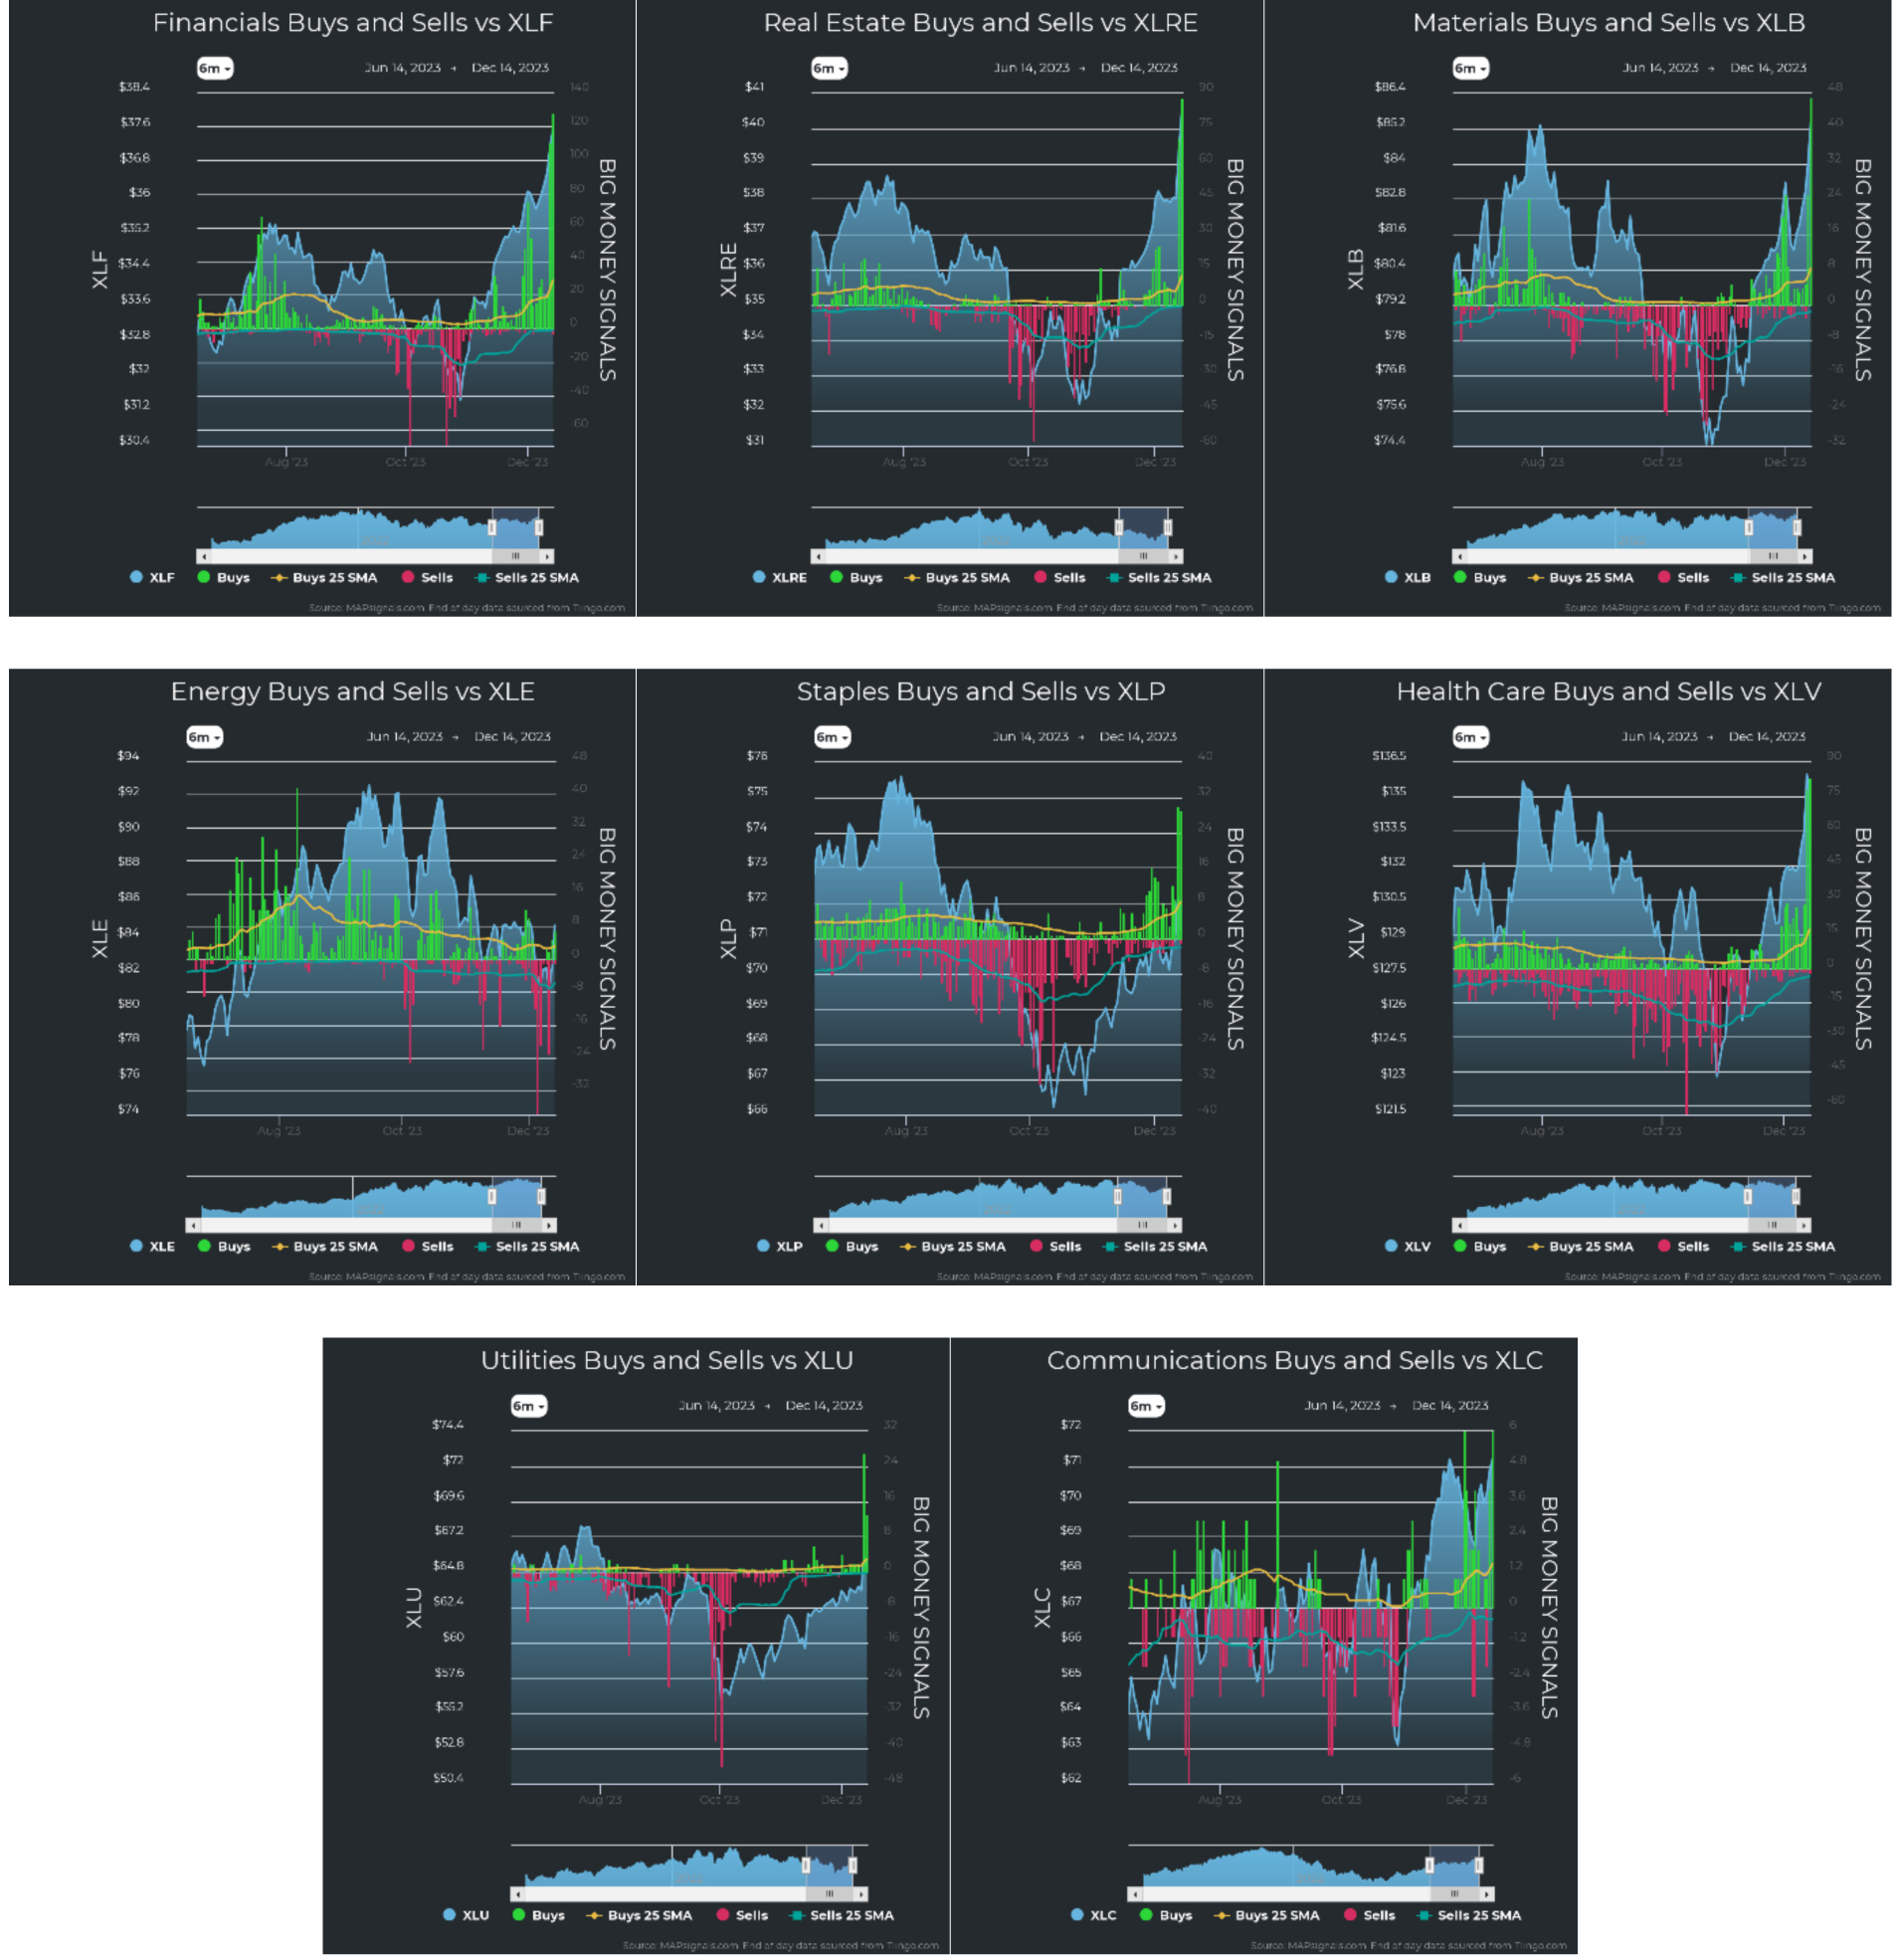
This is the conformation that the investing world has been waiting for, and it’s evidenced by the recent action. Recent buying has been happening in all sectors (except energy), as seen here:
Graphs are for illustrative and discussion purposes only. Please read important disclosures at the end of this commentary.
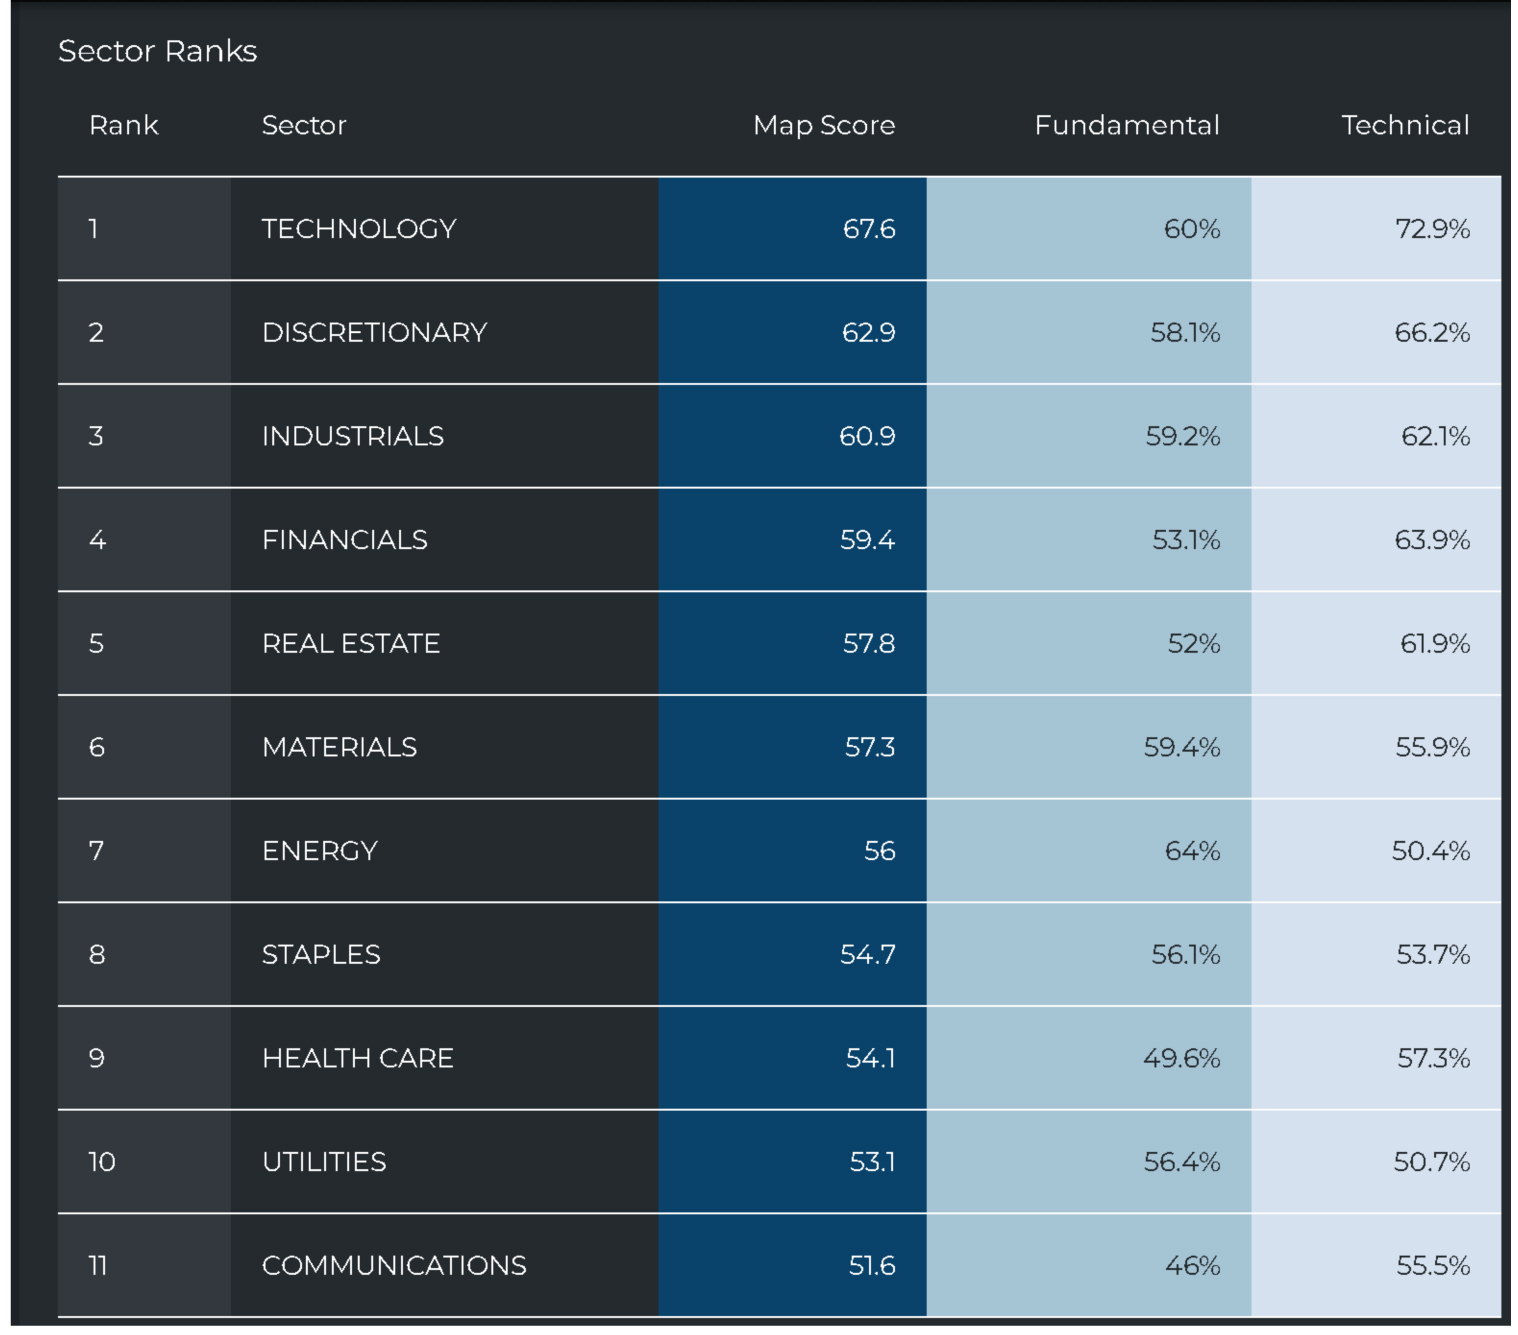
And here is how the sector strengths look. Notice how growth sectors are at the top of the list:
Graphs are for illustrative and discussion purposes only. Please read important disclosures at the end of this commentary.
Lastly, we’ve seen huge buying since November 1st in growth-heavy small and mid-cap stocks:
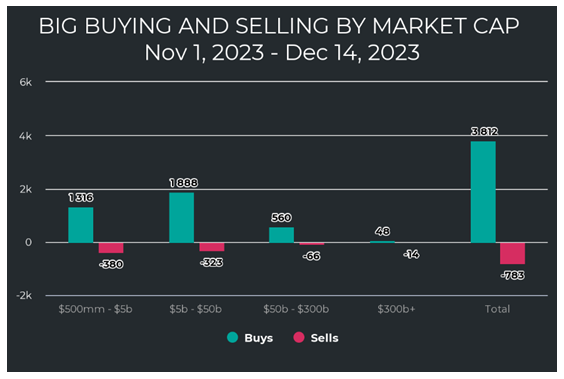
Graphs are for illustrative and discussion purposes only. Please read important disclosures at the end of this commentary.
Recession may or may not come. It’s almost sad that there are still so many pundits calling for a recession with so little evidence. There has been a call for a major recession for three years running, and it just hasn’t come. And now rates are poised to fall for the next two years. Folks, I believe this is the beginning of the cash bubble popping… a cash bubble that has swelled to an astonishing 6.14 trillion dollars!
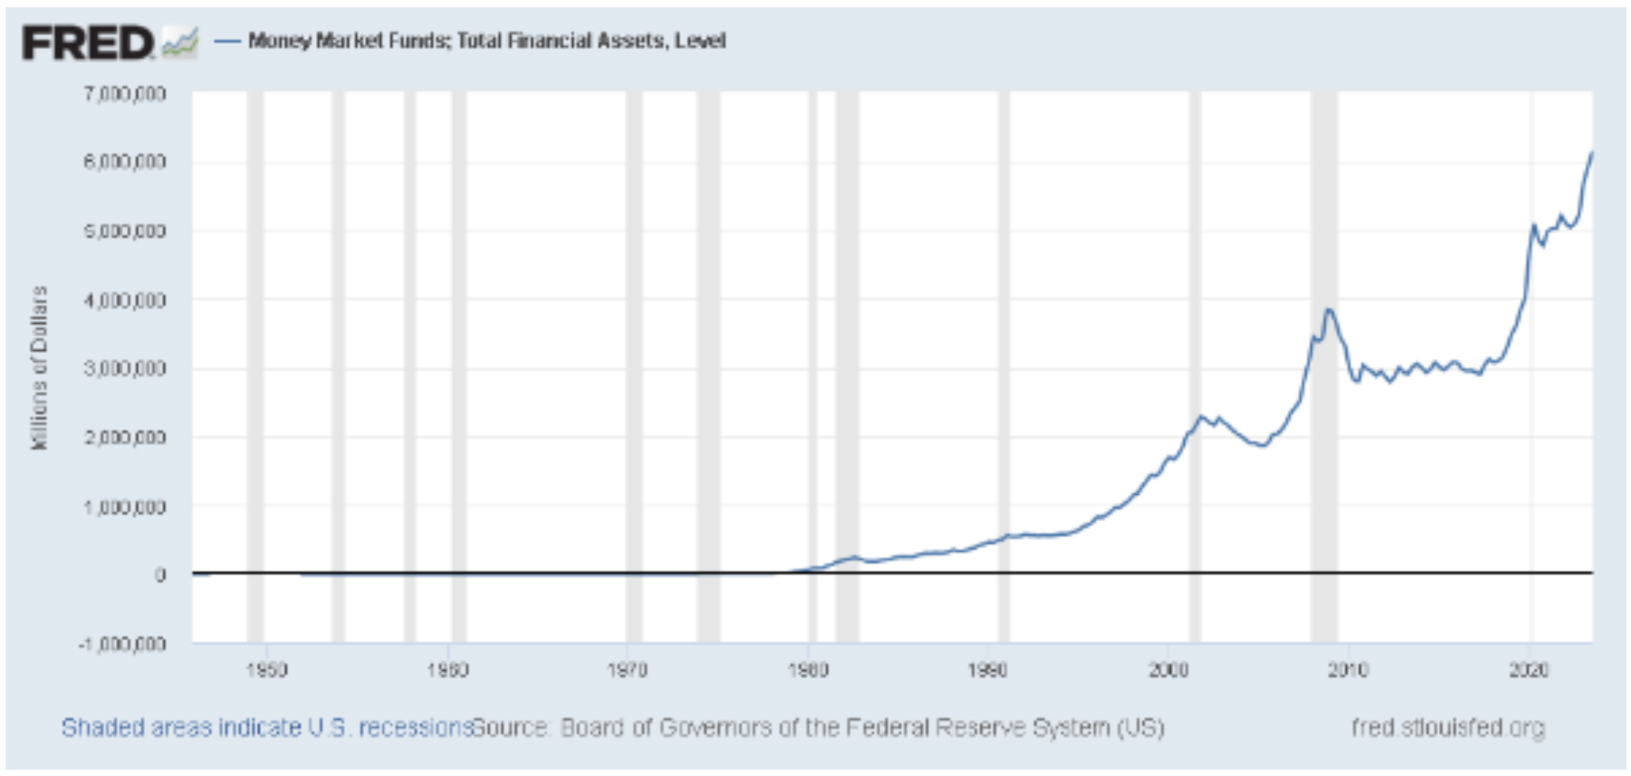
Graphs are for illustrative and discussion purposes only. Please read important disclosures at the end of this commentary.
There may be a short-term (much warranted) pullback, but history indicates that if you sell, you could miss big gains. I believe the winds are finally at our backs. A century of history tells us to bet on stocks.
“History is a guide to navigation in perilous times. History is who we are and why we are the way we are.”
–Historian David McCullough
All content above represents the opinion of Jason Bodner of Navellier & Associates, Inc.
Also In This Issue
A Look Ahead by Louis Navellier
Chairman Powell Confirms That Inflation is Near His Target 2%
Income Mail by Bryan Perry
New Bull Market for Regional Banks? Not So Fast
Growth Mail by Gary Alexander
My 10 Best Books of 2023 (Christmas Gift Ideas)
Global Mail by Ivan Martchev
Fed Chair Jerome Powell Goes Full Circle
Sector Spotlight by Jason Bodner
Long (and Super-Short) Cycles in Nature and in Markets
View Full Archive
Read Past Issues Here

Jason Bodner
MARKETMAIL EDITOR FOR SECTOR SPOTLIGHT
Jason Bodner writes Sector Spotlight in the weekly Marketmail publication and has authored several white papers for the company. He is also Co-Founder of Macro Analytics for Professionals which produces proprietary equity accumulation/distribution research for its clients. Previously, Mr. Bodner served as Director of European Equity Derivatives for Cantor Fitzgerald Europe in London, then moved to the role of Head of Equity Derivatives North America for the same company in New York. He also served as S.V.P. Equity Derivatives for Jefferies, LLC. He received a B.S. in business administration in 1996, with honors, from Skidmore College as a member of the Periclean Honors Society. All content of “Sector Spotlight” represents the opinion of Jason Bodner
Important Disclosures:
Jason Bodner is a co-founder and co-owner of Mapsignals. Mr. Bodner is an independent contractor who is occasionally hired by Navellier & Associates to write an article and or provide opinions for possible use in articles that appear in Navellier & Associates weekly Market Mail. Mr. Bodner is not employed or affiliated with Louis Navellier, Navellier & Associates, Inc., or any other Navellier owned entity. The opinions and statements made here are those of Mr. Bodner and not necessarily those of any other persons or entities. This is not an endorsement, or solicitation or testimonial or investment advice regarding the BMI Index or any statements or recommendations or analysis in the article or the BMI Index or Mapsignals or its products or strategies.
Although information in these reports has been obtained from and is based upon sources that Navellier believes to be reliable, Navellier does not guarantee its accuracy and it may be incomplete or condensed. All opinions and estimates constitute Navellier’s judgment as of the date the report was created and are subject to change without notice. These reports are for informational purposes only and are not a solicitation for the purchase or sale of a security. Any decision to purchase securities mentioned in these reports must take into account existing public information on such securities or any registered prospectus.To the extent permitted by law, neither Navellier & Associates, Inc., nor any of its affiliates, agents, or service providers assumes any liability or responsibility nor owes any duty of care for any consequences of any person acting or refraining to act in reliance on the information contained in this communication or for any decision based on it.
Past performance is no indication of future results. Investment in securities involves significant risk and has the potential for partial or complete loss of funds invested. It should not be assumed that any securities recommendations made by Navellier. in the future will be profitable or equal the performance of securities made in this report. Dividend payments are not guaranteed. The amount of a dividend payment, if any, can vary over time and issuers may reduce dividends paid on securities in the event of a recession or adverse event affecting a specific industry or issuer.
None of the stock information, data, and company information presented herein constitutes a recommendation by Navellier or a solicitation to buy or sell any securities. Any specific securities identified and described do not represent all of the securities purchased, sold, or recommended for advisory clients. The holdings identified do not represent all of the securities purchased, sold, or recommended for advisory clients and the reader should not assume that investments in the securities identified and discussed were or will be profitable.
Information presented is general information that does not take into account your individual circumstances, financial situation, or needs, nor does it present a personalized recommendation to you. Individual stocks presented may not be suitable for every investor. Investment in securities involves significant risk and has the potential for partial or complete loss of funds invested. Investment in fixed income securities has the potential for the investment return and principal value of an investment to fluctuate so that an investor’s holdings, when redeemed, may be worth less than their original cost.
One cannot invest directly in an index. Index is unmanaged and index performance does not reflect deduction of fees, expenses, or taxes. Presentation of Index data does not reflect a belief by Navellier that any stock index constitutes an investment alternative to any Navellier equity strategy or is necessarily comparable to such strategies. Among the most important differences between the Indices and Navellier strategies are that the Navellier equity strategies may (1) incur material management fees, (2) concentrate its investments in relatively few stocks, industries, or sectors, (3) have significantly greater trading activity and related costs, and (4) be significantly more or less volatile than the Indices.
ETF Risk: We may invest in exchange traded funds (“ETFs”) and some of our investment strategies are generally fully invested in ETFs. Like traditional mutual funds, ETFs charge asset-based fees, but they generally do not charge initial sales charges or redemption fees and investors typically pay only customary brokerage fees to buy and sell ETF shares. The fees and costs charged by ETFs held in client accounts will not be deducted from the compensation the client pays Navellier. ETF prices can fluctuate up or down, and a client account could lose money investing in an ETF if the prices of the securities owned by the ETF go down. ETFs are subject to additional risks:
- ETF shares may trade above or below their net asset value;
- An active trading market for an ETF’s shares may not develop or be maintained;
- The value of an ETF may be more volatile than the underlying portfolio of securities the ETF is designed to track;
- The cost of owning shares of the ETF may exceed those a client would incur by directly investing in the underlying securities; and
- Trading of an ETF’s shares may be halted if the listing exchange’s officials deem it appropriate, the shares are delisted from the exchange, or the activation of market-wide “circuit breakers” (which are tied to large decreases in stock prices) halts stock trading generally.
Grader Disclosures: Investment in equity strategies involves substantial risk and has the potential for partial or complete loss of funds invested. The sample portfolio and any accompanying charts are for informational purposes only and are not to be construed as a solicitation to buy or sell any financial instrument and should not be relied upon as the sole factor in an investment making decision. As a matter of normal and important disclosures to you, as a potential investor, please consider the following: The performance presented is not based on any actual securities trading, portfolio, or accounts, and the reported performance of the A, B, C, D, and F portfolios (collectively the “model portfolios”) should be considered mere “paper” or pro forma performance results based on Navellier’s research.
Investors evaluating any of Navellier & Associates, Inc.’s, (or its affiliates’) Investment Products must not use any information presented here, including the performance figures of the model portfolios, in their evaluation of any Navellier Investment Products. Navellier Investment Products include the firm’s mutual funds and managed accounts. The model portfolios, charts, and other information presented do not represent actual funded trades and are not actual funded portfolios. There are material differences between Navellier Investment Products’ portfolios and the model portfolios, research, and performance figures presented here. The model portfolios and the research results (1) may contain stocks or ETFs that are illiquid and difficult to trade; (2) may contain stock or ETF holdings materially different from actual funded Navellier Investment Product portfolios; (3) include the reinvestment of all dividends and other earnings, estimated trading costs, commissions, or management fees; and, (4) may not reflect prices obtained in an actual funded Navellier Investment Product portfolio. For these and other reasons, the reported performances of model portfolios do not reflect the performance results of Navellier’s actually funded and traded Investment Products. In most cases, Navellier’s Investment Products have materially lower performance results than the performances of the model portfolios presented.
This report contains statements that are, or may be considered to be, forward-looking statements. All statements that are not historical facts, including statements about our beliefs or expectations, are “forward-looking statements” within the meaning of The U.S. Private Securities Litigation Reform Act of 1995. These statements may be identified by such forward-looking terminology as “expect,” “estimate,” “plan,” “intend,” “believe,” “anticipate,” “may,” “will,” “should,” “could,” “continue,” “project,” or similar statements or variations of such terms. Our forward-looking statements are based on a series of expectations, assumptions, and projections, are not guarantees of future results or performance, and involve substantial risks and uncertainty as described in Form ADV Part 2A of our filing with the Securities and Exchange Commission (SEC), which is available at www.adviserinfo.sec.gov or by requesting a copy by emailing info@navellier.com. All of our forward-looking statements are as of the date of this report only. We can give no assurance that such expectations or forward-looking statements will prove to be correct. Actual results may differ materially. You are urged to carefully consider all such factors.
FEDERAL TAX ADVICE DISCLAIMER: As required by U.S. Treasury Regulations, you are informed that, to the extent this presentation includes any federal tax advice, the presentation is not written by Navellier to be used, and cannot be used, for the purpose of avoiding federal tax penalties. Navellier does not advise on any income tax requirements or issues. Use of any information presented by Navellier is for general information only and does not represent tax advice either express or implied. You are encouraged to seek professional tax advice for income tax questions and assistance.
IMPORTANT NEWSLETTER DISCLOSURE:The hypothetical performance results for investment newsletters that are authored or edited by Louis Navellier, including Louis Navellier’s Growth Investor, Louis Navellier’s Breakthrough Stocks, Louis Navellier’s Accelerated Profits, and Louis Navellier’s Platinum Club, are not based on any actual securities trading, portfolio, or accounts, and the newsletters’ reported hypothetical performances should be considered mere “paper” or proforma hypothetical performance results and are not actual performance of real world trades. Navellier & Associates, Inc. does not have any relation to or affiliation with the owner of these newsletters. There are material differences between Navellier Investment Products’ portfolios and the InvestorPlace Media, LLC newsletter portfolios authored by Louis Navellier. The InvestorPlace Media, LLC newsletters contain hypothetical performance that do not include transaction costs, advisory fees, or other fees a client might incur if actual investments and trades were being made by an investor. As a result, newsletter performance should not be used to evaluate Navellier Investment services which are separate and different from the newsletters. The owner of the newsletters is InvestorPlace Media, LLC and any questions concerning the newsletters, including any newsletter advertising or hypothetical Newsletter performance claims, (which are calculated solely by Investor Place Media and not Navellier) should be referred to InvestorPlace Media, LLC at (800) 718-8289.
Please note that Navellier & Associates and the Navellier Private Client Group are managed completely independent of the newsletters owned and published by InvestorPlace Media, LLC and written and edited by Louis Navellier, and investment performance of the newsletters should in no way be considered indicative of potential future investment performance for any Navellier & Associates separately managed account portfolio. Potential investors should consult with their financial advisor before investing in any Navellier Investment Product.
Navellier claims compliance with Global Investment Performance Standards (GIPS). To receive a complete list and descriptions of Navellier’s composites and/or a presentation that adheres to the GIPS standards, please contact Navellier or click here. It should not be assumed that any securities recommendations made by Navellier & Associates, Inc. in the future will be profitable or equal the performance of securities made in this report.
FactSet Disclosure: Navellier does not independently calculate the statistical information included in the attached report. The calculation and the information are provided by FactSet, a company not related to Navellier. Although information contained in the report has been obtained from FactSet and is based on sources Navellier believes to be reliable, Navellier does not guarantee its accuracy, and it may be incomplete or condensed. The report and the related FactSet sourced information are provided on an “as is” basis. The user assumes the entire risk of any use made of this information. Investors should consider the report as only a single factor in making their investment decision. The report is for informational purposes only and is not intended as an offer or solicitation for the purchase or sale of a security. FactSet sourced information is the exclusive property of FactSet. Without prior written permission of FactSet, this information may not be reproduced, disseminated or used to create any financial products. All indices are unmanaged and performance of the indices include reinvestment of dividends and interest income, unless otherwise noted, are not illustrative of any particular investment and an investment cannot be made in any index. Past performance is no guarantee of future results.