
by Gary Alexander
November 3, 2026
Today marks a focus of two strong trends: (1) The old “Sell in May and Go Away” still holds, but you must also “Remember to reinvest in November” if you follow that trading strategy; and (2) Election Day in midterm election years marks the start of the most phenomenal returns of the four-year political cycle.
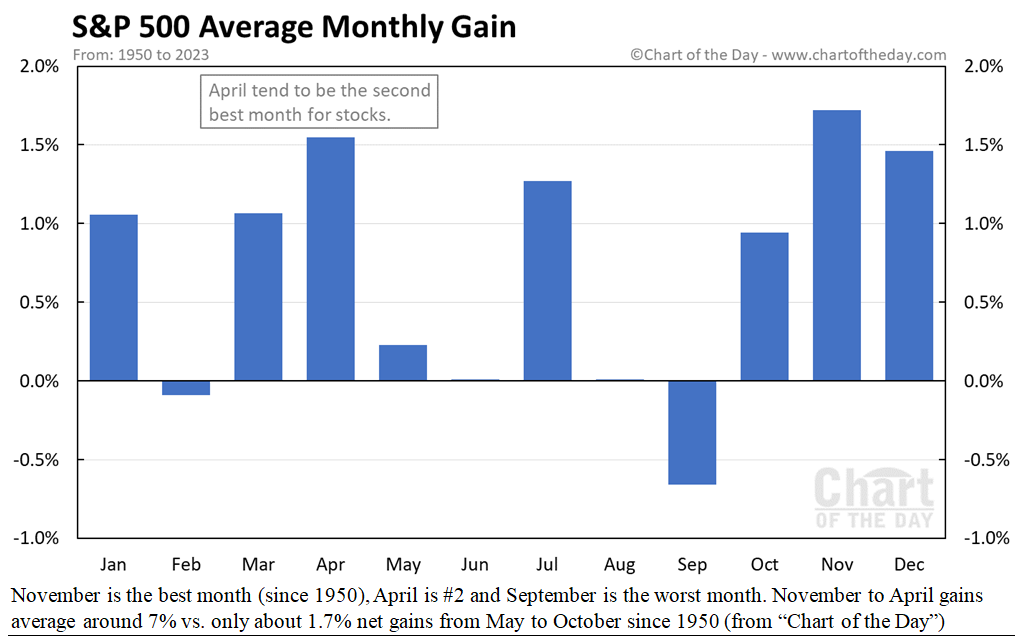
The political cycle is more logical than “Sell in May,” but let’s dispense with that indicator first. We don’t agree with any trading pattern of such a short (six-month) duration, but selling stocks in May and buying them back in November is based on the fact that since 1950, the best six-months for the S&P 500 have been from November 1 to April 30, with May 1 to October 31 coming in way below par. Furthermore, if you go by single months, November is the best month in the year and it also marks the start of the best three-months (November 1 through January 31), and six-months so this week is screaming, “buy stocks.”
Graphs are for illustrative and discussion purposes only. Please read important disclosures at the end of this commentary.
Put in weather terms, the market tends to be HOT in the colder months, and colder in the warmer months.
Like most retrofit formulas, this one worked far better in the distant past than recently, but in the last 29-years (1998 to 2026), which I just charted, the six months from November 1 to April 30 averaged nearly 10% (+9.6%), while the six-months from May to October averaged just 2.1%. Furthermore, the midterm election years in that span (1998, 2002, 2006, 2010, 2014, 2018, 2022 and 2026) matched that trend.
Now, let’s focus on the issue at hand – today’s elections. I don’t take political sides, but I have often written that “gridlock” (one party in the White House, the other dominating Congress) is better for the nation and for markets. The four-year Presidential cycle is basically the only timing device that holds water over time, and for a very logical reason. We voters like to feel we are in charge. Whether our vote really changes Congressional behavior (it doesn’t), we like to feel we are commanding the ship of state.
Overall, the midterm election year is the worst year of the four-year Presidential cycle, but all the blame for that comes from the first three-quarters of midterm election years, the worst nine-month stretch of the cycle. The next nine-months are the best of times, so this week is when we move from the worst of times to best of times. Here’s the historical record since the S&P 500 became a common market metric in 1950.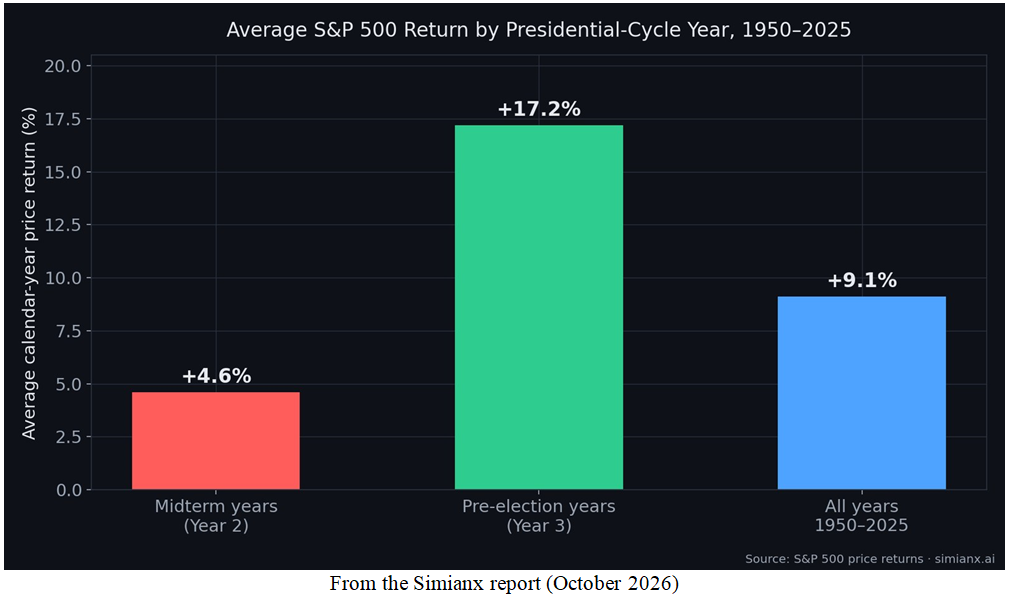
Graphs are for illustrative and discussion purposes only. Please read important disclosures at the end of this commentary.
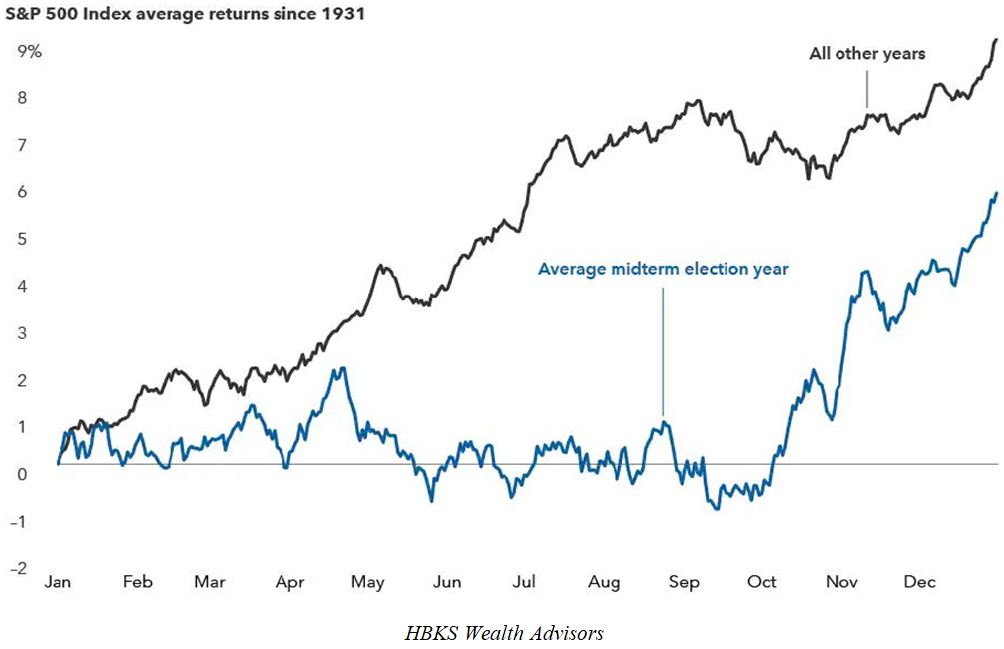
But that’s only half the story. If you look at the annual pattern of midterm election years, the entire 4.6% gain comes in the final-quarter. Check out the blue line’s rapid ascent in the far right of the next chart:
Graphs are for illustrative and discussion purposes only. Please read important disclosures at the end of this commentary.
Not convinced yet? Consider this. Since 1950, there have been 19-midterm elections, and stocks have gone up the following nine-months and 12-months every time: 19 of 19. Taking the midterm election day as the starting point, the average 12-month gain in those cycles was +15.1% (the median was +14.5%).
The last (2022) midterm election year came in at +14.5%, and it gets better in the nine-month period (from September 30 to June 30): The 2018 cycle gained 29.2%, and the 2022 rally came in at 24.2%. That trend is constant: The nine-months from September 30 in a midterm election year to June 30 in the next year up by a 20.1% average for the nine-months (three-quarters) since 1950, with no losing periods.
In the last two-cycles, we saw phenomenal 9-month post-election returns in the S&P in 2019 and 2023:
- In 2019, the S&P 500 gained 30.4% in price and 33.1% total return with dividends reinvested.
- In 2023, the S&P 500 gained 24.3% in price and 26.3% total return with dividends reinvested.
In summarizing the last 19-election cycles in the 76-years since 1950:
- In the 12-months after each of the 19 midterms since 1950, the S&P 500 rose every time, by an average 18.2% (median: 18.0%), not counting dividends, which raised returns to over 20%.
- A typical 12-month period in all years only gained 8.8% on average, half the third-year gains.
- Even the weakest third years of the cycle were positive: The worst was 1986-87 up 1.1%, despite the crash of 1987, and the second-worst year came after the 2010 midterms, but it was up 3%.
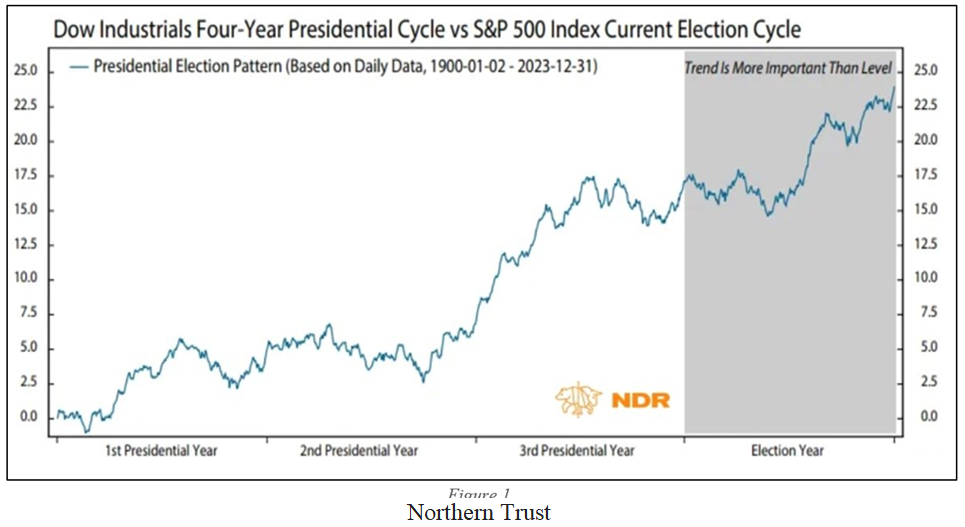
The same trend is evident in the Dow Industrials going back 125-years:
Graphs are for illustrative and discussion purposes only. Please read important disclosures at the end of this commentary.
So, after you vote, or watch election returns tonight, spend a few bucks on some great stocks this week.
All content above represents the opinion of Gary Alexander of Navellier & Associates, Inc.
Also In This Issue
A Look Ahead by Louis Navellier
Expect a Fractured G-20 Meeting in Florida Next Month
Income Mail by Bryan Perry
Using Energy Options to Take “Implied Market Volatility” to the Bank
Growth Mail by Gary Alexander
Today May Be the Best Day to Invest in the Post-Election Surge
Global Mail by Ivan Martchev
A Stock Market Bottom is Likely Within Reach
Sector Spotlight by Jason Bodner
Doubting the Future is Popular – But Not Very Profitable
Important Disclosures:
Although information in these reports has been obtained from and is based upon sources that Navellier believes to be reliable, Navellier does not guarantee its accuracy and it may be incomplete or condensed. All opinions and estimates constitute the authors opinions as of the date the report was created and are subject to change without notice. These reports are for informational purposes only and are not a solicitation for the purchase or sale of any securities or financial services. Any decision to purchase securities mentioned in these reports must take into account existing public information on such securities or any registered prospectus. To the extent permitted by law, neither Navellier & Associates, Inc., nor any of its affiliates, agents, or service providers are providing any investment advice herein and do not assume any liability or responsibility for the readers’ decisions if any. No reader should act or refrain from acting in reliance on the information contained in this communication or for any decision based on it.
None of the stock information, data, or company information presented herein constitutes investment advice or a recommendation by Navellier or a solicitation to buy or sell any securities. Any specific securities identified and described herein do not represent any investment advice.
Information presented is general information that does not take into account your individual circumstances, financial situation, or needs, nor does it present a personalized recommendation to you. Individual stocks presented may not be suitable for every investor. Investment in securities involves significant risk and has the potential for partial or complete loss of funds invested. Investment in fixed income securities has the potential for the investment return and principal value of an investment to fluctuate so that an investor’s holdings, when redeemed, may be worth less than their original cost.
- This report contains statements that are, or may be considered to be, forward-looking statements. All statements that are not historical facts, including statements about our beliefs or expectations, are “forward-looking statements” within the meaning of The U.S. Private Securities Litigation Reform Act of 1995. These statements may be identified by such forward-looking terminology as “expect,” “estimate,” “plan,” “intend,” “believe,” “anticipate,” “may,” “will,” “should,” “could,” “continue,” “project,” or similar statements or variations of such terms. Our forward-looking statements are based on a series of expectations, assumptions, and projections, are not investment advice. All of our forward-looking statements are as of the date of this report only.
- Federal Tax Advice Disclaimer: As required by U.S. Treasury Regulations, you are informed that, to the extent this presentation mentions any federal taxes, Navellier is not presenting any tax advice and should not be used or relied on as tax advice. Navellier does not advise on any income tax requirements or issues. Use of any information presented by Navellier is for general information only and does not represent tax advice either express or implied. You are encouraged to seek professional tax advice for income tax questions and assistance.
- FactSet Disclosure: Navellier does not independently calculate the statistical information included in the attached report. The calculation and the information are provided by FactSet, a company not related to Navellier. Although information contained in the report has been obtained from FactSet and is based on sources Navellier believes to be reliable, Navellier does not guarantee its accuracy, and it may be inaccurate, incomplete or condensed. The report and the related FactSet sourced information is for general information purposes only.