by Bryan Perry
November 21, 2023
Investors would be hard pressed to find an experienced market technical analyst that doesn’t think the major averages are “pegged” at current levels – that is, hovering in extremely overbought territory and due for at least a short period of consolidation. This poses a quandary in that the FOMO (Fear of Missing Out) crowd missed the 10% run up in the S&P 500, and they believe the Fed’s next move will be to cut the Fed Funds rate, and the history of year-end seasonality supports this bullish upside move continuing.
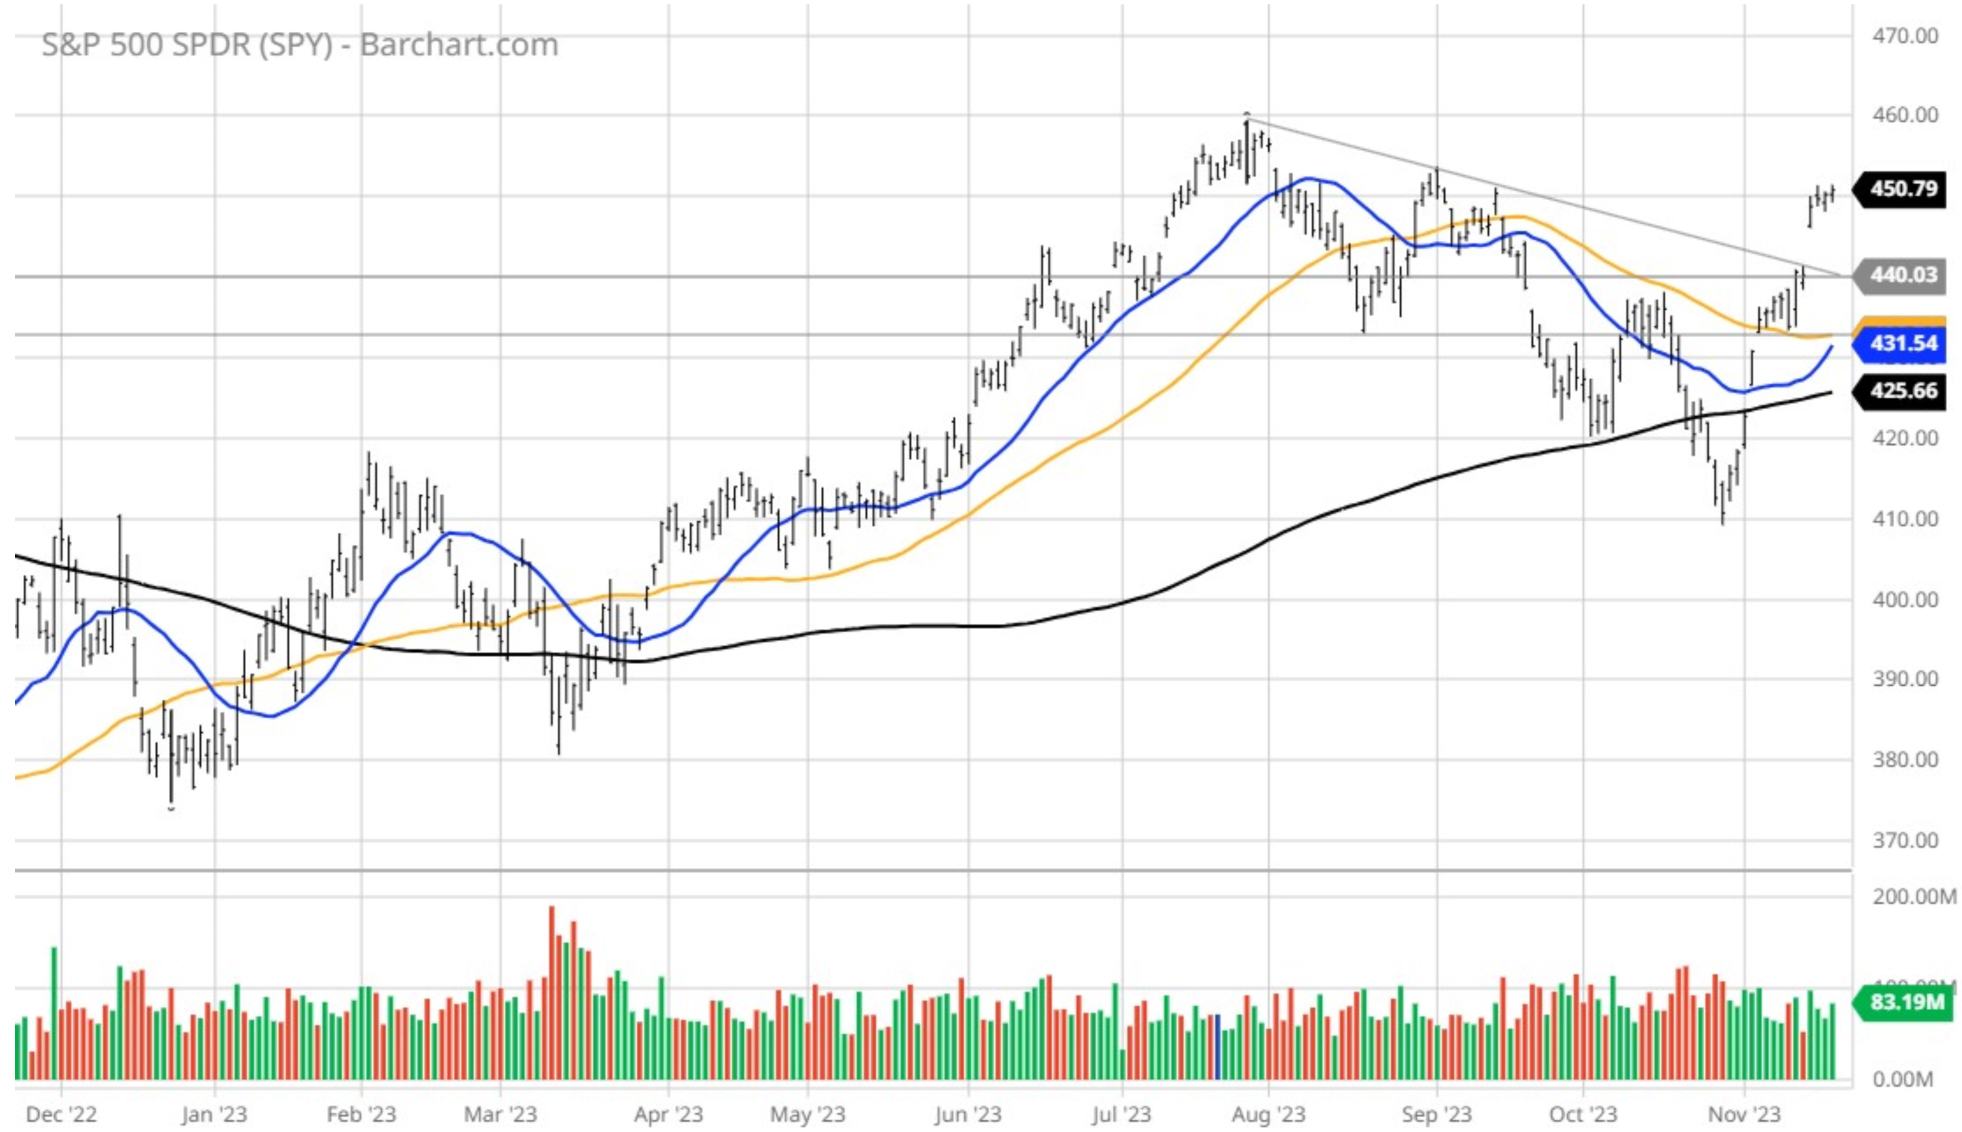
The one-year chart of the S&P 500 (below) shows the index roaring up 400 points, from 4100 to 4500 in three weeks, now 150 points above its 50-day moving average (yellow line) with the 20-day moving average (blue line) just underneath, and both turning higher. Connecting the tops of the previous rally attempts, it is clear that when the SPY broke above 4400 in dramatic fashion, it was game on for the bulls.
Graphs are for illustrative and discussion purposes only. Please read important disclosures at the end of this commentary.
This torrid rally created some clear gaps, which market technicians would contend must be filled to bring structure to what looks to be a new primary uptrend, following three months of intense consolidation. A pullback to 4400 is a reasonable assumption that qualifies as a “pause that refreshes,” with a full 50% retracement to 4350 a possibility – but much less likely – given the appetite to go long equities.
It’s interesting that while the Dow, S&P and Nasdaq are all trading squarely above their respective 200-day moving averages, Wall Street and the financial media are jumping for joy about the belated move in the Russell 2000, which, in my view, was the mother of all short-squeezes, with questionable fundamentals to support the move. (For some background, the largest subsector in the Russell 2000 is Financials (23%) followed by Health Technology (11%) and Technology Services (10%) as the third highest weighting.)
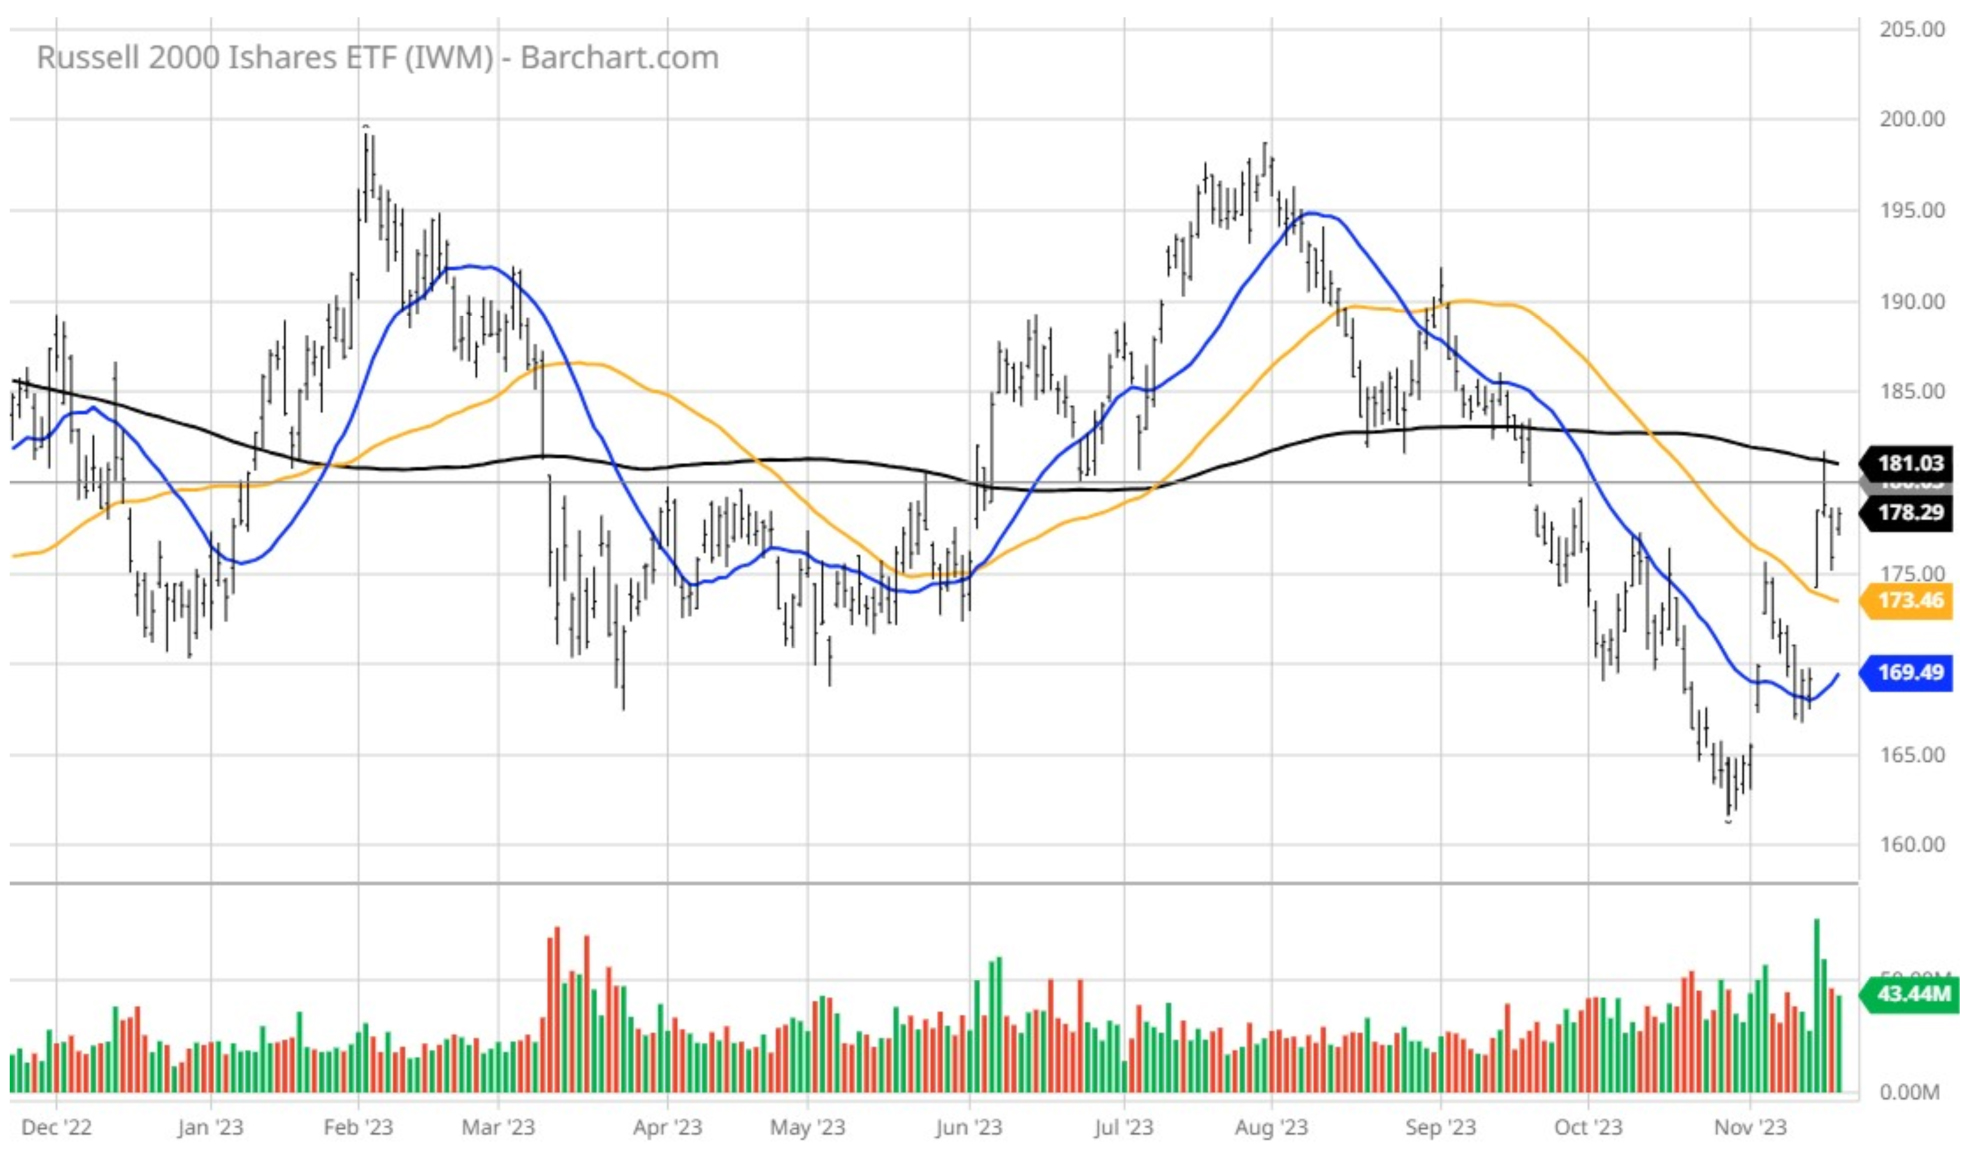
Shares of the Russell 2000 iShares ETF (IWM) show the index putting in a massive reversal, again on overwhelming short-covering, and trading up to its 200-day moving average (black line) where it slammed into overhead technical resistance and then backed off. For this index to truly break out to the upside, it will require a broad recovery of the small to medium-sized banks, and that’s a tall order.
Graphs are for illustrative and discussion purposes only. Please read important disclosures at the end of this commentary.
For this rally to be confirmed as more than just another Magnificent Seven (top tech stock) breakout, it will require broad market participation, some of which is genuinely taking place in other sectors.
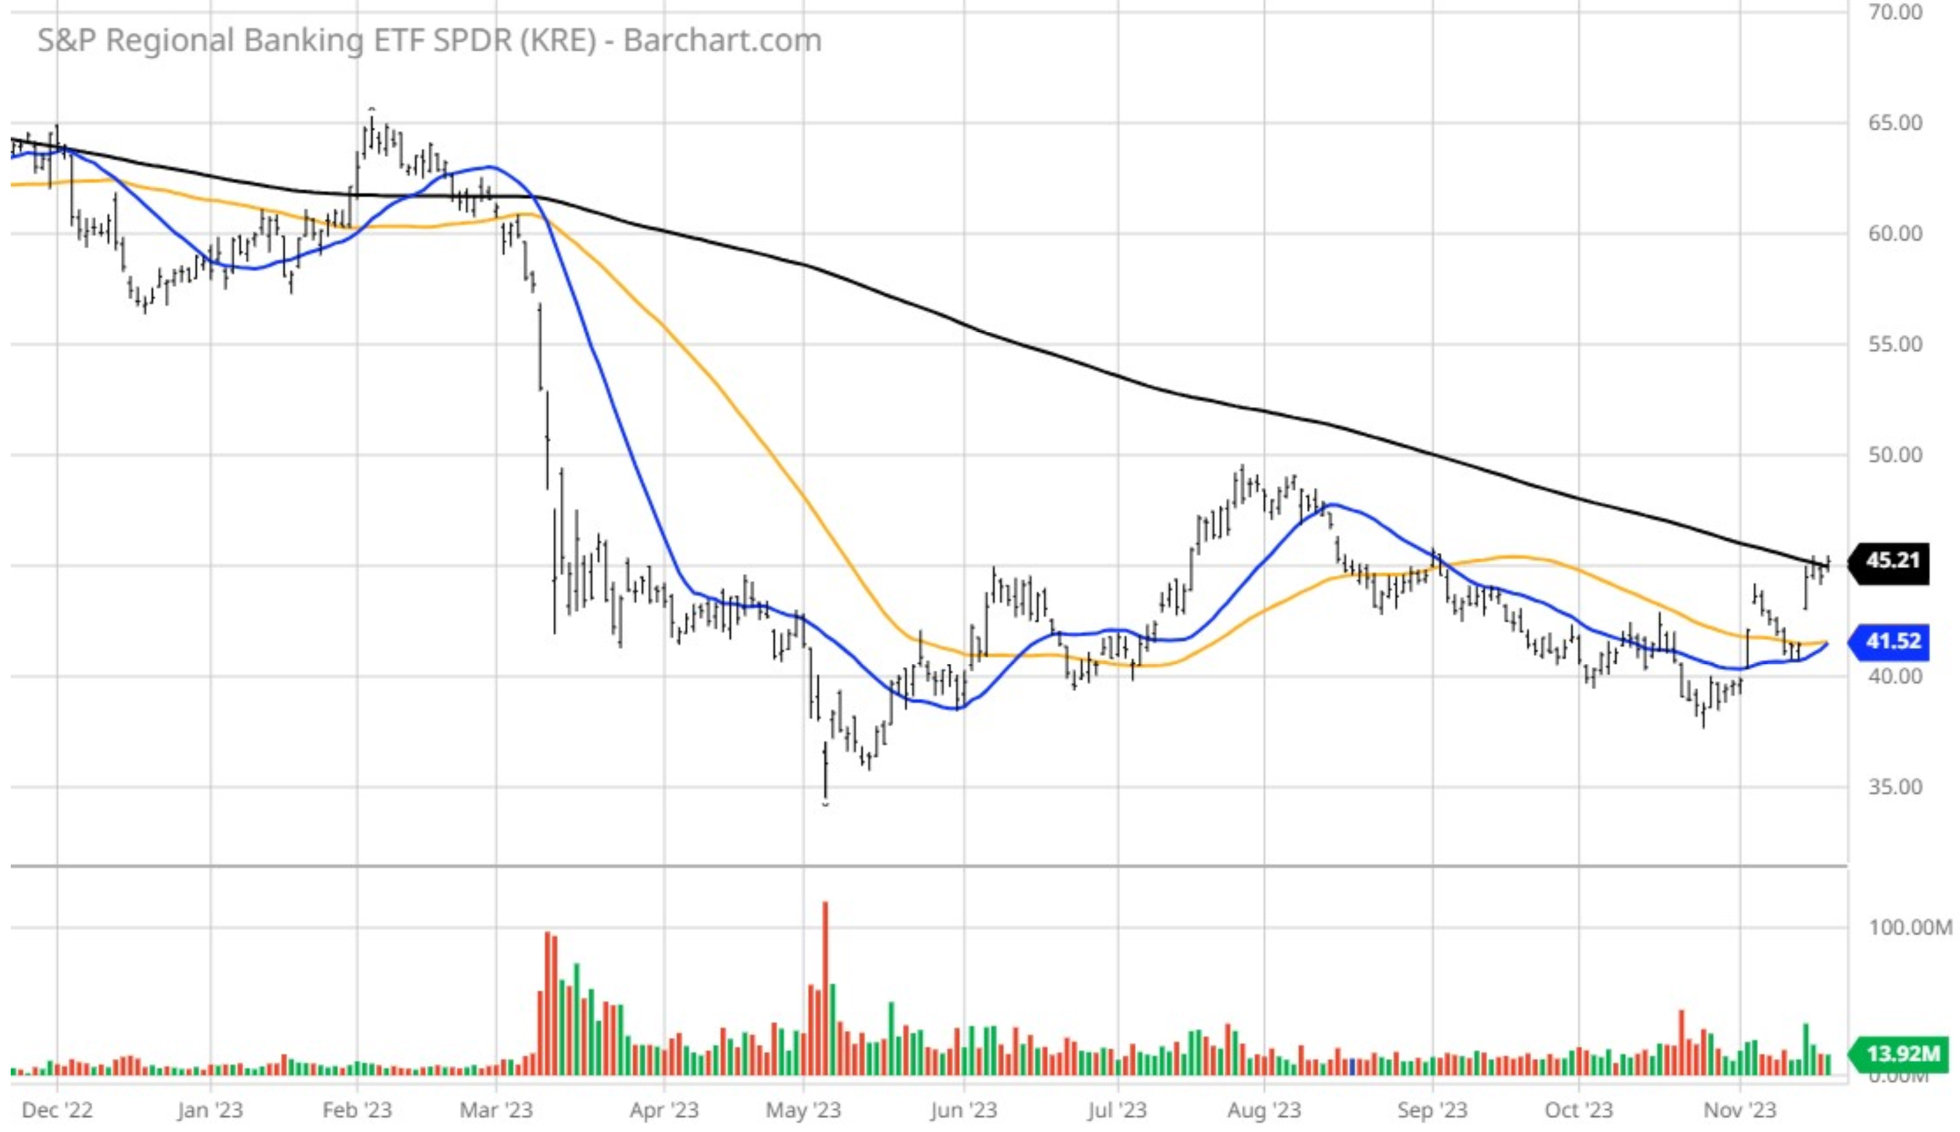
It stands to reason that a sustainable rally will involve some much-needed repair in the banking sector. Drilling down a bit more, we need look no further than the regional banks. Shares of the S&P Regional Banking SPDR ETF (KRE) show this subsector trading right back up to its downward sloping 200-day moving average, following nearly nine months of consolidation from the spring meltdown.
Graphs are for illustrative and discussion purposes only. Please read important disclosures at the end of this commentary.
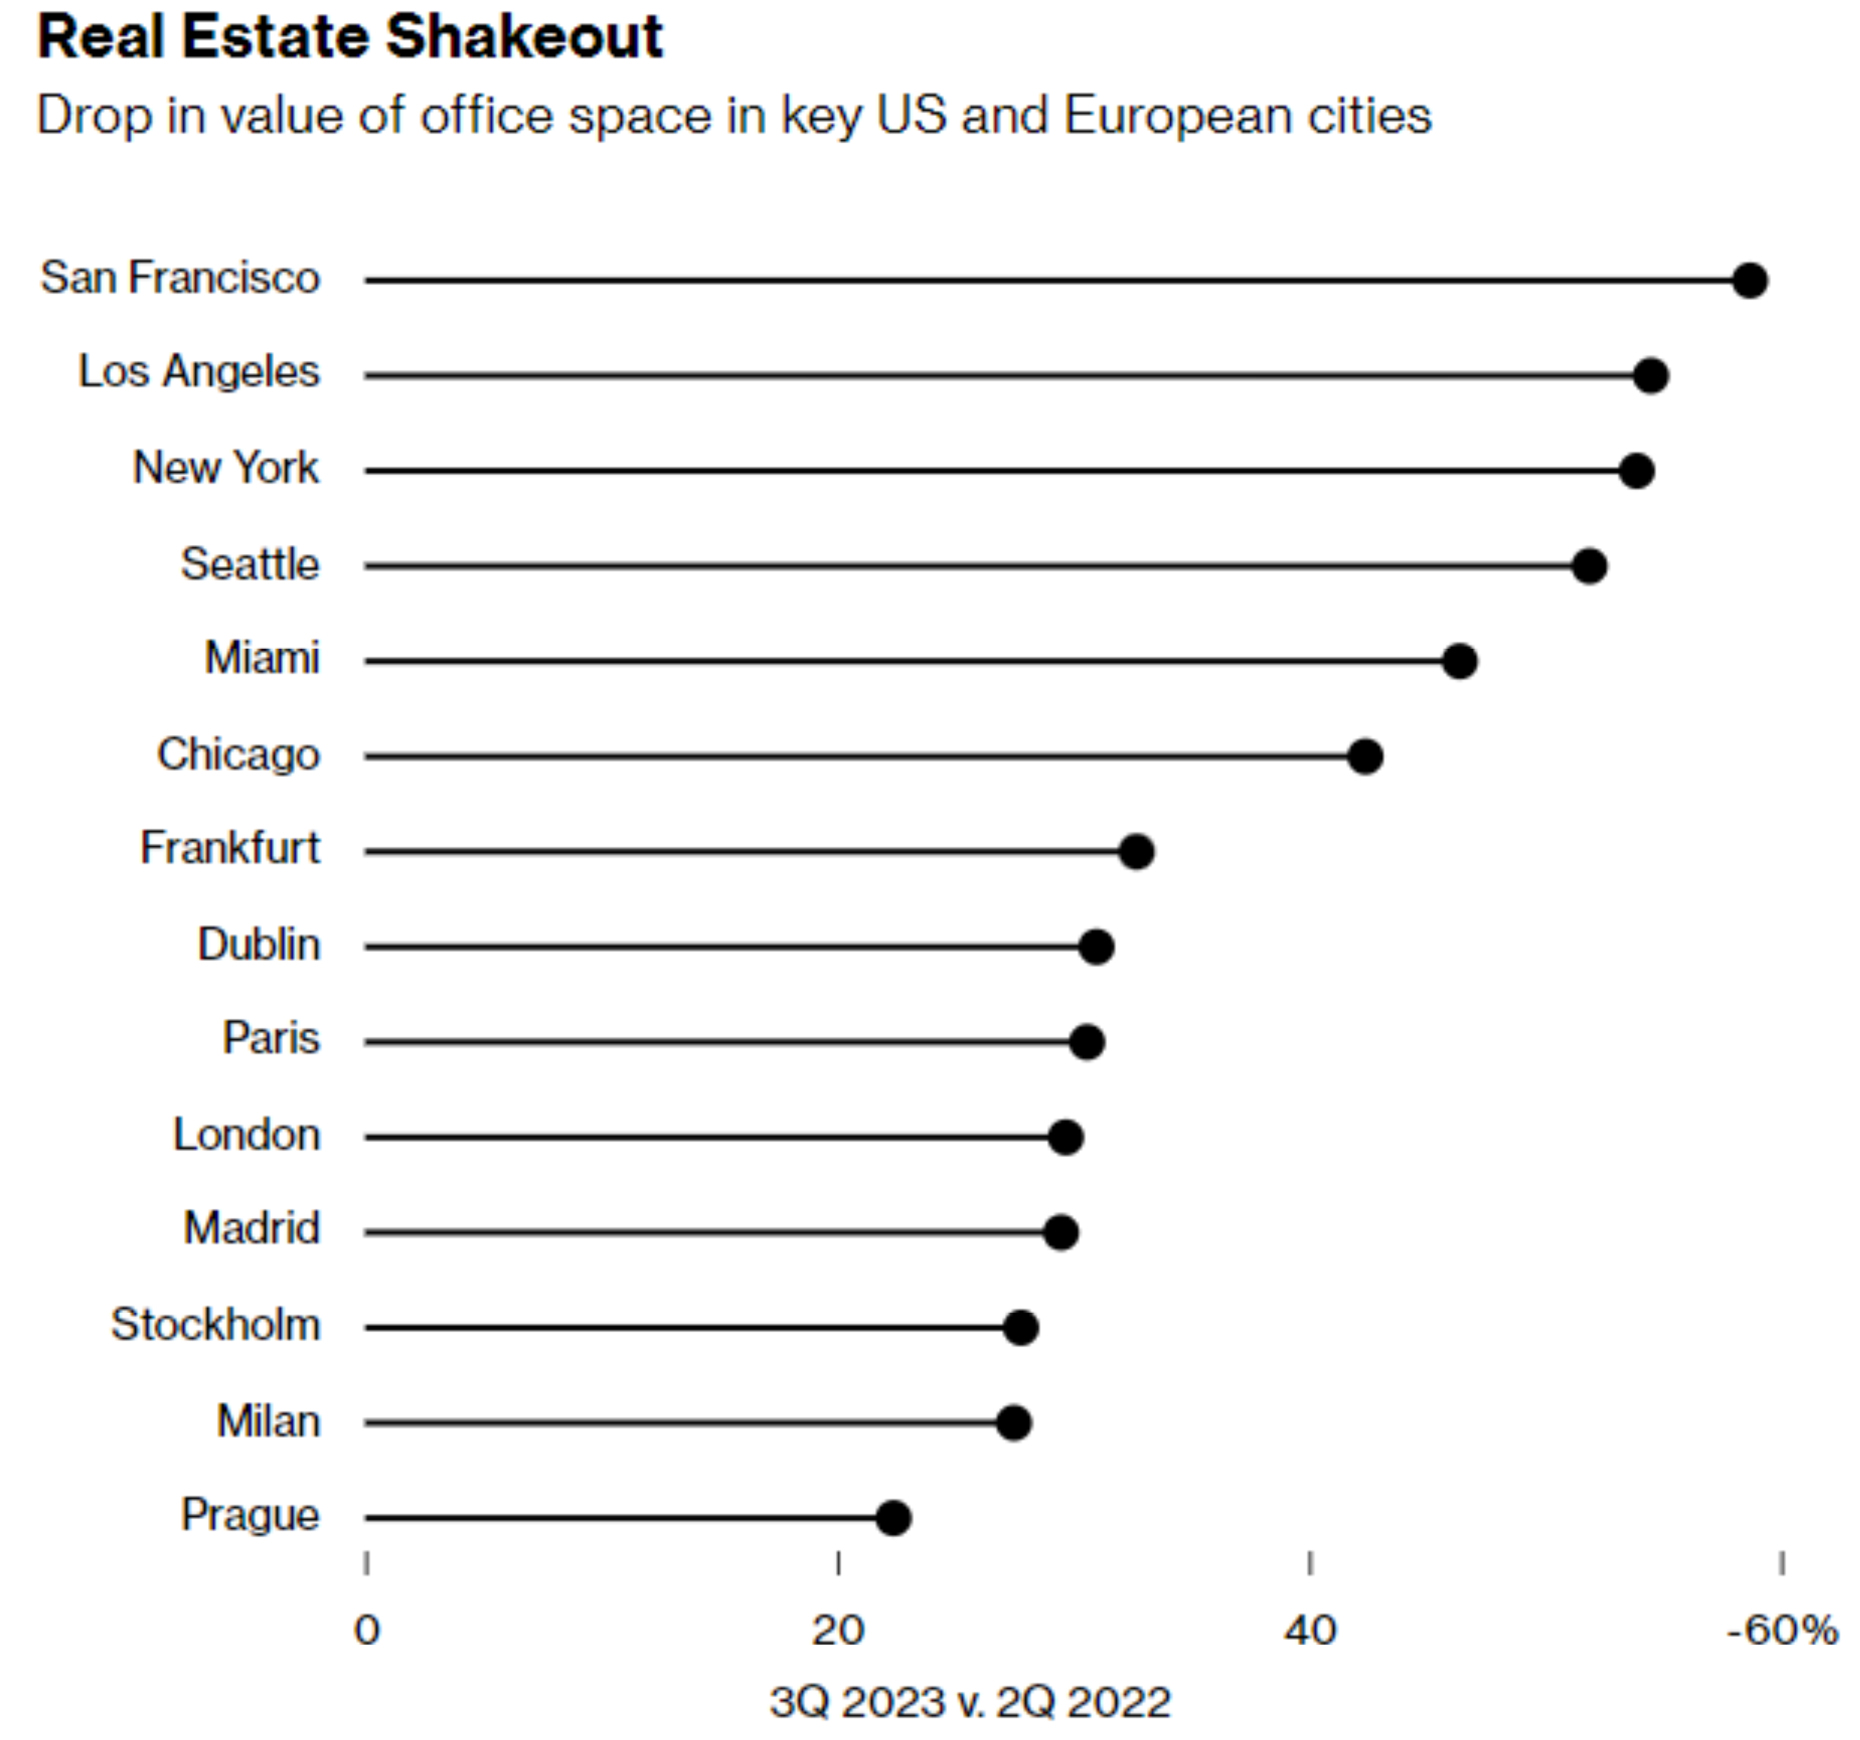
There is legitimate concern about the ongoing risk leverage ownership of sub-2% Treasuries on the books, as well as commercial real estate exposure and the ability to refinance semi-vacant properties with dramatically reduced valuations in a considerably higher environment for commercial mortgages.
The math simply doesn’t work. According to Bloomberg, “The value of distressed U.S. commercial real estate neared $80 billion in the third quarter, its highest level in a decade, as rising interest rates and sagging office demand shook the property market.” And this $80 billion figure pales in comparison to what’s on the horizon. “Those depressed prices make it harder for the industry to refinance the $2.2 trillion of U.S. and European commercial property loans due to mature by the end of 2025.”
For now, it seems this whale-sized problem is of no concern to market participants. Neither is the latest negative outlook by Moody’s regarding the now $34 trillion in federal debt, nor the war in Gaza or the potential of more stress from future Treasury auctions to finance our ever-rising national debt.
Graphs are for illustrative and discussion purposes only. Please read important disclosures at the end of this commentary.
At present, market sentiment is galvanized on the rally in bonds and the perceived surety of a coming Fed “pivot,” with over $5 trillion sitting on the sidelines as potential powder for further market gains. Whether the market does in fact provide the desired pullback of, say, 5%, it will probably be a function of further data that shows the consumer tightening spending into the all-important holiday shopping season.
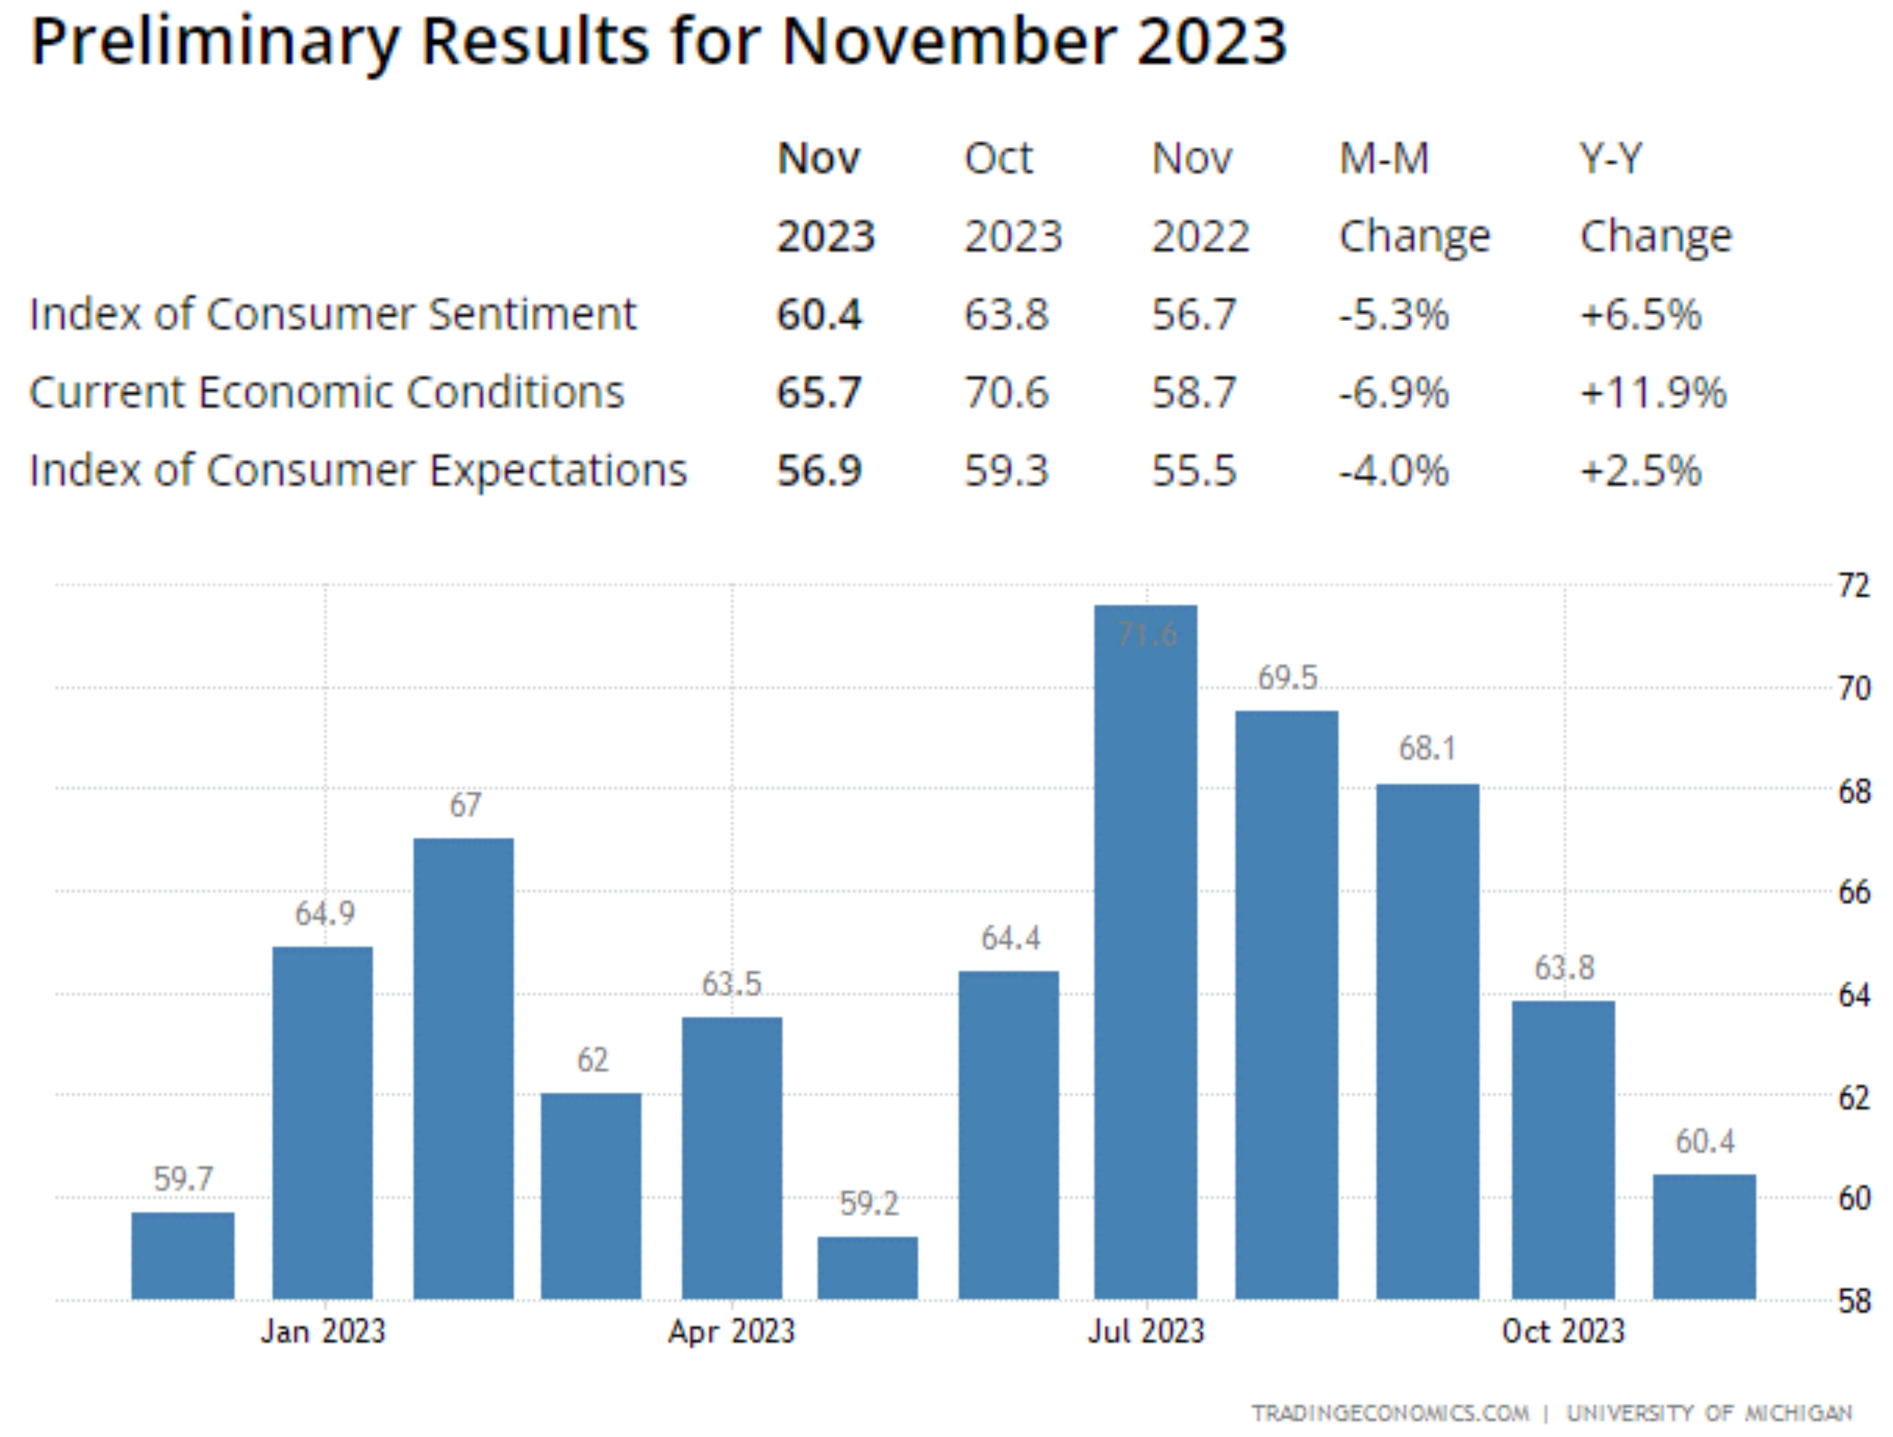
The latest read on consumers from the University of Michigan survey, showed a fourth straight month of declines for sentiment. This might change for the better with gas prices retreating. In addition, numbers from Black Friday will be out this coming weekend, to add some data. Most weakness in the sentiment poll reflects lower income and millennial spenders that are now having to service student loans again, but those with stock and bond portfolios seem to still be spending freely on discretionary goods and services.
Graphs are for illustrative and discussion purposes only. Please read important disclosures at the end of this commentary.
Will investors get their shot at buying the market at a lower level? That’s a hard call. It is rare when a big gap underneath the S&P 500 isn’t filled at some point. It could come soon, or in early January. Just keep an eye on the Russell 2000, the Regional Bank Index, retail sales data and upcoming Treasury auctions.
Most of the eleven S&P market sectors are seeing marked improvement in their respective charts, but again, everything bounced hard on the notion that inflation and interest rates have peaked, and are heading lower.’
A period of digestion over the next couple of weeks would be very constructive to resolve the current overbought market conditions, while affording underinvested investors a chance to leg into equities on a meaningful dip. Whether Mr. Market provides that Christmas gift is another thing. After all, Wall Street’s version of Santa Claus has been known to deliver a hint of Ebenezer Scrooge in years past.
All content above represents the opinion of Bryan Perry of Navellier & Associates, Inc.
Also In This Issue
A Look Ahead by Louis Navellier
Consumer Inflation is Fading Fast – and Producer Prices Turned Negative
Income Mail by Bryan Perry
A Technical Take on Where Mr. Market Stands Now
Growth Mail by Gary Alexander
The Market Shrugged Off the Worst Shocks of the Last Century
Global Mail by Ivan Martchev
The Stock Market is Pushing Against Statistical Extremes
Sector Spotlight by Jason Bodner
Where Did All October’s Bears Go (After Halloween)?
View Full Archive
Read Past Issues Here

Bryan Perry
SENIOR DIRECTOR
Bryan Perry is a Senior Director with Navellier Private Client Group, advising and facilitating high net worth investors in the pursuit of their financial goals.
Bryan’s financial services career spanning the past three decades includes over 20 years of wealth management experience with Wall Street firms that include Bear Stearns, Lehman Brothers and Paine Webber, working with both retail and institutional clients. Bryan earned a B.A. in Political Science from Virginia Polytechnic Institute & State University and currently holds a Series 65 license. All content of “Income Mail” represents the opinion of Bryan Perry
Important Disclosures:
Although information in these reports has been obtained from and is based upon sources that Navellier believes to be reliable, Navellier does not guarantee its accuracy and it may be incomplete or condensed. All opinions and estimates constitute Navellier’s judgment as of the date the report was created and are subject to change without notice. These reports are for informational purposes only and are not a solicitation for the purchase or sale of a security. Any decision to purchase securities mentioned in these reports must take into account existing public information on such securities or any registered prospectus.To the extent permitted by law, neither Navellier & Associates, Inc., nor any of its affiliates, agents, or service providers assumes any liability or responsibility nor owes any duty of care for any consequences of any person acting or refraining to act in reliance on the information contained in this communication or for any decision based on it.
Past performance is no indication of future results. Investment in securities involves significant risk and has the potential for partial or complete loss of funds invested. It should not be assumed that any securities recommendations made by Navellier. in the future will be profitable or equal the performance of securities made in this report. Dividend payments are not guaranteed. The amount of a dividend payment, if any, can vary over time and issuers may reduce dividends paid on securities in the event of a recession or adverse event affecting a specific industry or issuer.
None of the stock information, data, and company information presented herein constitutes a recommendation by Navellier or a solicitation to buy or sell any securities. Any specific securities identified and described do not represent all of the securities purchased, sold, or recommended for advisory clients. The holdings identified do not represent all of the securities purchased, sold, or recommended for advisory clients and the reader should not assume that investments in the securities identified and discussed were or will be profitable.
Information presented is general information that does not take into account your individual circumstances, financial situation, or needs, nor does it present a personalized recommendation to you. Individual stocks presented may not be suitable for every investor. Investment in securities involves significant risk and has the potential for partial or complete loss of funds invested. Investment in fixed income securities has the potential for the investment return and principal value of an investment to fluctuate so that an investor’s holdings, when redeemed, may be worth less than their original cost.
One cannot invest directly in an index. Index is unmanaged and index performance does not reflect deduction of fees, expenses, or taxes. Presentation of Index data does not reflect a belief by Navellier that any stock index constitutes an investment alternative to any Navellier equity strategy or is necessarily comparable to such strategies. Among the most important differences between the Indices and Navellier strategies are that the Navellier equity strategies may (1) incur material management fees, (2) concentrate its investments in relatively few stocks, industries, or sectors, (3) have significantly greater trading activity and related costs, and (4) be significantly more or less volatile than the Indices.
ETF Risk: We may invest in exchange traded funds (“ETFs”) and some of our investment strategies are generally fully invested in ETFs. Like traditional mutual funds, ETFs charge asset-based fees, but they generally do not charge initial sales charges or redemption fees and investors typically pay only customary brokerage fees to buy and sell ETF shares. The fees and costs charged by ETFs held in client accounts will not be deducted from the compensation the client pays Navellier. ETF prices can fluctuate up or down, and a client account could lose money investing in an ETF if the prices of the securities owned by the ETF go down. ETFs are subject to additional risks:
- ETF shares may trade above or below their net asset value;
- An active trading market for an ETF’s shares may not develop or be maintained;
- The value of an ETF may be more volatile than the underlying portfolio of securities the ETF is designed to track;
- The cost of owning shares of the ETF may exceed those a client would incur by directly investing in the underlying securities; and
- Trading of an ETF’s shares may be halted if the listing exchange’s officials deem it appropriate, the shares are delisted from the exchange, or the activation of market-wide “circuit breakers” (which are tied to large decreases in stock prices) halts stock trading generally.
Grader Disclosures: Investment in equity strategies involves substantial risk and has the potential for partial or complete loss of funds invested. The sample portfolio and any accompanying charts are for informational purposes only and are not to be construed as a solicitation to buy or sell any financial instrument and should not be relied upon as the sole factor in an investment making decision. As a matter of normal and important disclosures to you, as a potential investor, please consider the following: The performance presented is not based on any actual securities trading, portfolio, or accounts, and the reported performance of the A, B, C, D, and F portfolios (collectively the “model portfolios”) should be considered mere “paper” or pro forma performance results based on Navellier’s research.
Investors evaluating any of Navellier & Associates, Inc.’s, (or its affiliates’) Investment Products must not use any information presented here, including the performance figures of the model portfolios, in their evaluation of any Navellier Investment Products. Navellier Investment Products include the firm’s mutual funds and managed accounts. The model portfolios, charts, and other information presented do not represent actual funded trades and are not actual funded portfolios. There are material differences between Navellier Investment Products’ portfolios and the model portfolios, research, and performance figures presented here. The model portfolios and the research results (1) may contain stocks or ETFs that are illiquid and difficult to trade; (2) may contain stock or ETF holdings materially different from actual funded Navellier Investment Product portfolios; (3) include the reinvestment of all dividends and other earnings, estimated trading costs, commissions, or management fees; and, (4) may not reflect prices obtained in an actual funded Navellier Investment Product portfolio. For these and other reasons, the reported performances of model portfolios do not reflect the performance results of Navellier’s actually funded and traded Investment Products. In most cases, Navellier’s Investment Products have materially lower performance results than the performances of the model portfolios presented.
This report contains statements that are, or may be considered to be, forward-looking statements. All statements that are not historical facts, including statements about our beliefs or expectations, are “forward-looking statements” within the meaning of The U.S. Private Securities Litigation Reform Act of 1995. These statements may be identified by such forward-looking terminology as “expect,” “estimate,” “plan,” “intend,” “believe,” “anticipate,” “may,” “will,” “should,” “could,” “continue,” “project,” or similar statements or variations of such terms. Our forward-looking statements are based on a series of expectations, assumptions, and projections, are not guarantees of future results or performance, and involve substantial risks and uncertainty as described in Form ADV Part 2A of our filing with the Securities and Exchange Commission (SEC), which is available at www.adviserinfo.sec.gov or by requesting a copy by emailing info@navellier.com. All of our forward-looking statements are as of the date of this report only. We can give no assurance that such expectations or forward-looking statements will prove to be correct. Actual results may differ materially. You are urged to carefully consider all such factors.
FEDERAL TAX ADVICE DISCLAIMER: As required by U.S. Treasury Regulations, you are informed that, to the extent this presentation includes any federal tax advice, the presentation is not written by Navellier to be used, and cannot be used, for the purpose of avoiding federal tax penalties. Navellier does not advise on any income tax requirements or issues. Use of any information presented by Navellier is for general information only and does not represent tax advice either express or implied. You are encouraged to seek professional tax advice for income tax questions and assistance.
IMPORTANT NEWSLETTER DISCLOSURE:The hypothetical performance results for investment newsletters that are authored or edited by Louis Navellier, including Louis Navellier’s Growth Investor, Louis Navellier’s Breakthrough Stocks, Louis Navellier’s Accelerated Profits, and Louis Navellier’s Platinum Club, are not based on any actual securities trading, portfolio, or accounts, and the newsletters’ reported hypothetical performances should be considered mere “paper” or proforma hypothetical performance results and are not actual performance of real world trades. Navellier & Associates, Inc. does not have any relation to or affiliation with the owner of these newsletters. There are material differences between Navellier Investment Products’ portfolios and the InvestorPlace Media, LLC newsletter portfolios authored by Louis Navellier. The InvestorPlace Media, LLC newsletters contain hypothetical performance that do not include transaction costs, advisory fees, or other fees a client might incur if actual investments and trades were being made by an investor. As a result, newsletter performance should not be used to evaluate Navellier Investment services which are separate and different from the newsletters. The owner of the newsletters is InvestorPlace Media, LLC and any questions concerning the newsletters, including any newsletter advertising or hypothetical Newsletter performance claims, (which are calculated solely by Investor Place Media and not Navellier) should be referred to InvestorPlace Media, LLC at (800) 718-8289.
Please note that Navellier & Associates and the Navellier Private Client Group are managed completely independent of the newsletters owned and published by InvestorPlace Media, LLC and written and edited by Louis Navellier, and investment performance of the newsletters should in no way be considered indicative of potential future investment performance for any Navellier & Associates separately managed account portfolio. Potential investors should consult with their financial advisor before investing in any Navellier Investment Product.
Navellier claims compliance with Global Investment Performance Standards (GIPS). To receive a complete list and descriptions of Navellier’s composites and/or a presentation that adheres to the GIPS standards, please contact Navellier or click here. It should not be assumed that any securities recommendations made by Navellier & Associates, Inc. in the future will be profitable or equal the performance of securities made in this report.
FactSet Disclosure: Navellier does not independently calculate the statistical information included in the attached report. The calculation and the information are provided by FactSet, a company not related to Navellier. Although information contained in the report has been obtained from FactSet and is based on sources Navellier believes to be reliable, Navellier does not guarantee its accuracy, and it may be incomplete or condensed. The report and the related FactSet sourced information are provided on an “as is” basis. The user assumes the entire risk of any use made of this information. Investors should consider the report as only a single factor in making their investment decision. The report is for informational purposes only and is not intended as an offer or solicitation for the purchase or sale of a security. FactSet sourced information is the exclusive property of FactSet. Without prior written permission of FactSet, this information may not be reproduced, disseminated or used to create any financial products. All indices are unmanaged and performance of the indices include reinvestment of dividends and interest income, unless otherwise noted, are not illustrative of any particular investment and an investment cannot be made in any index. Past performance is no guarantee of future results.