by Gary Alexander
October 31, 2023
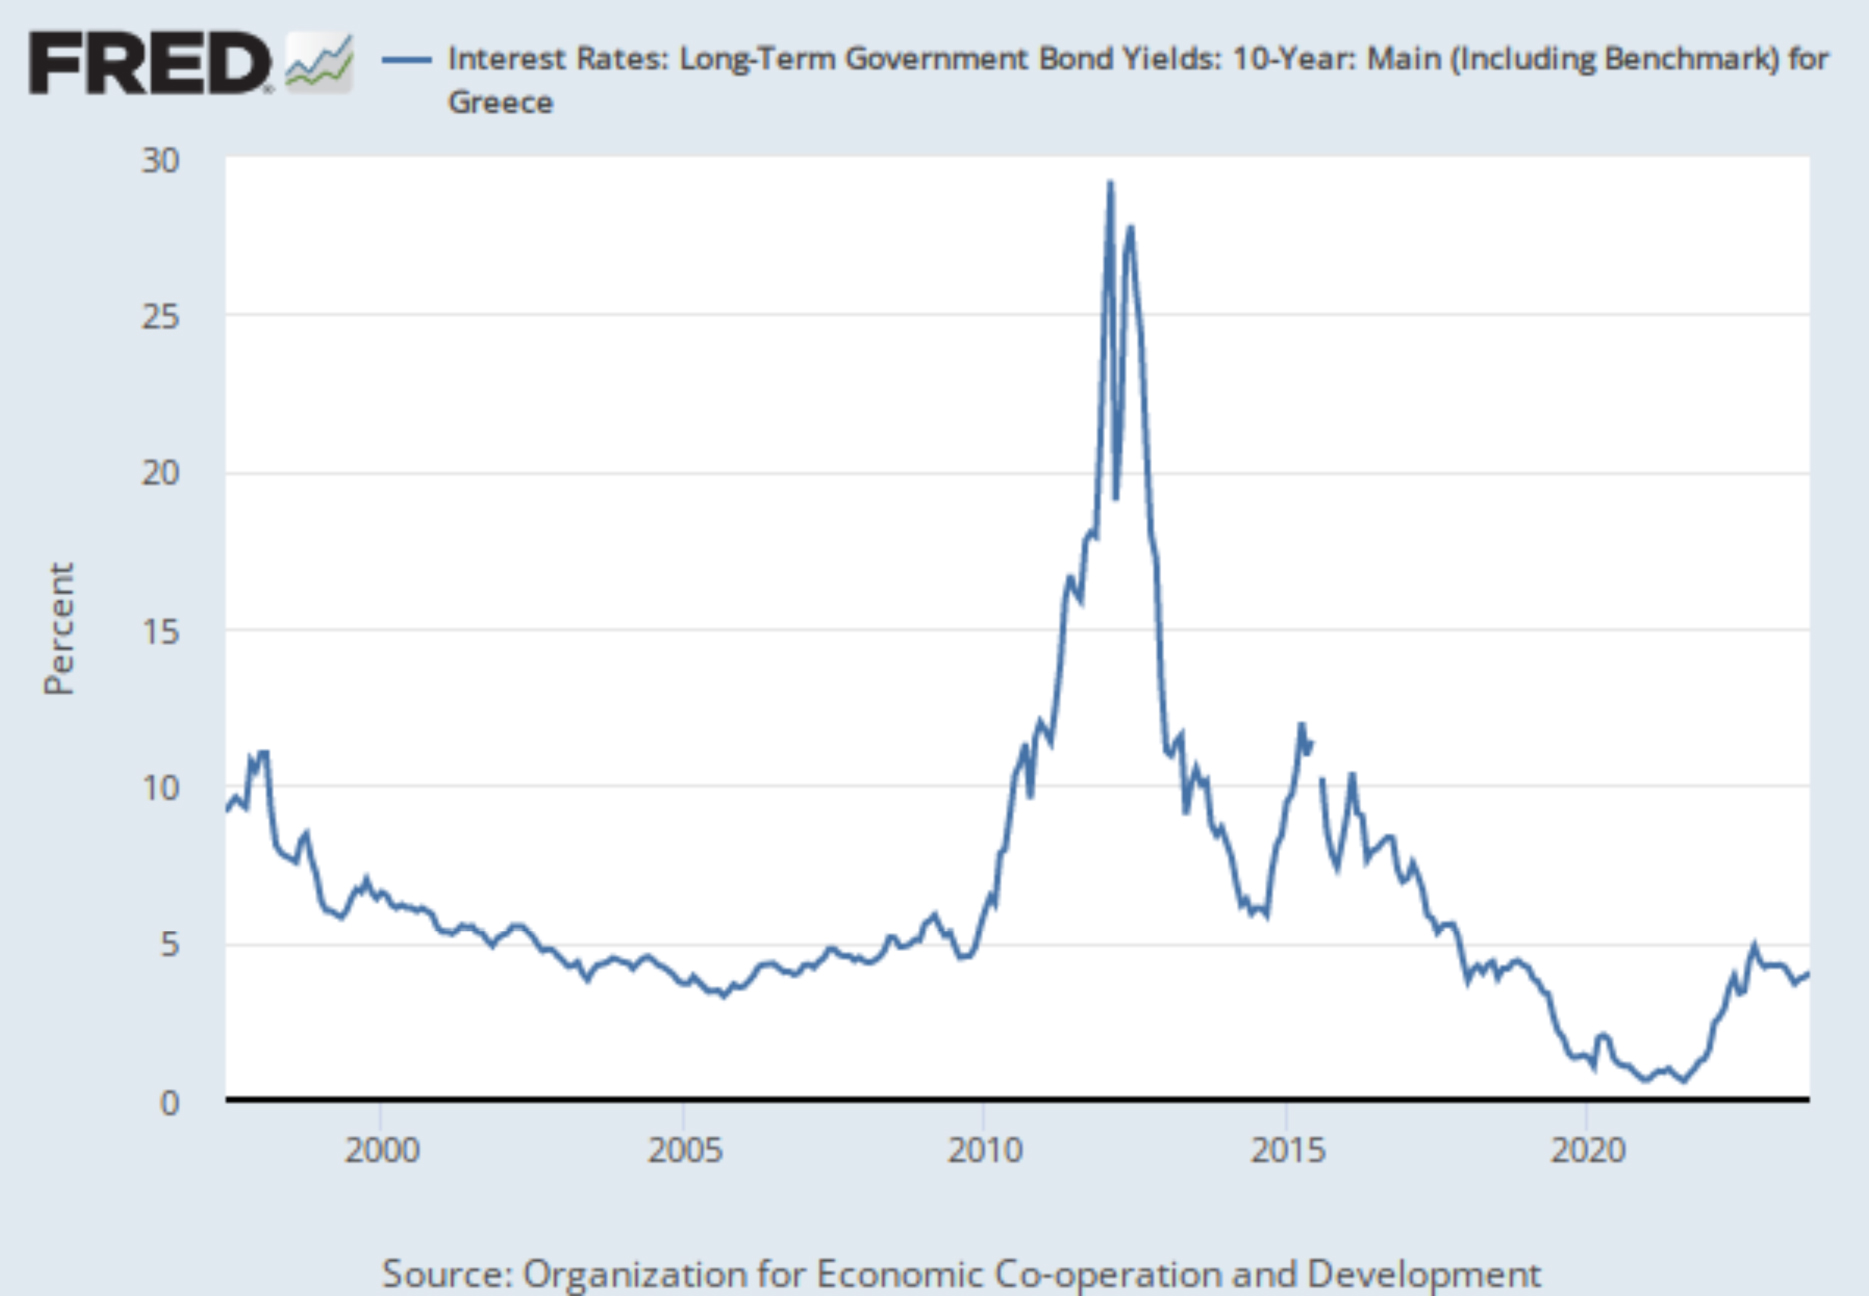
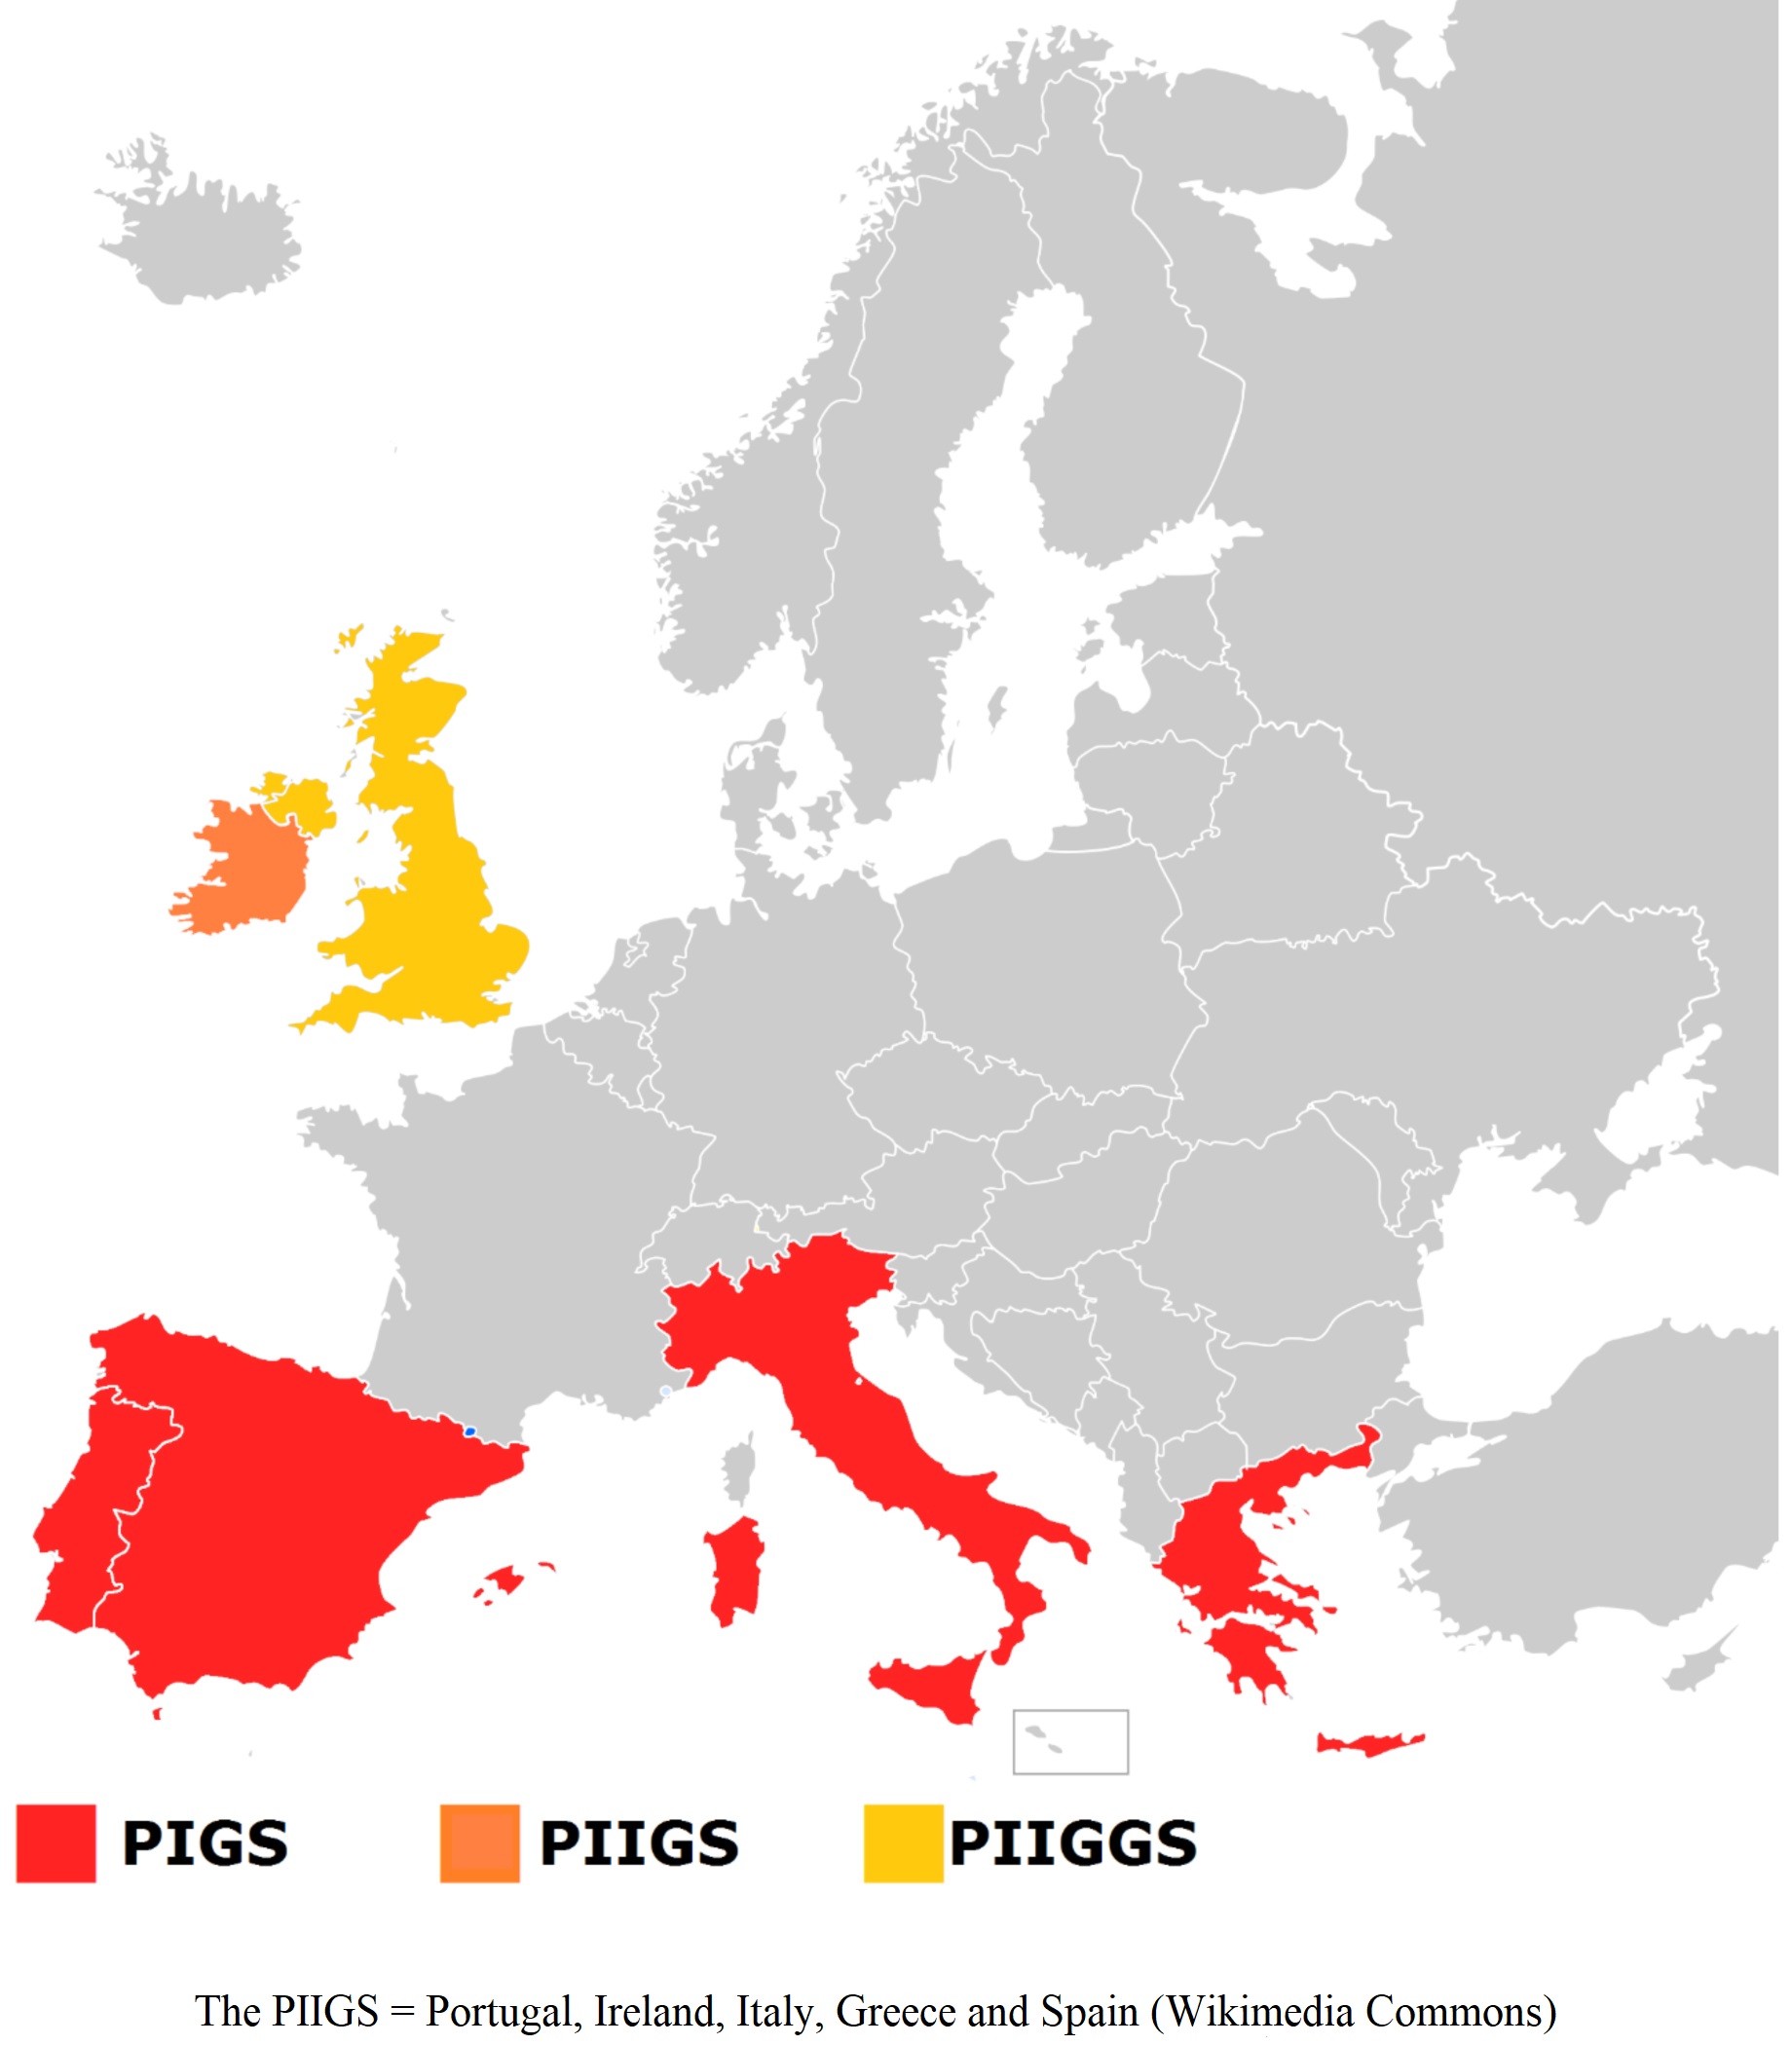
A decade ago, the biggest economic story in these columns for many weeks concerned the PIGS of Europe: Portugal, Italy (or Ireland, take your pick), Greece and Spain, the sickest economies of Europe. Greece was the worst of the lot, with 10-year sovereign debt yields rising to 30% at one point, and one bailout plan after another offered, with a “Grexit” nuclear option for throwing Greece out of the European Union.
Graphs are for illustrative and discussion purposes only. Please read important disclosures at the end of this commentary.
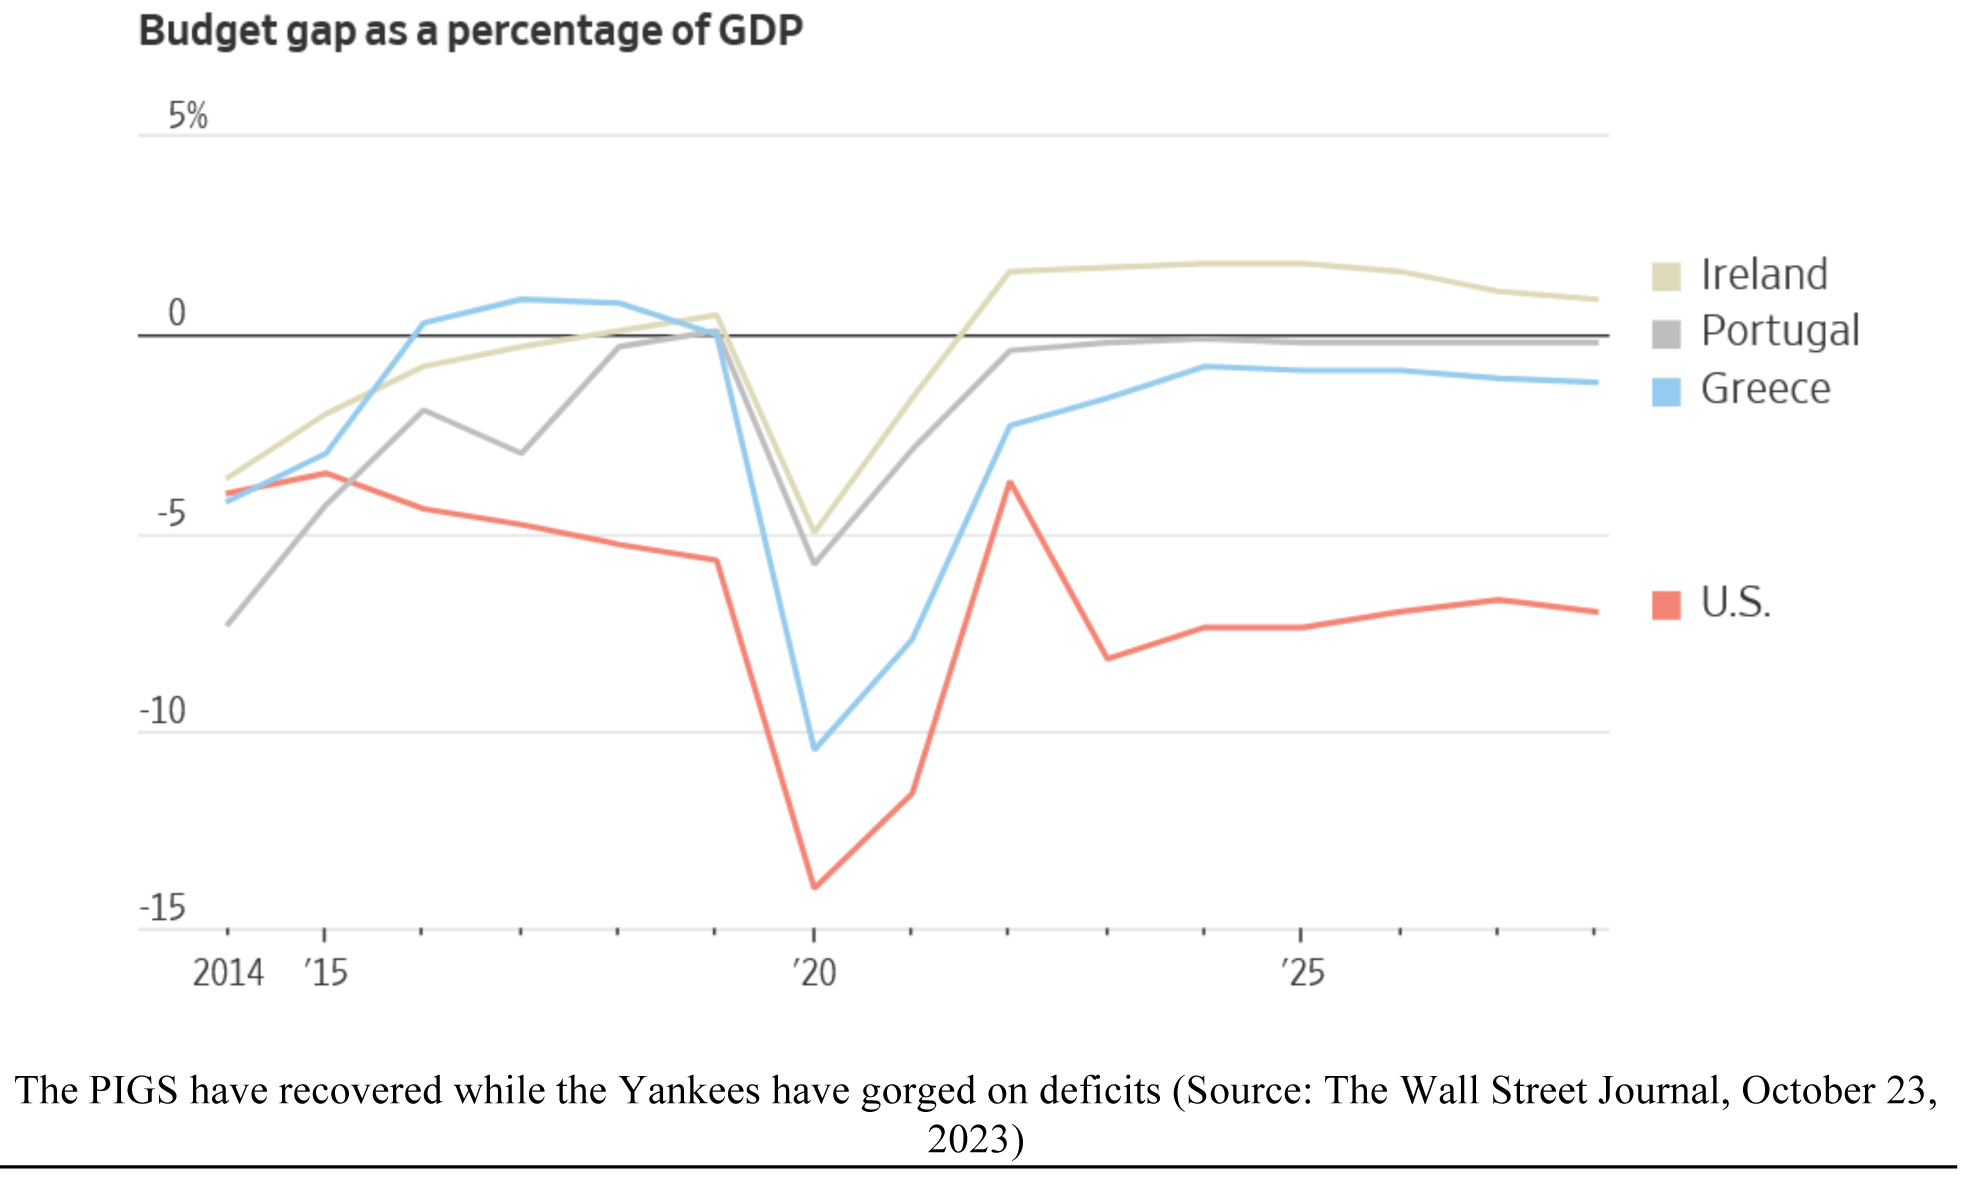
In contrast, you probably haven’t heard about Greece balancing its budget four years in a row (2016-19) or its deficit-to-GDP ratio about one-third that of the U.S., but here’s proof of their remarkable recovery:
GREECE: The Sickest Economy of Europe Staged a Remarkable Recovery
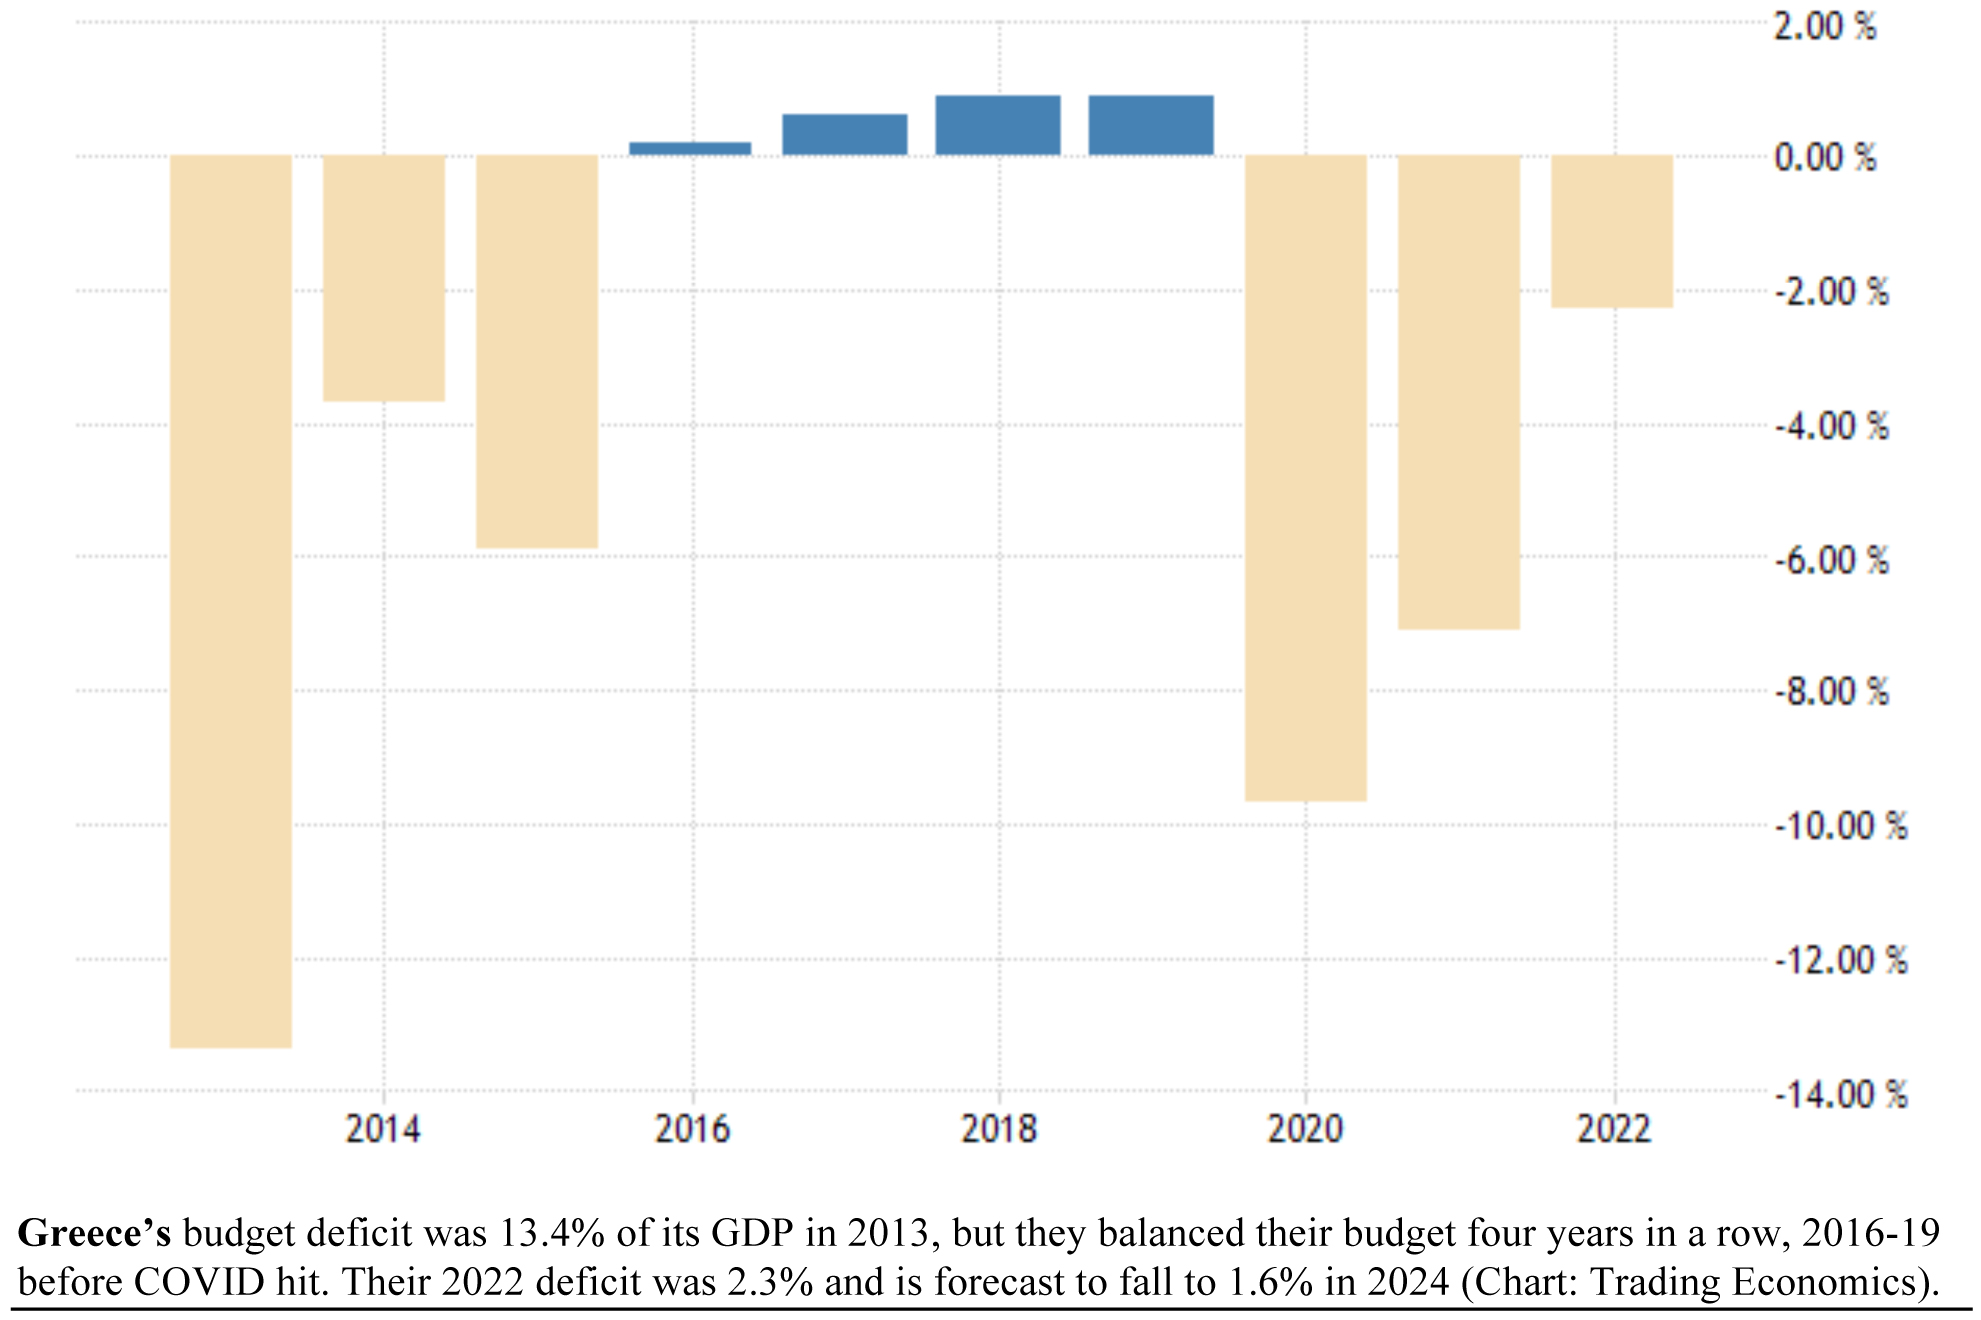
Graphs are for illustrative and discussion purposes only. Please read important disclosures at the end of this commentary.
Greece isn’t alone. Ireland will have a budget surplus for the second straight year this year. Portugal also has a budget surplus this year, according to Eurostat data released last week. Spain and Italy still lag, but the Eurozone as a whole has a 3.2% deficit-to-GDP ratio, half the U.S.’s 6.4% 2023 deficit-to-GDP ratio.
According to Eurostat data released last Monday, October 23, five major European nations reported an annualized budget surplus in 2023’s second quarter, the latest quarter with complete data. Those nations are: Denmark (+2.8%), Ireland (+2.4%), Portugal (+2.4%), Switzerland (+1.4%) and The Netherlands (+0.2%).
Two of those – Portugal and Ireland – comprise the first half of the PIGS acronym. Good going, porkers!
Europe is Now Prepared to Lead – No Uncle Sam Needed
At the start of this year, on January 23, 2023, Foreign Policy printed an article saying that Europe doesn’t need Uncle Sam anymore, and I welcomed that article, long having argued that Europe needs to stand on its own two legs in their defense spending. Entering the second year of the Ukraine war, the author, Rajan Menon, argued that Russia is a poor nation and Europe is rich. At the start of the Ukraine war, Russia had barely one-tenth the GDP of Europe. Russia ranks #44 among the world’s most technologically advanced countries, and Russia has just one third the people as Europe, so Europe can take care of helping Ukraine.
Then, on July 16, 2023, The Financial Times published an influential article taking this argument further, titled, “The Trouble with American Exceptionalism,” bringing forth some astounding “exceptionalism” now evident in America, most notably our level of overspending, vis a vis Europe. “The U.S. has started to look exceptional in a bad way…. During the pandemic, the U.S. budget deficit tripled to more than 10 per cent of gross domestic product, more than double the peak in other developed economies. In coming years, the U.S. deficit is expected to average close-to 6 per cent of GDP — well above its historic norm, and a full six times the average in other developed economies.” That’s way too “exceptional” for my taste.
Most countries ended their limited COVID stimulus spending quickly, after their more limited pandemic-induced lockdowns. “But,” the FT countered, “all the $6.7 trillion in new spending from the Biden administration came after 2020 was over. Most of it had nothing to do with pandemic relief. Instead, Joe Biden used the sense of crisis to launch a latter-day New Deal…” “America,” the FT wrote, is “now one of the most fiscally irresponsible nations. Its deficit has climbed the ranks to worst in the developed world.”
Two weeks after this article was published, the market peaked and Fitch downgraded U.S. sovereign debt on August 1. That’s three months ago tomorrow, and that’s the day the stock market started collapsing:
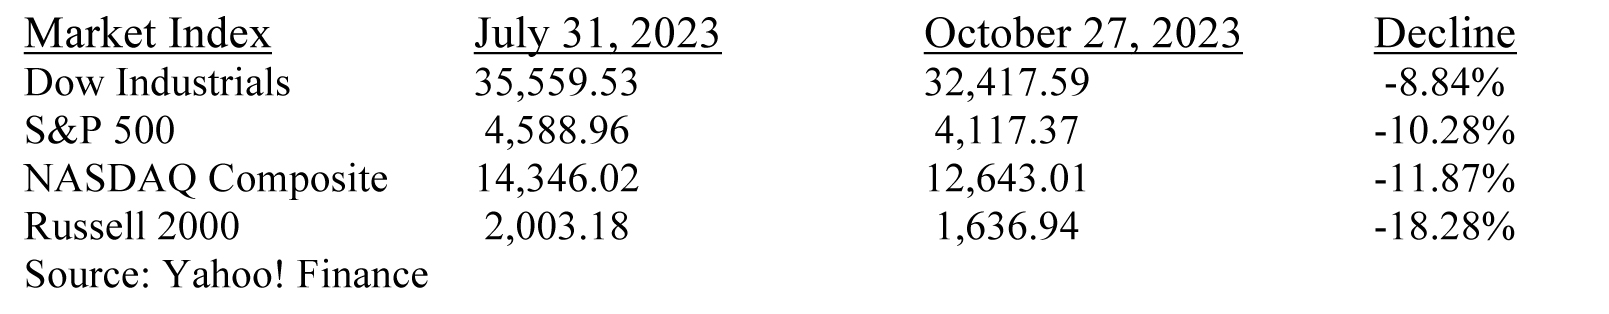
It appears to me that Washington DC’s chronic over-spending, with no thought, or intent, of addressing that over-spending, is the source of the recent rapid rise in the benchmark 10-year Treasury bond yield and the resulting demise of the housing market, slowdown in the auto and EV market, and decline of the major stock market indexes after the downgrade of U.S. Treasury vehicles three months ago tomorrow.
And now we see that Europe has quietly adopted the old-time religion of balancing budgets in several nations. The Wall Street Journal’s Paul Hannon wrote about this new austerity last Monday in his article, “Europe, Unlike U.S., Tackles its Deficits,” saying that the IMF expects the combined deficits of the eurozone governments to fall to 2.7% next year, barely one-third of the expected 7.4% ratio in the U.S.
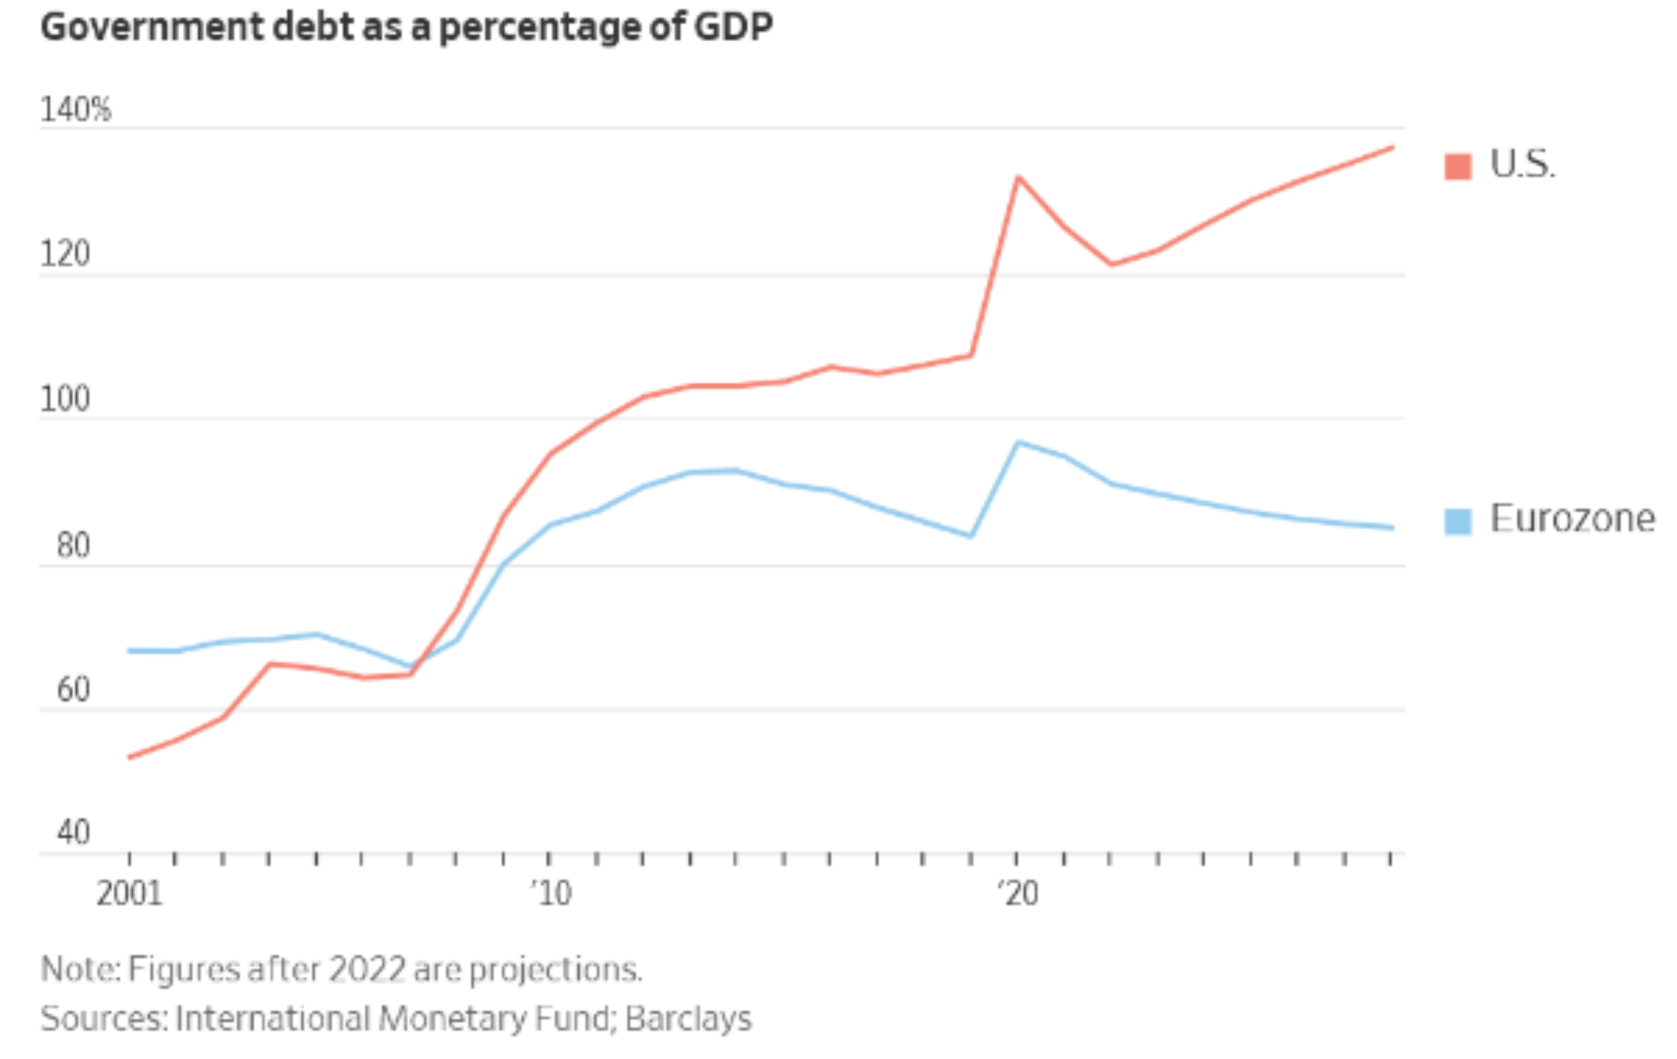
As the following charts show, the cumulative national debt (in terms of GDP) for the EU and U.S. before the Great Financial Crisis of 2008, was about equal at 65%, but since then the U.S. ratio has doubled to about 130% while the EU has put the PIGS on a diet and brought most nations into reasonable discipline:
Graphs are for illustrative and discussion purposes only. Please read important disclosures at the end of this commentary.
Graphs are for illustrative and discussion purposes only. Please read important disclosures at the end of this commentary.
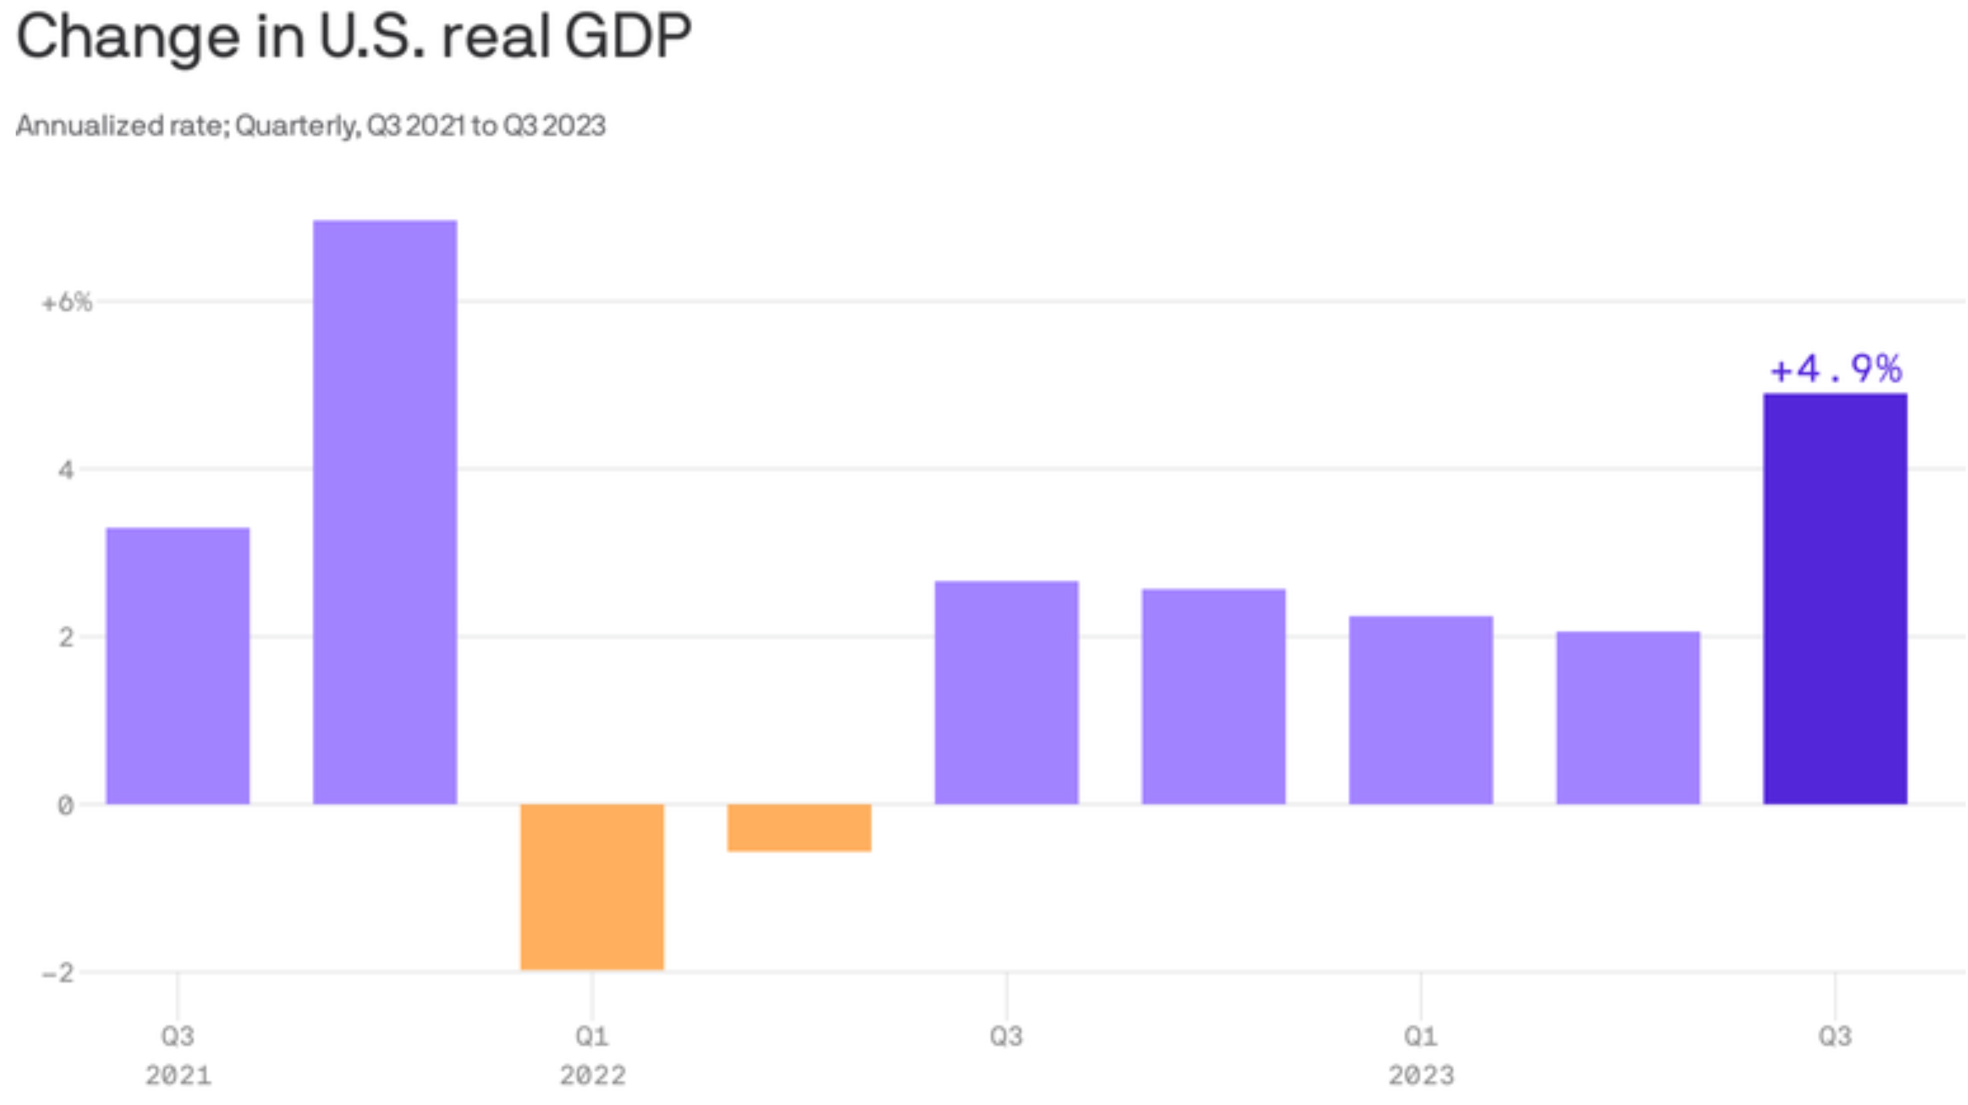
OK, If U.S. Stocks are Down, Why is the U.S. GDP Rising So Fast?
Figure this out, While the market was falling 10% or so, and Treasury rates were soaring, the GDP was more than doubling its growth rate of the first half of 2023. It turns out that the Atlanta Fed GDPNow estimate (of 5.4%) wasn’t far off the Bureau of Economic Analysis (BEA) initial estimate of 4.9%.
Graphs are for illustrative and discussion purposes only. Please read important disclosures at the end of this commentary.
Perhaps the best answer for this surging GDP figure came in the same day’s Wall Street Journal, as the above article by Paul Hannon, about Europe’s shrinking debt, entitled, “Get Ready for a Short-Lived Economic Boom: Third-quarter economic growth may run at 5%, but the bubble is sure to deflate quickly after that” by Stephen Miran, an adjunct fellow at Manhattan Institute. His main point is the same as mine here, “A deficit more than 7% of GDP can lift growth, but outside war or severe recession, it is irresponsible fiscal management, for which we are paying the price through higher interest rates.”
In his article, Miran reminds us that the day after the Fitch debt downgrade last August 1, “The Treasury informed the market in its August 2 Quarterly Refunding Announcement that it would auction more than $1 trillion of debt in the third quarter to fund deficits and refill the accounts it drained in the spring. The huge supply of bonds has pushed yields higher, reversing the easing of financial conditions, and the market is on tenterhooks over the agency’s next refunding announcement, due November 1,” so, he retorts, “One thing seems clear, the economy’s performance in the third quarter will be difficult to repeat.
Looking at October, the first month of the fourth quarter, nearly every asset class is down. Through last Friday, almost every index and asset class was down except Gold (+8.9%) and Natural Gas (+8.3%), with smaller gains in Silver (+4.3%). The biggest decline among indexes was the Russell 2000 (-8.3%).
Who would have believed a decade ago that the Euro PIG (Portugal, Ireland and Greece) would balance its budget, while the richest country in the world would run up the worst deficits in the developed world?
With Halloween goblins and witches assaulting your door tonight, I hate to be the bearer of any bad news, so I’ll close by saying November is the best month in market history, so we might get some Thanksgiving relief, but I am flying to New Orleans tomorrow for my 40th investment conference there, serving as MC and panel moderator. I don’t expect to hear bullish views there, but I’ll fill you in on that event next week.
All content above represents the opinion of Gary Alexander of Navellier & Associates, Inc.
Also In This Issue
A Look Ahead by Louis Navellier
As GDP Peaks Near 5%, Is This the Last of the Booming Quarters?
Income Mail by Bryan Perry
Treasury Secretary Janet Yellen Is Talking Her Book
Growth Mail by Gary Alexander
When PIGS Fly: Europe’s Basket Cases Recover, While the U.S. Drowns in Debt
Global Mail by Ivan Martchev
Initial Signs of a Treasury Yield Top
Sector Spotlight by Jason Bodner
What Kind of Bear is This – Or is it a Bear at All?
View Full Archive
Read Past Issues Here
About The Author

Gary Alexander
SENIOR EDITOR
Gary Alexander has been Senior Writer at Navellier since 2009. He edits Navellier’s weekly Marketmail and writes a weekly Growth Mail column, in which he uses market history to support the case for growth stocks. For the previous 20 years before joining Navellier, he was Senior Executive Editor at InvestorPlace Media (formerly Phillips Publishing), where he worked with several leading investment analysts, including Louis Navellier (since 1997), helping launch Louis Navellier’s Blue Chip Growth and Global Growth newsletters.
Prior to that, Gary edited Wealth Magazine and Gold Newsletter and wrote various investment research reports for Jefferson Financial in New Orleans in the 1980s. He began his financial newsletter career with KCI Communications in 1980, where he served as consulting editor for Personal Finance newsletter while serving as general manager of KCI’s Alexandria House book division. Before that, he covered the economics beat for news magazines. All content of “Growth Mail” represents the opinion of Gary Alexander
Important Disclosures:
Although information in these reports has been obtained from and is based upon sources that Navellier believes to be reliable, Navellier does not guarantee its accuracy and it may be incomplete or condensed. All opinions and estimates constitute Navellier’s judgment as of the date the report was created and are subject to change without notice. These reports are for informational purposes only and are not a solicitation for the purchase or sale of a security. Any decision to purchase securities mentioned in these reports must take into account existing public information on such securities or any registered prospectus.To the extent permitted by law, neither Navellier & Associates, Inc., nor any of its affiliates, agents, or service providers assumes any liability or responsibility nor owes any duty of care for any consequences of any person acting or refraining to act in reliance on the information contained in this communication or for any decision based on it.
Past performance is no indication of future results. Investment in securities involves significant risk and has the potential for partial or complete loss of funds invested. It should not be assumed that any securities recommendations made by Navellier. in the future will be profitable or equal the performance of securities made in this report. Dividend payments are not guaranteed. The amount of a dividend payment, if any, can vary over time and issuers may reduce dividends paid on securities in the event of a recession or adverse event affecting a specific industry or issuer.
None of the stock information, data, and company information presented herein constitutes a recommendation by Navellier or a solicitation to buy or sell any securities. Any specific securities identified and described do not represent all of the securities purchased, sold, or recommended for advisory clients. The holdings identified do not represent all of the securities purchased, sold, or recommended for advisory clients and the reader should not assume that investments in the securities identified and discussed were or will be profitable.
Information presented is general information that does not take into account your individual circumstances, financial situation, or needs, nor does it present a personalized recommendation to you. Individual stocks presented may not be suitable for every investor. Investment in securities involves significant risk and has the potential for partial or complete loss of funds invested. Investment in fixed income securities has the potential for the investment return and principal value of an investment to fluctuate so that an investor’s holdings, when redeemed, may be worth less than their original cost.
One cannot invest directly in an index. Index is unmanaged and index performance does not reflect deduction of fees, expenses, or taxes. Presentation of Index data does not reflect a belief by Navellier that any stock index constitutes an investment alternative to any Navellier equity strategy or is necessarily comparable to such strategies. Among the most important differences between the Indices and Navellier strategies are that the Navellier equity strategies may (1) incur material management fees, (2) concentrate its investments in relatively few stocks, industries, or sectors, (3) have significantly greater trading activity and related costs, and (4) be significantly more or less volatile than the Indices.
ETF Risk: We may invest in exchange traded funds (“ETFs”) and some of our investment strategies are generally fully invested in ETFs. Like traditional mutual funds, ETFs charge asset-based fees, but they generally do not charge initial sales charges or redemption fees and investors typically pay only customary brokerage fees to buy and sell ETF shares. The fees and costs charged by ETFs held in client accounts will not be deducted from the compensation the client pays Navellier. ETF prices can fluctuate up or down, and a client account could lose money investing in an ETF if the prices of the securities owned by the ETF go down. ETFs are subject to additional risks:
- ETF shares may trade above or below their net asset value;
- An active trading market for an ETF’s shares may not develop or be maintained;
- The value of an ETF may be more volatile than the underlying portfolio of securities the ETF is designed to track;
- The cost of owning shares of the ETF may exceed those a client would incur by directly investing in the underlying securities; and
- Trading of an ETF’s shares may be halted if the listing exchange’s officials deem it appropriate, the shares are delisted from the exchange, or the activation of market-wide “circuit breakers” (which are tied to large decreases in stock prices) halts stock trading generally.
Grader Disclosures: Investment in equity strategies involves substantial risk and has the potential for partial or complete loss of funds invested. The sample portfolio and any accompanying charts are for informational purposes only and are not to be construed as a solicitation to buy or sell any financial instrument and should not be relied upon as the sole factor in an investment making decision. As a matter of normal and important disclosures to you, as a potential investor, please consider the following: The performance presented is not based on any actual securities trading, portfolio, or accounts, and the reported performance of the A, B, C, D, and F portfolios (collectively the “model portfolios”) should be considered mere “paper” or pro forma performance results based on Navellier’s research.
Investors evaluating any of Navellier & Associates, Inc.’s, (or its affiliates’) Investment Products must not use any information presented here, including the performance figures of the model portfolios, in their evaluation of any Navellier Investment Products. Navellier Investment Products include the firm’s mutual funds and managed accounts. The model portfolios, charts, and other information presented do not represent actual funded trades and are not actual funded portfolios. There are material differences between Navellier Investment Products’ portfolios and the model portfolios, research, and performance figures presented here. The model portfolios and the research results (1) may contain stocks or ETFs that are illiquid and difficult to trade; (2) may contain stock or ETF holdings materially different from actual funded Navellier Investment Product portfolios; (3) include the reinvestment of all dividends and other earnings, estimated trading costs, commissions, or management fees; and, (4) may not reflect prices obtained in an actual funded Navellier Investment Product portfolio. For these and other reasons, the reported performances of model portfolios do not reflect the performance results of Navellier’s actually funded and traded Investment Products. In most cases, Navellier’s Investment Products have materially lower performance results than the performances of the model portfolios presented.
This report contains statements that are, or may be considered to be, forward-looking statements. All statements that are not historical facts, including statements about our beliefs or expectations, are “forward-looking statements” within the meaning of The U.S. Private Securities Litigation Reform Act of 1995. These statements may be identified by such forward-looking terminology as “expect,” “estimate,” “plan,” “intend,” “believe,” “anticipate,” “may,” “will,” “should,” “could,” “continue,” “project,” or similar statements or variations of such terms. Our forward-looking statements are based on a series of expectations, assumptions, and projections, are not guarantees of future results or performance, and involve substantial risks and uncertainty as described in Form ADV Part 2A of our filing with the Securities and Exchange Commission (SEC), which is available at www.adviserinfo.sec.gov or by requesting a copy by emailing info@navellier.com. All of our forward-looking statements are as of the date of this report only. We can give no assurance that such expectations or forward-looking statements will prove to be correct. Actual results may differ materially. You are urged to carefully consider all such factors.
FEDERAL TAX ADVICE DISCLAIMER: As required by U.S. Treasury Regulations, you are informed that, to the extent this presentation includes any federal tax advice, the presentation is not written by Navellier to be used, and cannot be used, for the purpose of avoiding federal tax penalties. Navellier does not advise on any income tax requirements or issues. Use of any information presented by Navellier is for general information only and does not represent tax advice either express or implied. You are encouraged to seek professional tax advice for income tax questions and assistance.
IMPORTANT NEWSLETTER DISCLOSURE:The hypothetical performance results for investment newsletters that are authored or edited by Louis Navellier, including Louis Navellier’s Growth Investor, Louis Navellier’s Breakthrough Stocks, Louis Navellier’s Accelerated Profits, and Louis Navellier’s Platinum Club, are not based on any actual securities trading, portfolio, or accounts, and the newsletters’ reported hypothetical performances should be considered mere “paper” or proforma hypothetical performance results and are not actual performance of real world trades. Navellier & Associates, Inc. does not have any relation to or affiliation with the owner of these newsletters. There are material differences between Navellier Investment Products’ portfolios and the InvestorPlace Media, LLC newsletter portfolios authored by Louis Navellier. The InvestorPlace Media, LLC newsletters contain hypothetical performance that do not include transaction costs, advisory fees, or other fees a client might incur if actual investments and trades were being made by an investor. As a result, newsletter performance should not be used to evaluate Navellier Investment services which are separate and different from the newsletters. The owner of the newsletters is InvestorPlace Media, LLC and any questions concerning the newsletters, including any newsletter advertising or hypothetical Newsletter performance claims, (which are calculated solely by Investor Place Media and not Navellier) should be referred to InvestorPlace Media, LLC at (800) 718-8289.
Please note that Navellier & Associates and the Navellier Private Client Group are managed completely independent of the newsletters owned and published by InvestorPlace Media, LLC and written and edited by Louis Navellier, and investment performance of the newsletters should in no way be considered indicative of potential future investment performance for any Navellier & Associates separately managed account portfolio. Potential investors should consult with their financial advisor before investing in any Navellier Investment Product.
Navellier claims compliance with Global Investment Performance Standards (GIPS). To receive a complete list and descriptions of Navellier’s composites and/or a presentation that adheres to the GIPS standards, please contact Navellier or click here. It should not be assumed that any securities recommendations made by Navellier & Associates, Inc. in the future will be profitable or equal the performance of securities made in this report.
FactSet Disclosure: Navellier does not independently calculate the statistical information included in the attached report. The calculation and the information are provided by FactSet, a company not related to Navellier. Although information contained in the report has been obtained from FactSet and is based on sources Navellier believes to be reliable, Navellier does not guarantee its accuracy, and it may be incomplete or condensed. The report and the related FactSet sourced information are provided on an “as is” basis. The user assumes the entire risk of any use made of this information. Investors should consider the report as only a single factor in making their investment decision. The report is for informational purposes only and is not intended as an offer or solicitation for the purchase or sale of a security. FactSet sourced information is the exclusive property of FactSet. Without prior written permission of FactSet, this information may not be reproduced, disseminated or used to create any financial products. All indices are unmanaged and performance of the indices include reinvestment of dividends and interest income, unless otherwise noted, are not illustrative of any particular investment and an investment cannot be made in any index. Past performance is no guarantee of future results.