by Jason Bodner
October 31, 2023
There are bears and there are bears. We all know the iconic Grizzly bears that litter explorer movies. They are always portrayed as big, ferocious. and with nasty claws. We’ve seen Polar bears in documentaries about climate change. There are eight species of bears, the benign stuffed animal-like Panda being one.
And now there are mixed Grizzly and Polar (‘Grolar” or “Pizzly” bears) popping up. As the climate shifts, apparently the changing habitats foster new romances.

Well, when it comes to defining the stock market, there are bull markets and bear markets, but logic and experience tell us that it doesn’t just stop there. We’ve seen “bull market rallies within bear markets” and vice versa, meaning there are Grolars, Pizzlys, Bull-bears, Bear-bulls, Baby bears and Mega-bulls.
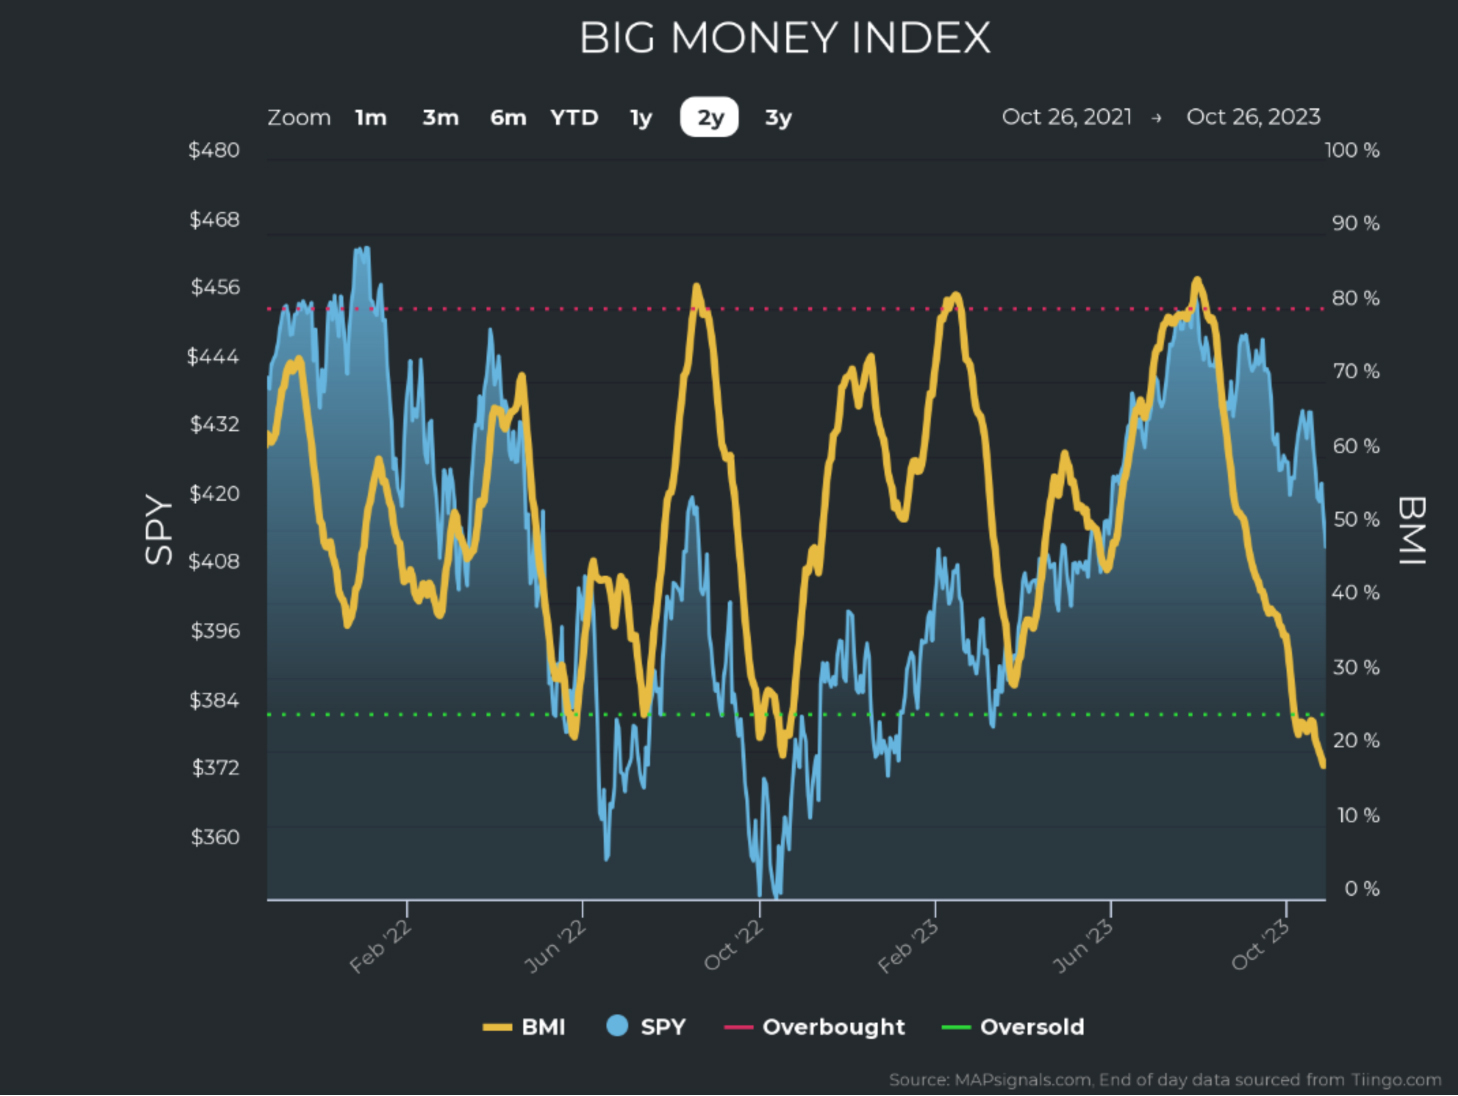
That brings me to our unsettling recent market action. We are now extremely oversold. The Big Money Index (BMI) has fallen to oversold levels not seen since April 2020, a major market bottom:
Graphs are for illustrative and discussion purposes only. Please read important disclosures at the end of this commentary.
When that happens – forward returns have been outstanding. More on that in a moment, but first let’s rip off the band-aid and take an honest look at the recent market damage…
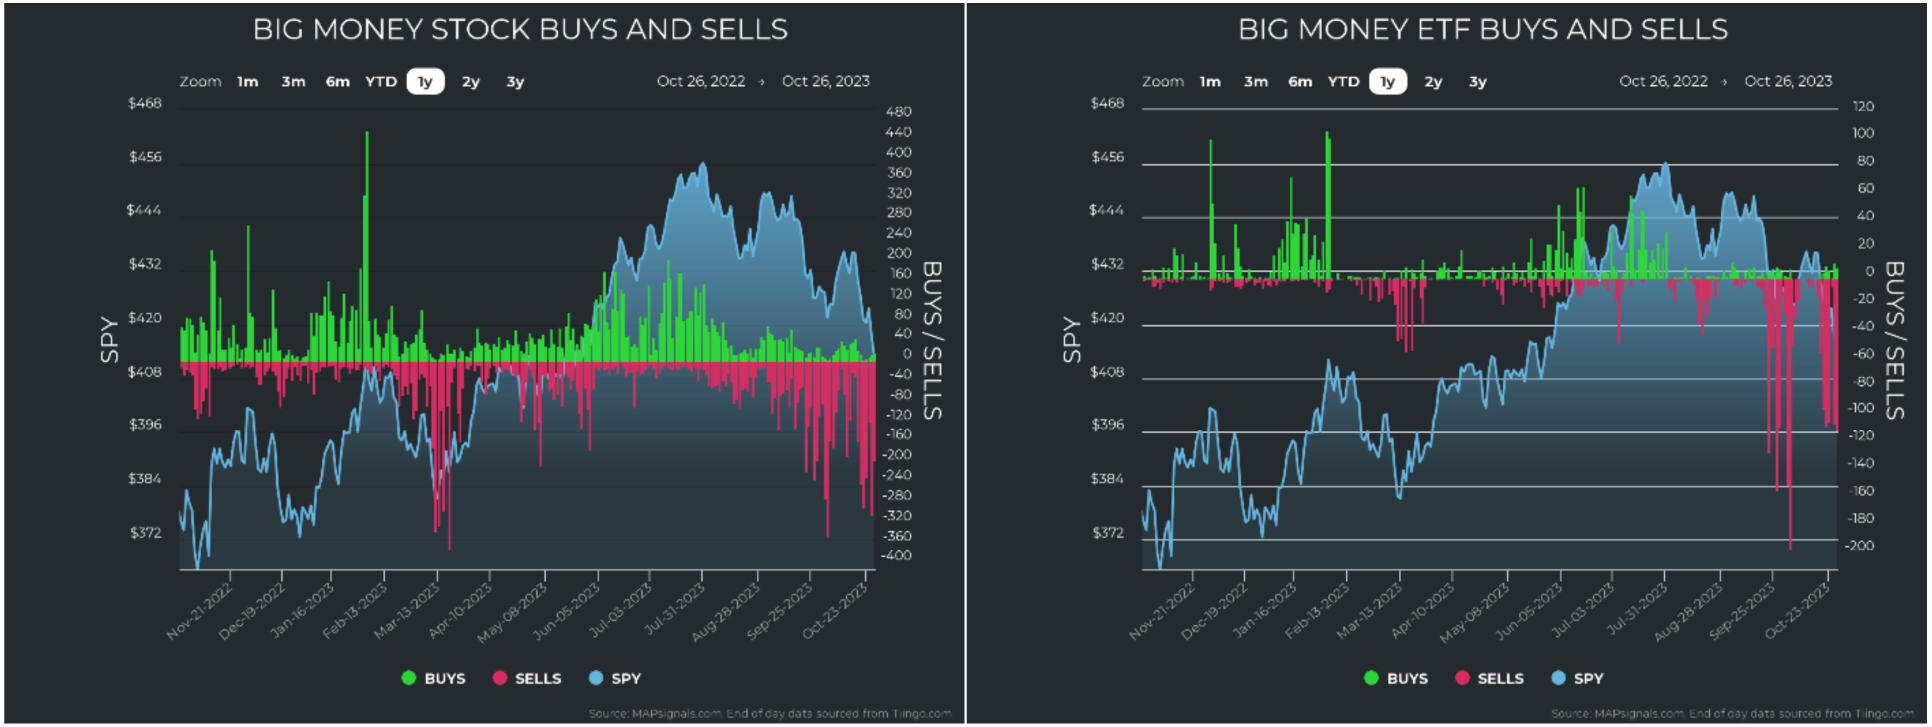
Selling looked like it was over during the week of October 9th-13th. That would have been right on schedule, as history suggested, October is a seasonally strong month. Had a rally ensued, it would have been consistent with market history. It started that way, but that was a head fake, and the bear claws ripped through markets last week, too. Selling resumed heavily on both stocks and ETFs:
Graphs are for illustrative and discussion purposes only. Please read important disclosures at the end of this commentary.
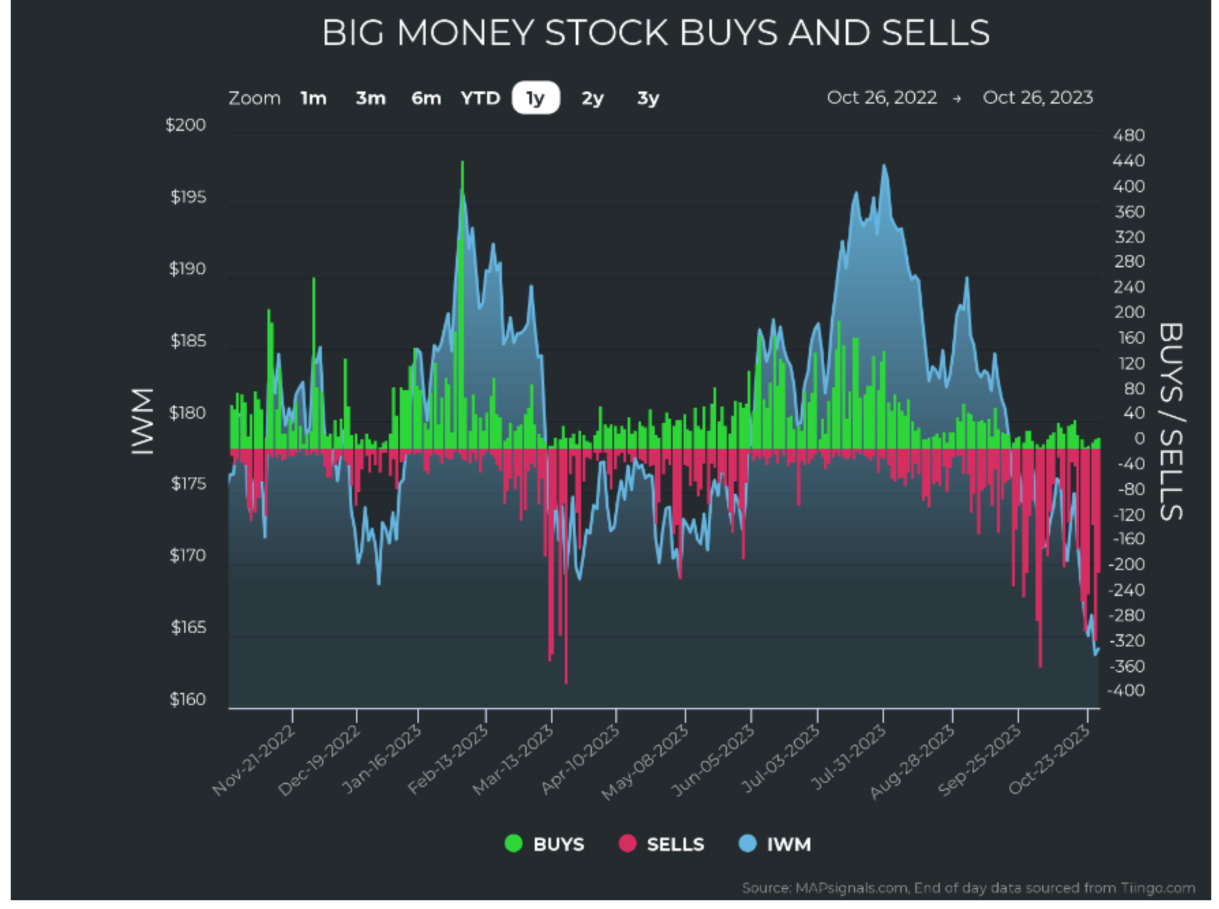
Last week’s pressure was focused in small- and mid-cap stocks, but that has been the theme since August. Below, we can see how much destruction has taken place, when we substitute the Russell 2000 for the SPY (the S&P 500 ETF) in the chart above:
Graphs are for illustrative and discussion purposes only. Please read important disclosures at the end of this commentary.
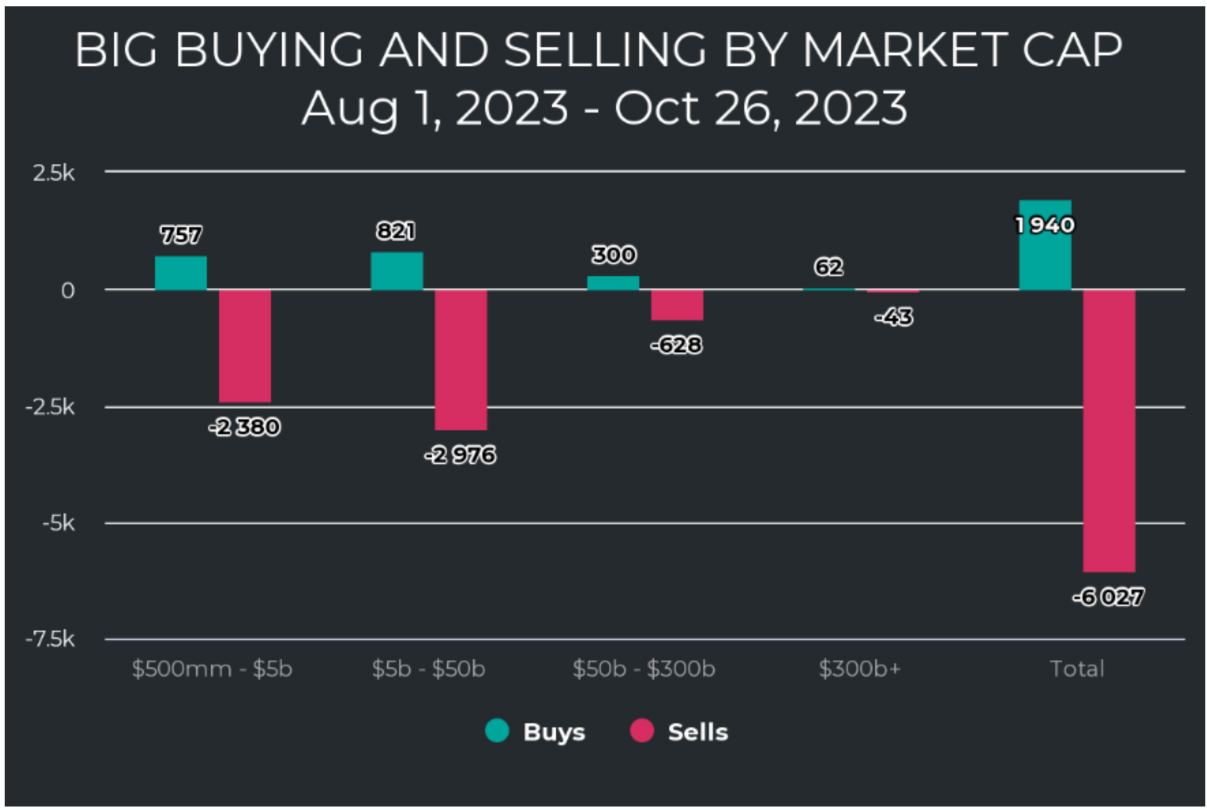
This makes sense when we look at the distribution of selling across company size since August:
Graphs are for illustrative and discussion purposes only. Please read important disclosures at the end of this commentary.
This selling hasn’t really spared any sector. This is bad news, of course, because a widespread selloff is miserable to sit through. It causes heartburn and anxiety. But it’s also good news. Because it brings us closer to a bottom, so we can get on with our lives. Here’s how sector strength and weakness shake out:
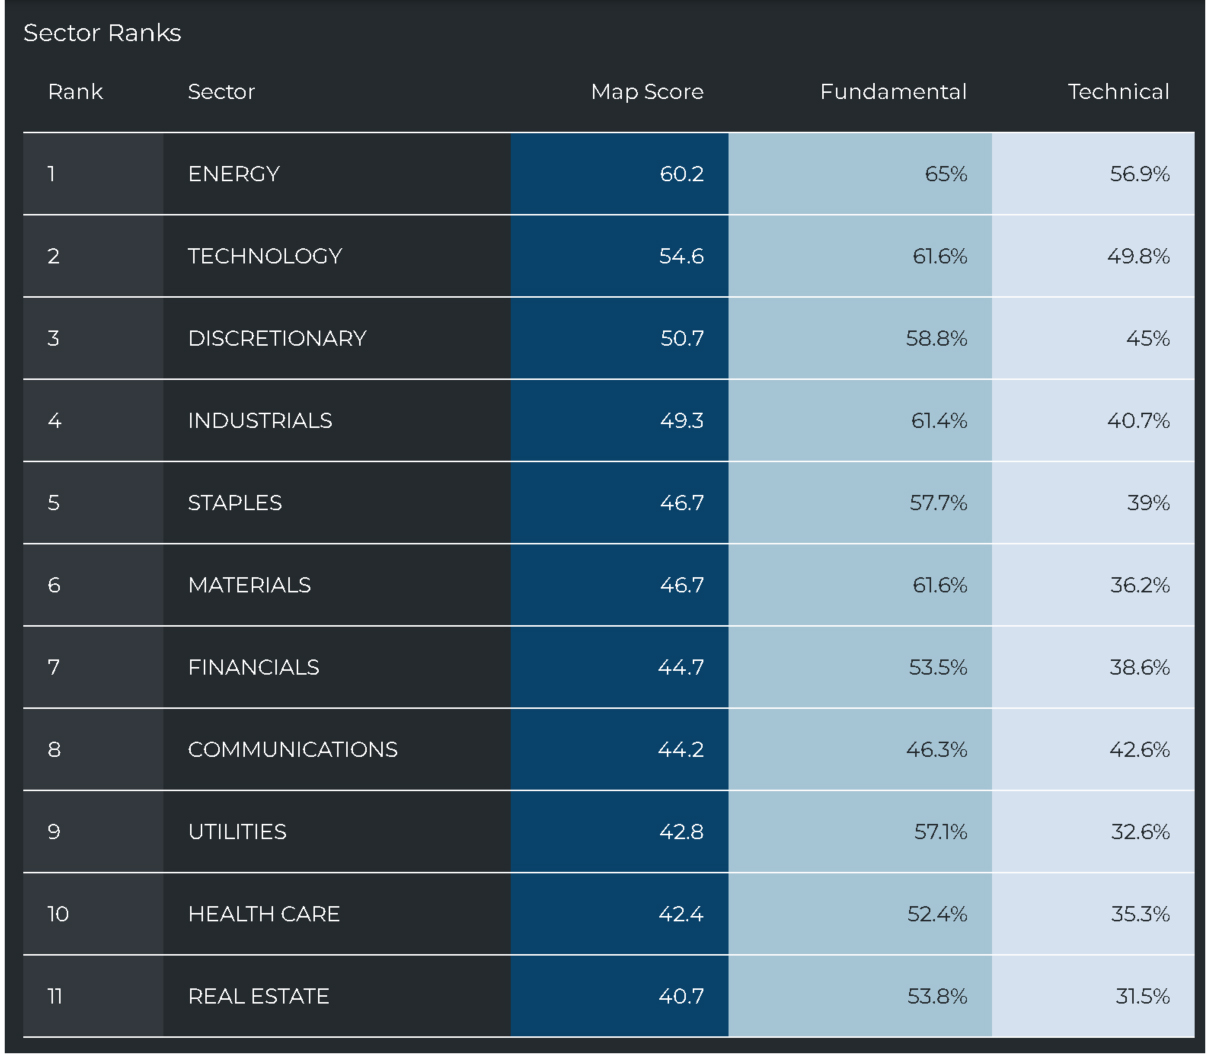
Graphs are for illustrative and discussion purposes only. Please read important disclosures at the end of this commentary.
Energy is still sector leader, the only one without significant selling. Technology has been holding up well, but it has finally come under pressure. In fact, nearly every sector is seeing red. Discretionary, Industrials, Materials, Financials, Communications, Health Care, and Real estate have all come under attack:
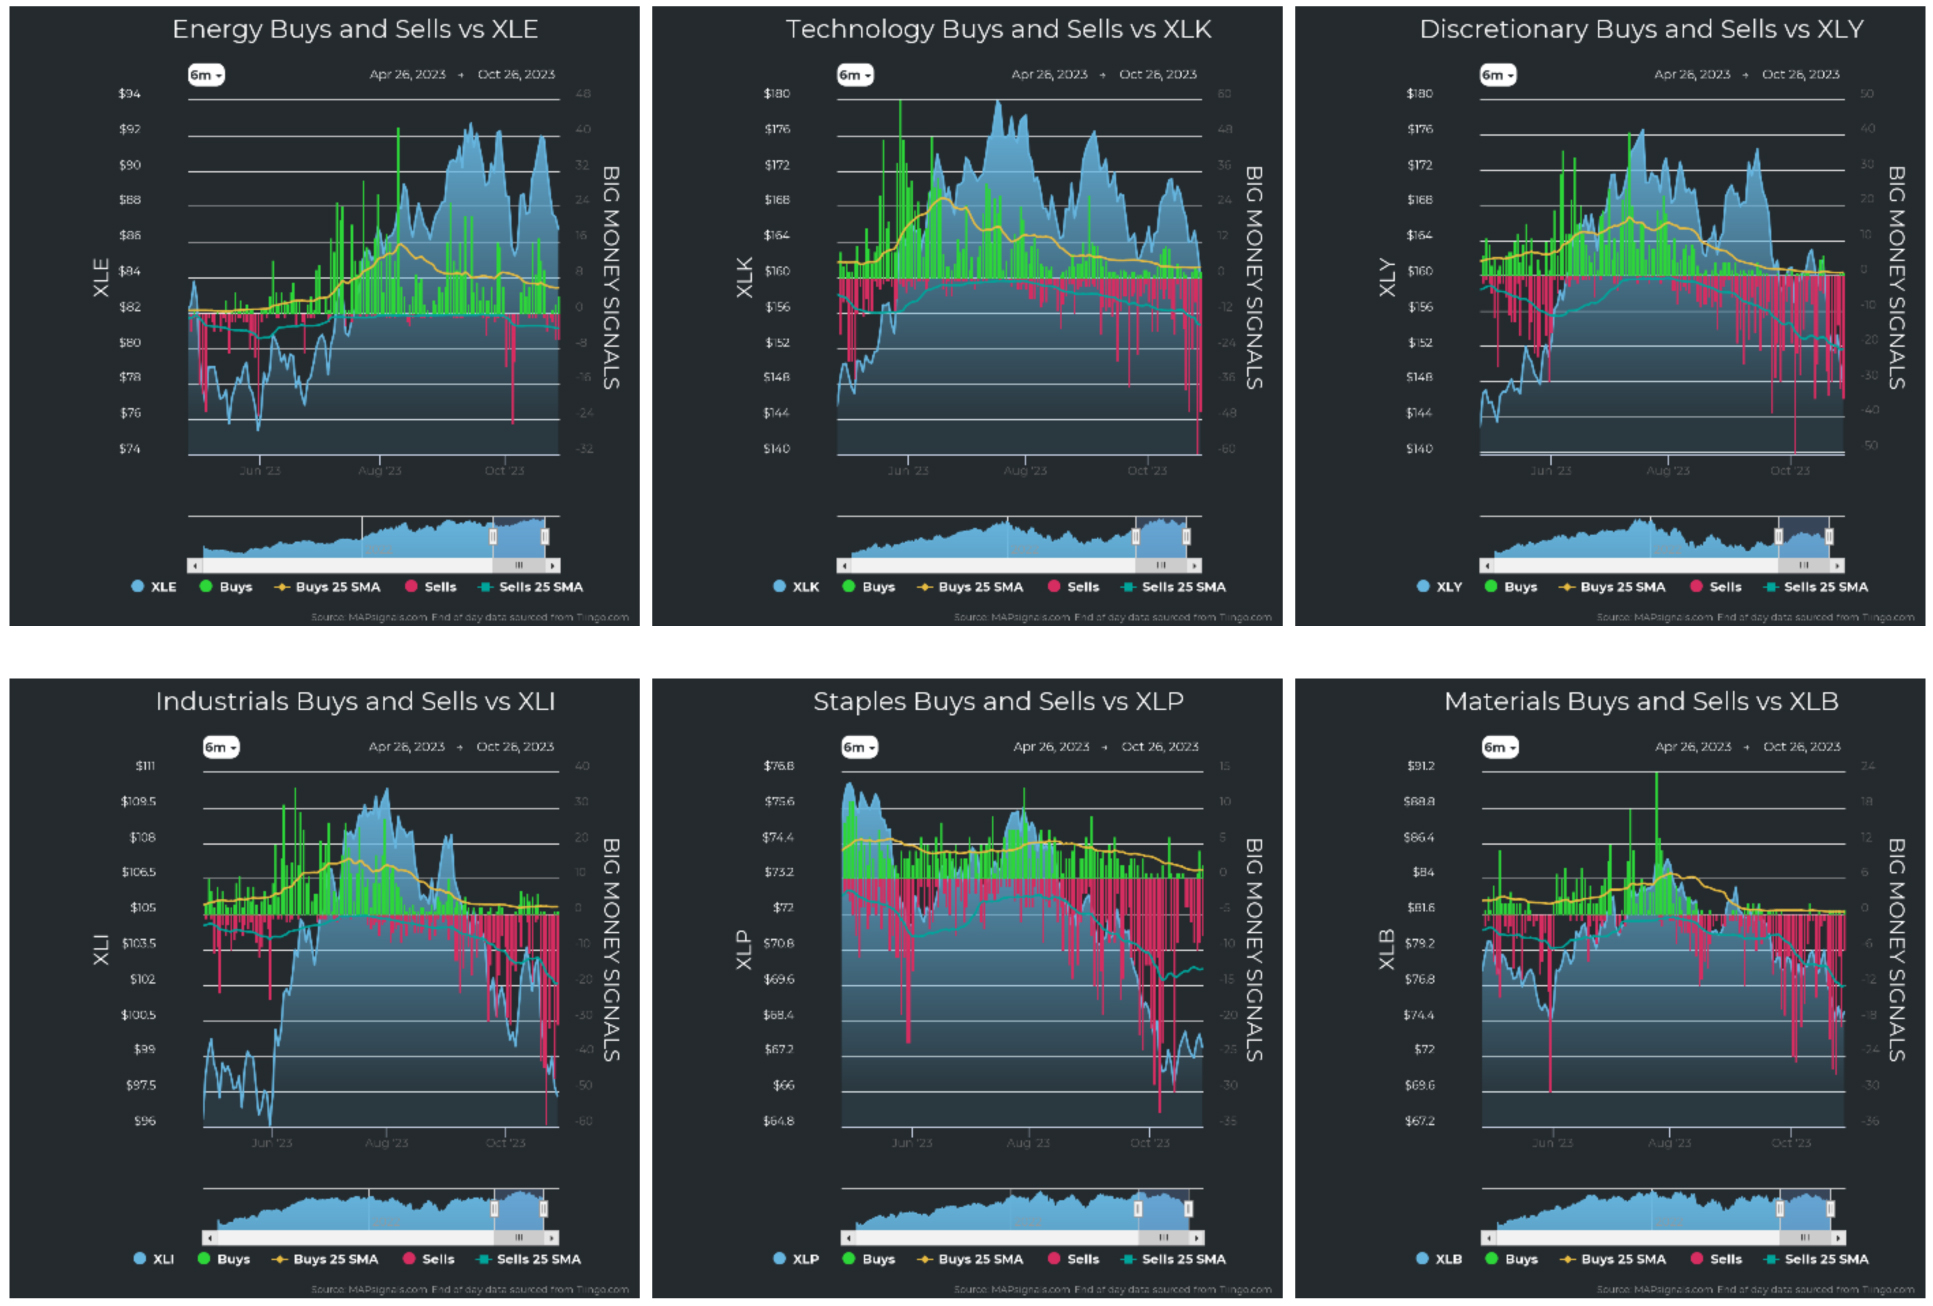
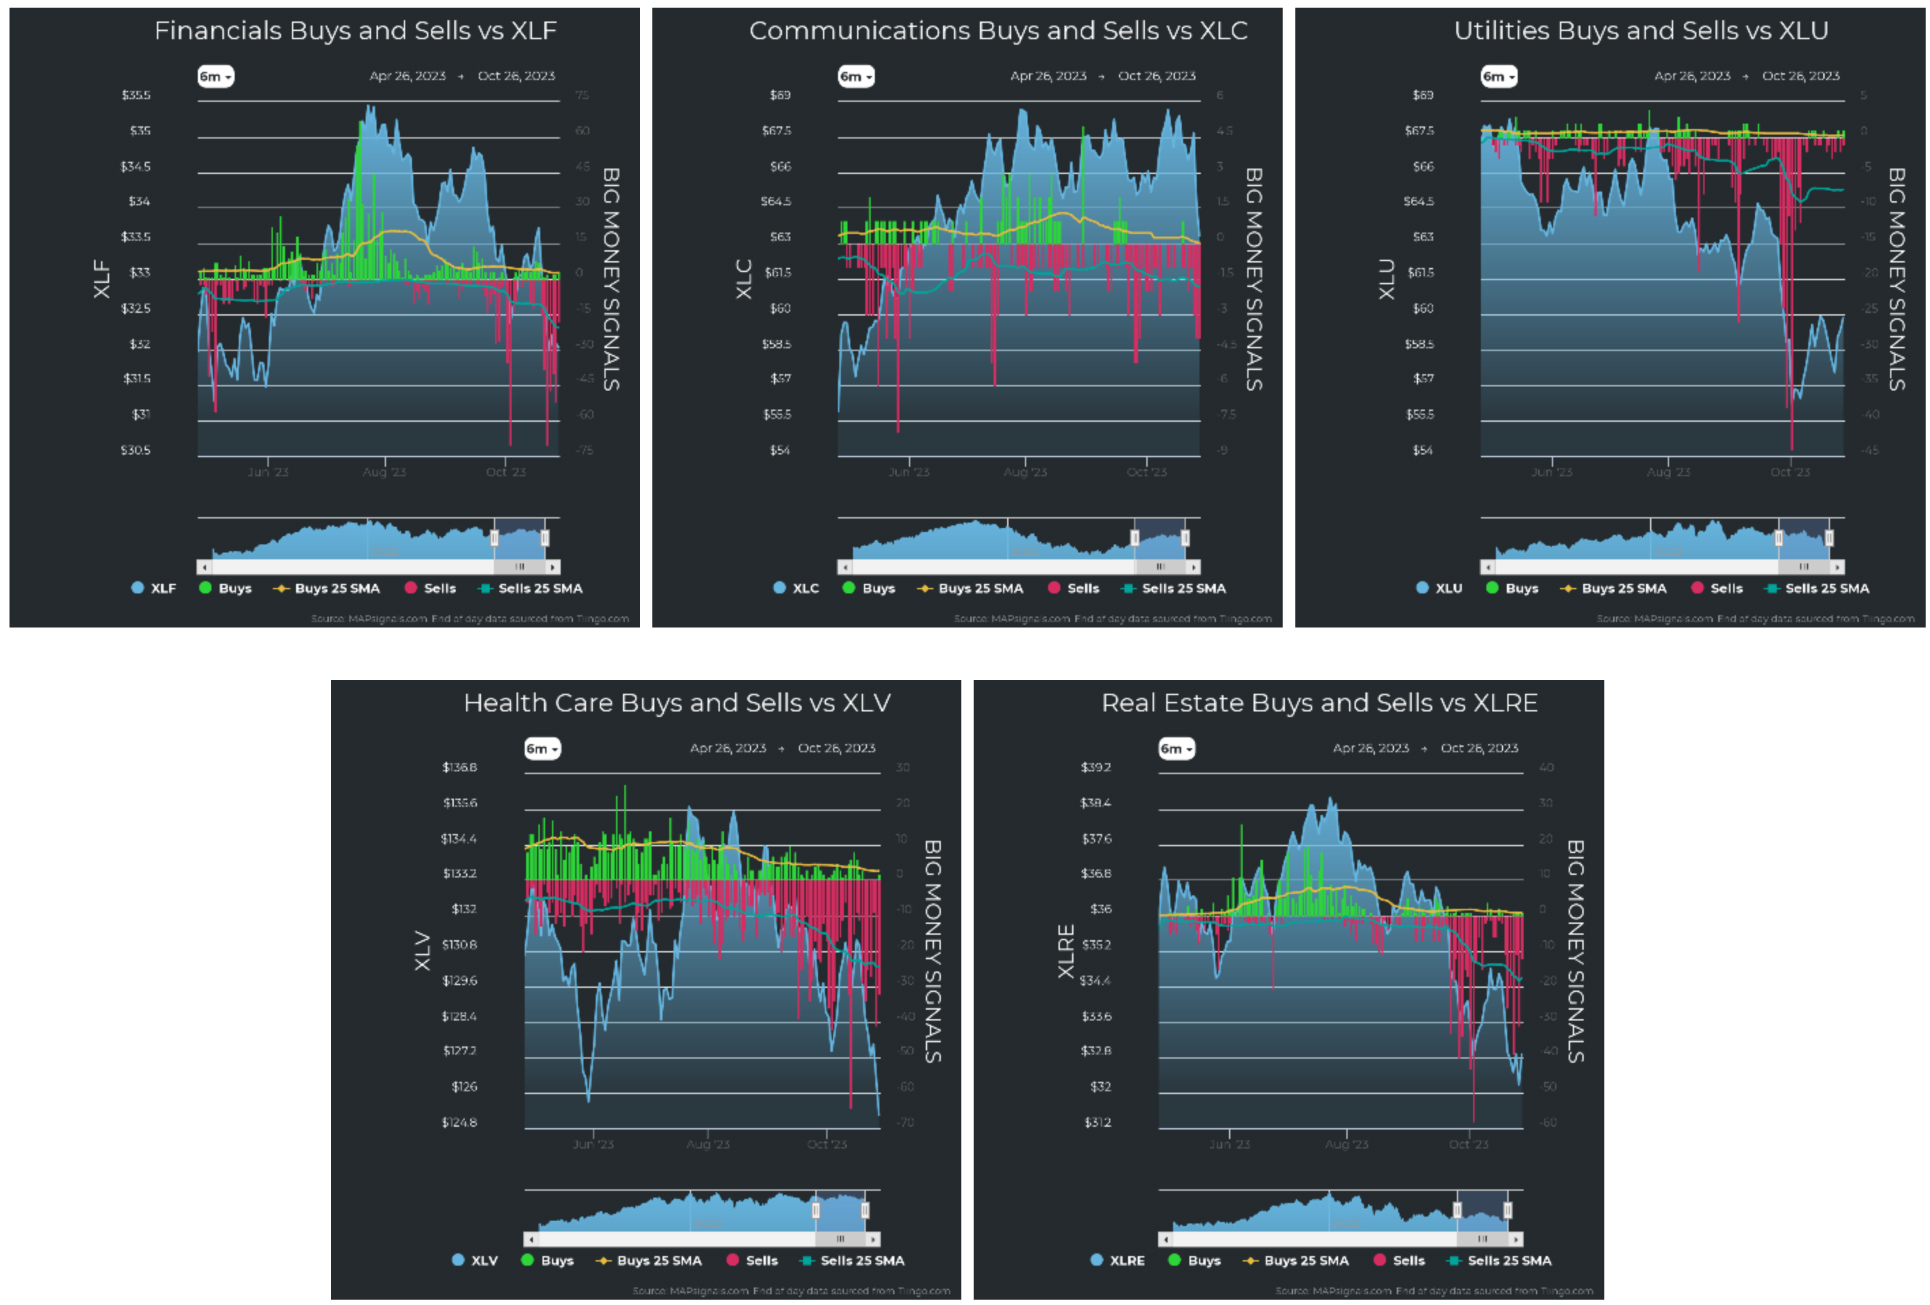
Graphs are for illustrative and discussion purposes only. Please read important disclosures at the end of this commentary.
When we look at stock prices and see that they seem to melt every day, it’s really uncomfortable. I feel myself getting anxious and worried. That’s the time to have a game plan dictated by logic and informed by data. The relevant data says that brighter days are ahead, with the odds overwhelmingly in our favor. The immediate future is unclear, but logic says the markets are near a bottom and we should remain calm.
When a plane hits turbulence, we don’t rush for the emergency exit mid-air. Why then, should we do the same with our investments? Times like now have proven to be, historically, an excellent time to buy.
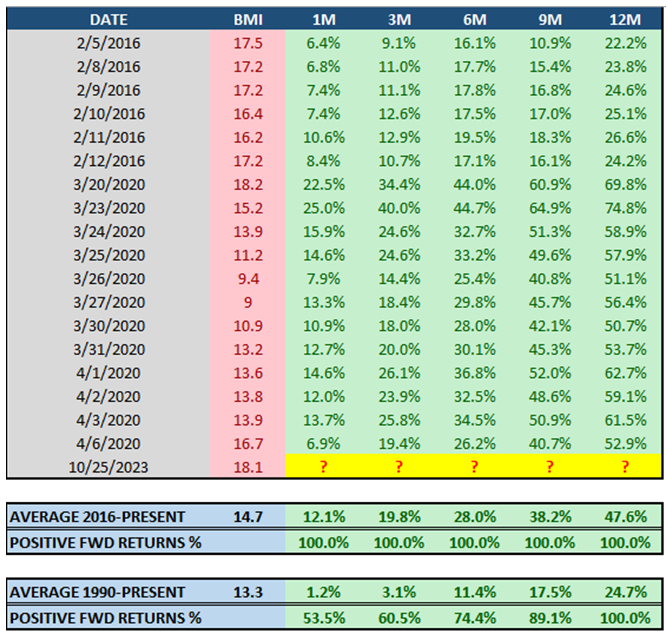
Using the BMI to time market lows has been extremely effective over the years, but trying to nail the BMI to the exact day only works once in a while – not this time. It’s like predicting when your kid is going to grow above 5 feet tall. The law of averages says, it’s around age 11 or 12 years old. But what happens when your kid is 13 and it hasn’t happened yet? Logic dictates it is a near certainty but when it’s not on time it’s disconcerting all the same. In this case, the averages said that the BMI would lift from oversold (on average) October 24th at the earliest. Clearly, that didn’t happen. But since 2016, every time the BMI fell to this level, all 18 of them, forward prices were higher 1,3,6,9, and 12 months later.
The average returns were stunning:
Graphs are for illustrative and discussion purposes only. Please read important disclosures at the end of this commentary.
If we go back further, we find similar profits. Going back to 1990, we see 129 instances of the BMI below 19 (currently, it’s 18.1) and the averages are still excellent. The 1-year returns were positive 100% of the time. This includes 1998, the tech bubble, 9/11, the Great Financial Crisis, and any crisis you can name since 1990. A year after a BMI of this level, the market was higher every time for an average 24.7% gain.
Investing using emotion would work well if we did the exact opposite of what we feel most of the time. Fear is high right now, and looking at daily price gyrations can be woeful. The plan should now be to identify great stocks on sale – ones with superior fundamentals being punished with overall market anxiety. The forward returns above tell us we have big asymmetrical upside if we buy stocks down here.
But what should be clear, I think, is that it’s time to make our shopping lists. The message is, Stay calm and use our logic-based head, and we will prevail and thrive. If we succumb to fear and make ourselves think that we feel better, history says it’s an opportunity wasted.
The Grolar-Pizzly is slashing its claws through stocks right now. The question is, What will you do about it? Epictetus said, “It’s not what happens to you, but how you react to it that matters.”
All content above represents the opinion of Jason Bodner of Navellier & Associates, Inc.
Also In This Issue
A Look Ahead by Louis Navellier
As GDP Peaks Near 5%, Is This the Last of the Booming Quarters?
Income Mail by Bryan Perry
Treasury Secretary Janet Yellen Is Talking Her Book
Growth Mail by Gary Alexander
When PIGS Fly: Europe’s Basket Cases Recover, While the U.S. Drowns in Debt
Global Mail by Ivan Martchev
Initial Signs of a Treasury Yield Top
Sector Spotlight by Jason Bodner
What Kind of Bear is This – Or is it a Bear at All?
View Full Archive
Read Past Issues Here

Jason Bodner
MARKETMAIL EDITOR FOR SECTOR SPOTLIGHT
Jason Bodner writes Sector Spotlight in the weekly Marketmail publication and has authored several white papers for the company. He is also Co-Founder of Macro Analytics for Professionals which produces proprietary equity accumulation/distribution research for its clients. Previously, Mr. Bodner served as Director of European Equity Derivatives for Cantor Fitzgerald Europe in London, then moved to the role of Head of Equity Derivatives North America for the same company in New York. He also served as S.V.P. Equity Derivatives for Jefferies, LLC. He received a B.S. in business administration in 1996, with honors, from Skidmore College as a member of the Periclean Honors Society. All content of “Sector Spotlight” represents the opinion of Jason Bodner
Important Disclosures:
Jason Bodner is a co-founder and co-owner of Mapsignals. Mr. Bodner is an independent contractor who is occasionally hired by Navellier & Associates to write an article and or provide opinions for possible use in articles that appear in Navellier & Associates weekly Market Mail. Mr. Bodner is not employed or affiliated with Louis Navellier, Navellier & Associates, Inc., or any other Navellier owned entity. The opinions and statements made here are those of Mr. Bodner and not necessarily those of any other persons or entities. This is not an endorsement, or solicitation or testimonial or investment advice regarding the BMI Index or any statements or recommendations or analysis in the article or the BMI Index or Mapsignals or its products or strategies.
Although information in these reports has been obtained from and is based upon sources that Navellier believes to be reliable, Navellier does not guarantee its accuracy and it may be incomplete or condensed. All opinions and estimates constitute Navellier’s judgment as of the date the report was created and are subject to change without notice. These reports are for informational purposes only and are not a solicitation for the purchase or sale of a security. Any decision to purchase securities mentioned in these reports must take into account existing public information on such securities or any registered prospectus.To the extent permitted by law, neither Navellier & Associates, Inc., nor any of its affiliates, agents, or service providers assumes any liability or responsibility nor owes any duty of care for any consequences of any person acting or refraining to act in reliance on the information contained in this communication or for any decision based on it.
Past performance is no indication of future results. Investment in securities involves significant risk and has the potential for partial or complete loss of funds invested. It should not be assumed that any securities recommendations made by Navellier. in the future will be profitable or equal the performance of securities made in this report. Dividend payments are not guaranteed. The amount of a dividend payment, if any, can vary over time and issuers may reduce dividends paid on securities in the event of a recession or adverse event affecting a specific industry or issuer.
None of the stock information, data, and company information presented herein constitutes a recommendation by Navellier or a solicitation to buy or sell any securities. Any specific securities identified and described do not represent all of the securities purchased, sold, or recommended for advisory clients. The holdings identified do not represent all of the securities purchased, sold, or recommended for advisory clients and the reader should not assume that investments in the securities identified and discussed were or will be profitable.
Information presented is general information that does not take into account your individual circumstances, financial situation, or needs, nor does it present a personalized recommendation to you. Individual stocks presented may not be suitable for every investor. Investment in securities involves significant risk and has the potential for partial or complete loss of funds invested. Investment in fixed income securities has the potential for the investment return and principal value of an investment to fluctuate so that an investor’s holdings, when redeemed, may be worth less than their original cost.
One cannot invest directly in an index. Index is unmanaged and index performance does not reflect deduction of fees, expenses, or taxes. Presentation of Index data does not reflect a belief by Navellier that any stock index constitutes an investment alternative to any Navellier equity strategy or is necessarily comparable to such strategies. Among the most important differences between the Indices and Navellier strategies are that the Navellier equity strategies may (1) incur material management fees, (2) concentrate its investments in relatively few stocks, industries, or sectors, (3) have significantly greater trading activity and related costs, and (4) be significantly more or less volatile than the Indices.
ETF Risk: We may invest in exchange traded funds (“ETFs”) and some of our investment strategies are generally fully invested in ETFs. Like traditional mutual funds, ETFs charge asset-based fees, but they generally do not charge initial sales charges or redemption fees and investors typically pay only customary brokerage fees to buy and sell ETF shares. The fees and costs charged by ETFs held in client accounts will not be deducted from the compensation the client pays Navellier. ETF prices can fluctuate up or down, and a client account could lose money investing in an ETF if the prices of the securities owned by the ETF go down. ETFs are subject to additional risks:
- ETF shares may trade above or below their net asset value;
- An active trading market for an ETF’s shares may not develop or be maintained;
- The value of an ETF may be more volatile than the underlying portfolio of securities the ETF is designed to track;
- The cost of owning shares of the ETF may exceed those a client would incur by directly investing in the underlying securities; and
- Trading of an ETF’s shares may be halted if the listing exchange’s officials deem it appropriate, the shares are delisted from the exchange, or the activation of market-wide “circuit breakers” (which are tied to large decreases in stock prices) halts stock trading generally.
Grader Disclosures: Investment in equity strategies involves substantial risk and has the potential for partial or complete loss of funds invested. The sample portfolio and any accompanying charts are for informational purposes only and are not to be construed as a solicitation to buy or sell any financial instrument and should not be relied upon as the sole factor in an investment making decision. As a matter of normal and important disclosures to you, as a potential investor, please consider the following: The performance presented is not based on any actual securities trading, portfolio, or accounts, and the reported performance of the A, B, C, D, and F portfolios (collectively the “model portfolios”) should be considered mere “paper” or pro forma performance results based on Navellier’s research.
Investors evaluating any of Navellier & Associates, Inc.’s, (or its affiliates’) Investment Products must not use any information presented here, including the performance figures of the model portfolios, in their evaluation of any Navellier Investment Products. Navellier Investment Products include the firm’s mutual funds and managed accounts. The model portfolios, charts, and other information presented do not represent actual funded trades and are not actual funded portfolios. There are material differences between Navellier Investment Products’ portfolios and the model portfolios, research, and performance figures presented here. The model portfolios and the research results (1) may contain stocks or ETFs that are illiquid and difficult to trade; (2) may contain stock or ETF holdings materially different from actual funded Navellier Investment Product portfolios; (3) include the reinvestment of all dividends and other earnings, estimated trading costs, commissions, or management fees; and, (4) may not reflect prices obtained in an actual funded Navellier Investment Product portfolio. For these and other reasons, the reported performances of model portfolios do not reflect the performance results of Navellier’s actually funded and traded Investment Products. In most cases, Navellier’s Investment Products have materially lower performance results than the performances of the model portfolios presented.
This report contains statements that are, or may be considered to be, forward-looking statements. All statements that are not historical facts, including statements about our beliefs or expectations, are “forward-looking statements” within the meaning of The U.S. Private Securities Litigation Reform Act of 1995. These statements may be identified by such forward-looking terminology as “expect,” “estimate,” “plan,” “intend,” “believe,” “anticipate,” “may,” “will,” “should,” “could,” “continue,” “project,” or similar statements or variations of such terms. Our forward-looking statements are based on a series of expectations, assumptions, and projections, are not guarantees of future results or performance, and involve substantial risks and uncertainty as described in Form ADV Part 2A of our filing with the Securities and Exchange Commission (SEC), which is available at www.adviserinfo.sec.gov or by requesting a copy by emailing info@navellier.com. All of our forward-looking statements are as of the date of this report only. We can give no assurance that such expectations or forward-looking statements will prove to be correct. Actual results may differ materially. You are urged to carefully consider all such factors.
FEDERAL TAX ADVICE DISCLAIMER: As required by U.S. Treasury Regulations, you are informed that, to the extent this presentation includes any federal tax advice, the presentation is not written by Navellier to be used, and cannot be used, for the purpose of avoiding federal tax penalties. Navellier does not advise on any income tax requirements or issues. Use of any information presented by Navellier is for general information only and does not represent tax advice either express or implied. You are encouraged to seek professional tax advice for income tax questions and assistance.
IMPORTANT NEWSLETTER DISCLOSURE:The hypothetical performance results for investment newsletters that are authored or edited by Louis Navellier, including Louis Navellier’s Growth Investor, Louis Navellier’s Breakthrough Stocks, Louis Navellier’s Accelerated Profits, and Louis Navellier’s Platinum Club, are not based on any actual securities trading, portfolio, or accounts, and the newsletters’ reported hypothetical performances should be considered mere “paper” or proforma hypothetical performance results and are not actual performance of real world trades. Navellier & Associates, Inc. does not have any relation to or affiliation with the owner of these newsletters. There are material differences between Navellier Investment Products’ portfolios and the InvestorPlace Media, LLC newsletter portfolios authored by Louis Navellier. The InvestorPlace Media, LLC newsletters contain hypothetical performance that do not include transaction costs, advisory fees, or other fees a client might incur if actual investments and trades were being made by an investor. As a result, newsletter performance should not be used to evaluate Navellier Investment services which are separate and different from the newsletters. The owner of the newsletters is InvestorPlace Media, LLC and any questions concerning the newsletters, including any newsletter advertising or hypothetical Newsletter performance claims, (which are calculated solely by Investor Place Media and not Navellier) should be referred to InvestorPlace Media, LLC at (800) 718-8289.
Please note that Navellier & Associates and the Navellier Private Client Group are managed completely independent of the newsletters owned and published by InvestorPlace Media, LLC and written and edited by Louis Navellier, and investment performance of the newsletters should in no way be considered indicative of potential future investment performance for any Navellier & Associates separately managed account portfolio. Potential investors should consult with their financial advisor before investing in any Navellier Investment Product.
Navellier claims compliance with Global Investment Performance Standards (GIPS). To receive a complete list and descriptions of Navellier’s composites and/or a presentation that adheres to the GIPS standards, please contact Navellier or click here. It should not be assumed that any securities recommendations made by Navellier & Associates, Inc. in the future will be profitable or equal the performance of securities made in this report.
FactSet Disclosure: Navellier does not independently calculate the statistical information included in the attached report. The calculation and the information are provided by FactSet, a company not related to Navellier. Although information contained in the report has been obtained from FactSet and is based on sources Navellier believes to be reliable, Navellier does not guarantee its accuracy, and it may be incomplete or condensed. The report and the related FactSet sourced information are provided on an “as is” basis. The user assumes the entire risk of any use made of this information. Investors should consider the report as only a single factor in making their investment decision. The report is for informational purposes only and is not intended as an offer or solicitation for the purchase or sale of a security. FactSet sourced information is the exclusive property of FactSet. Without prior written permission of FactSet, this information may not be reproduced, disseminated or used to create any financial products. All indices are unmanaged and performance of the indices include reinvestment of dividends and interest income, unless otherwise noted, are not illustrative of any particular investment and an investment cannot be made in any index. Past performance is no guarantee of future results.