by Jason Bodner
October 3, 2023
I have good news and bad news for you. Which do you want to hear first? Apparently, it matters which one you hear first. According to one psychological study, people who get the bad news first end up in a better mood after hearing both. Those who get good news first aren’t likely to be encouraged in the end.
So, bad news first then? We might not be out of the woods just yet. September has been an ugly month for the market with the S&P troughing down 4.9% from August’s close, and NASDAQ down 5.8%. Most would say, “OK, that’s over! Thank you!” But based on the latest readings from the Big Money Index (BMI), the storm might not have passed just yet. Having a good October doesn’t mean the good news starts on the first day of October. We didn’t bottom out in the S&P 500 until the 12th day of October last year.
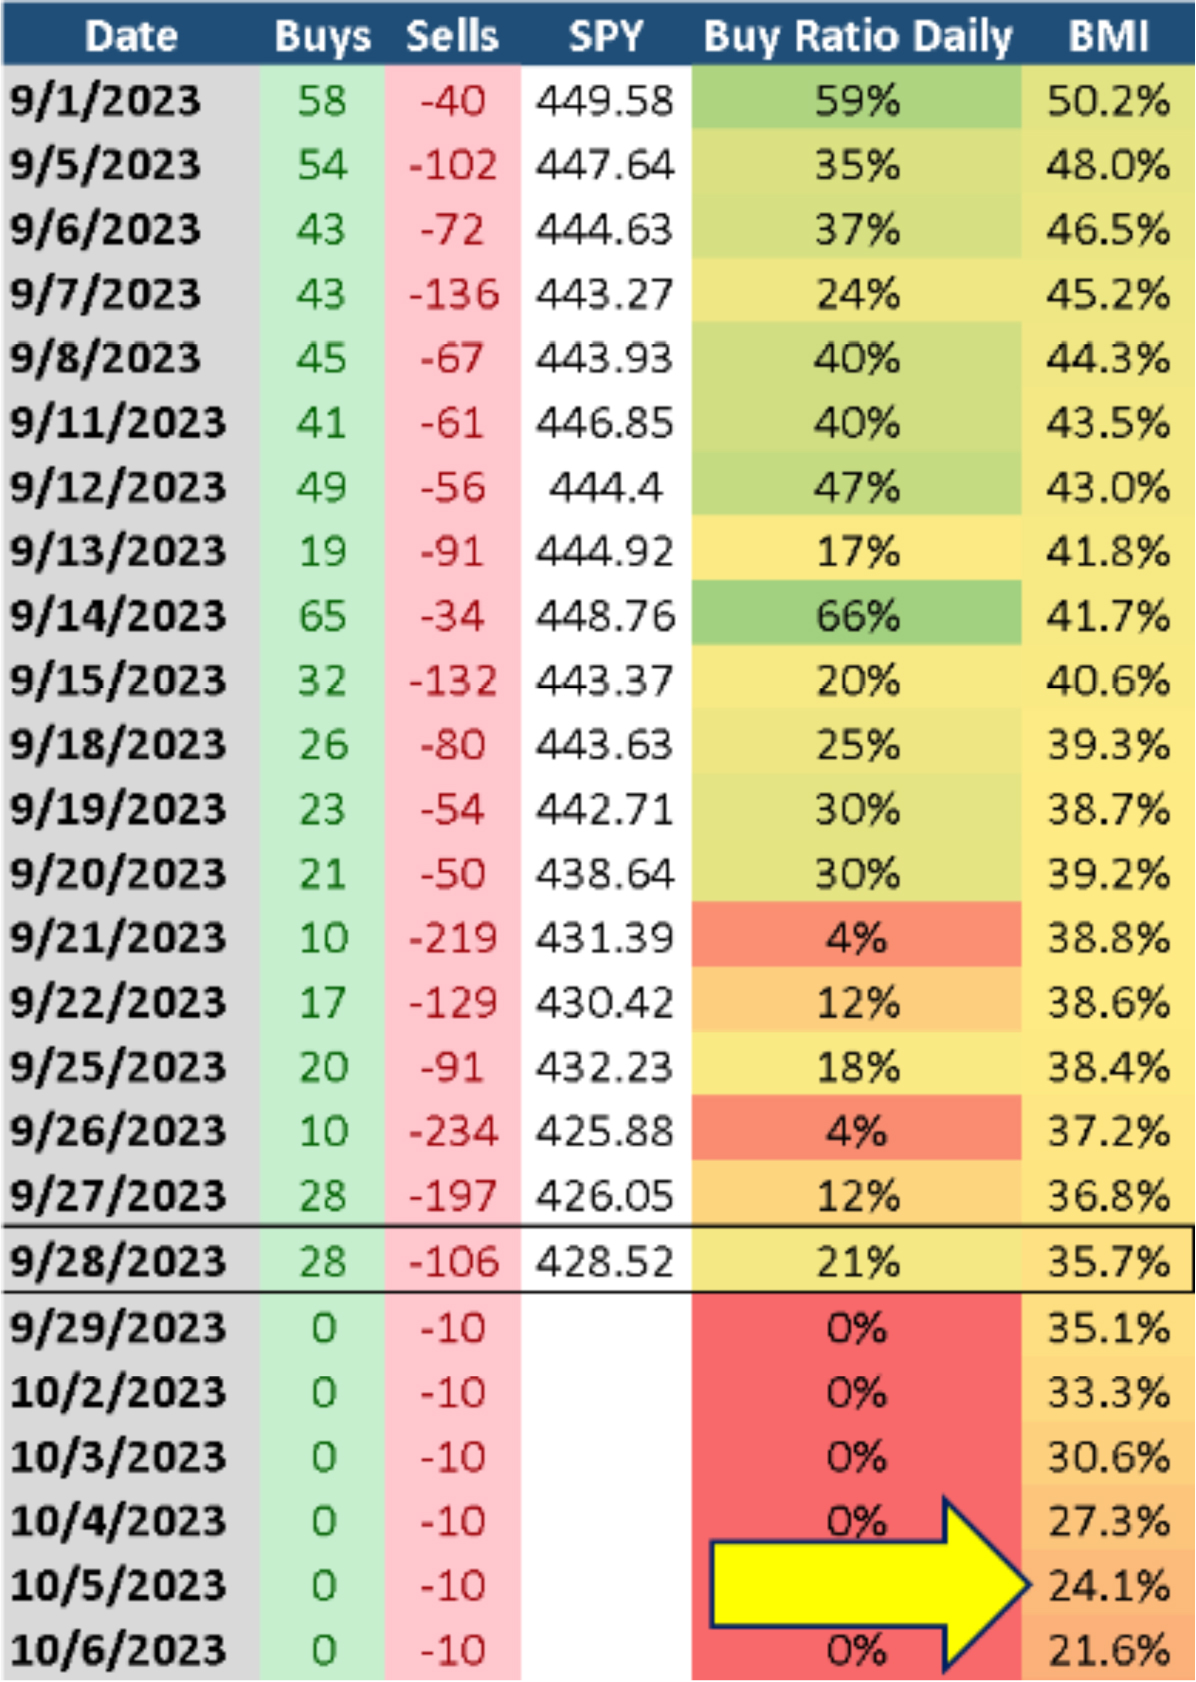
The BMI on September 28th was 35.7. The bad news is that it is still falling. In the table below, we give some insights into how the BMI is calculated. Each day has a buy/sell ratio. The BMI is the 25-day-moving-average. As sellers have taken control, and buying has waned, the BMI has unsurprisingly fallen.
And it continues to fall. History tells us that lower prices accompany a falling BMI. If I “force” the BMI into oversold territory (25% or less) by hypothetically having 100% sell days in the coming week, the soonest we can go oversold would be October 5th. That means potentially another ugly week ahead.
That’s the bad news…
Graphs are for illustrative and discussion purposes only. Please read important disclosures at the end of this commentary.
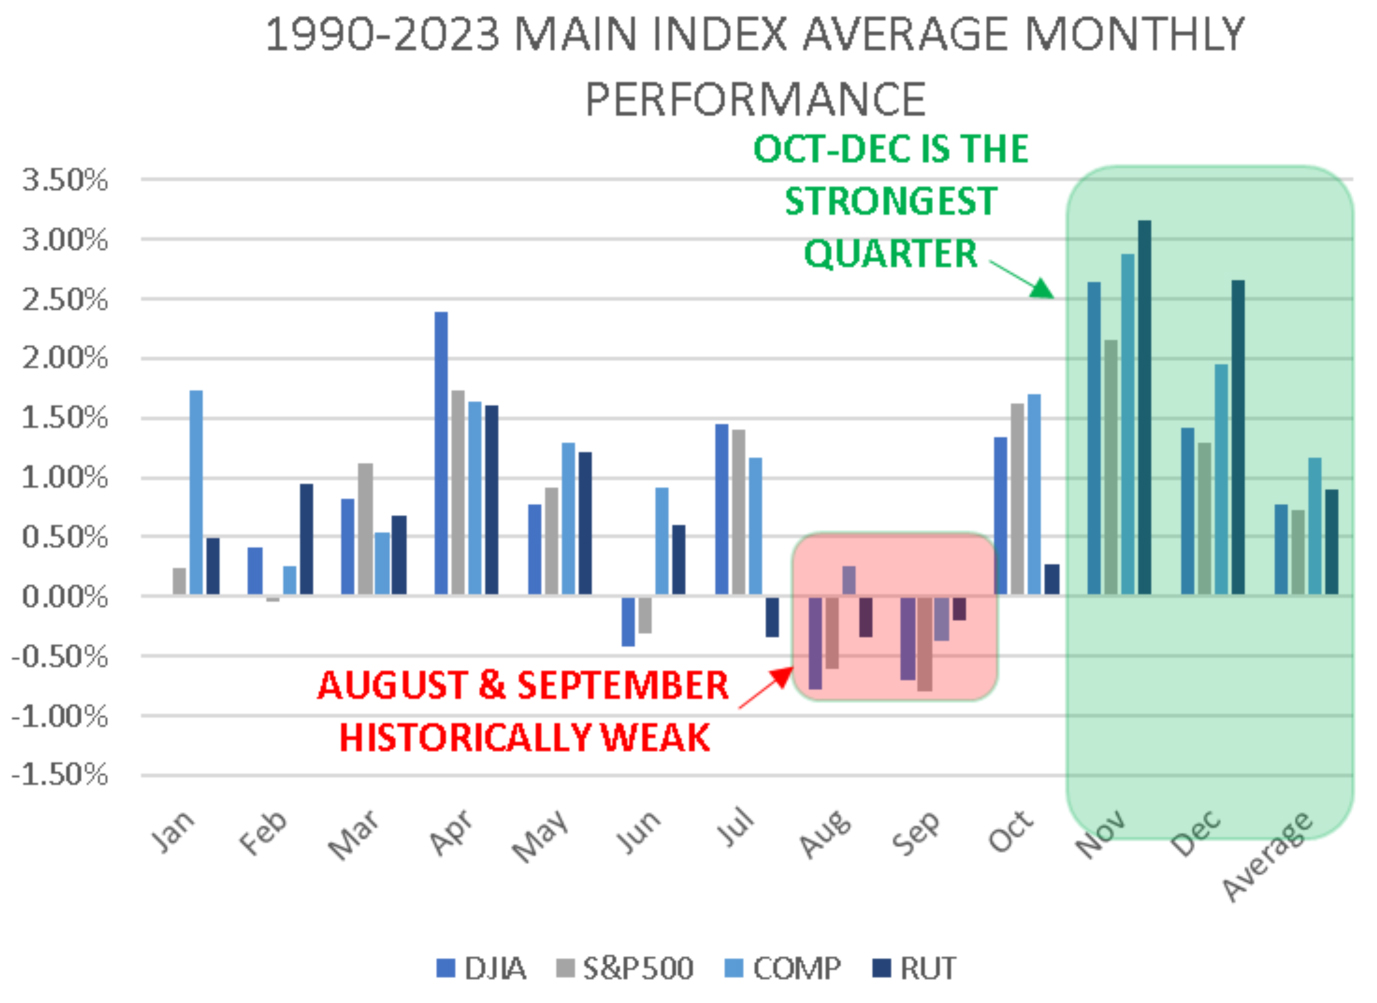
Or is it good news, after all? September is over, and October through December are contributors to the best quarter. I’m sure you’ve seen this chart before, but here’s another look.
Graphs are for illustrative and discussion purposes only. Please read important disclosures at the end of this commentary.
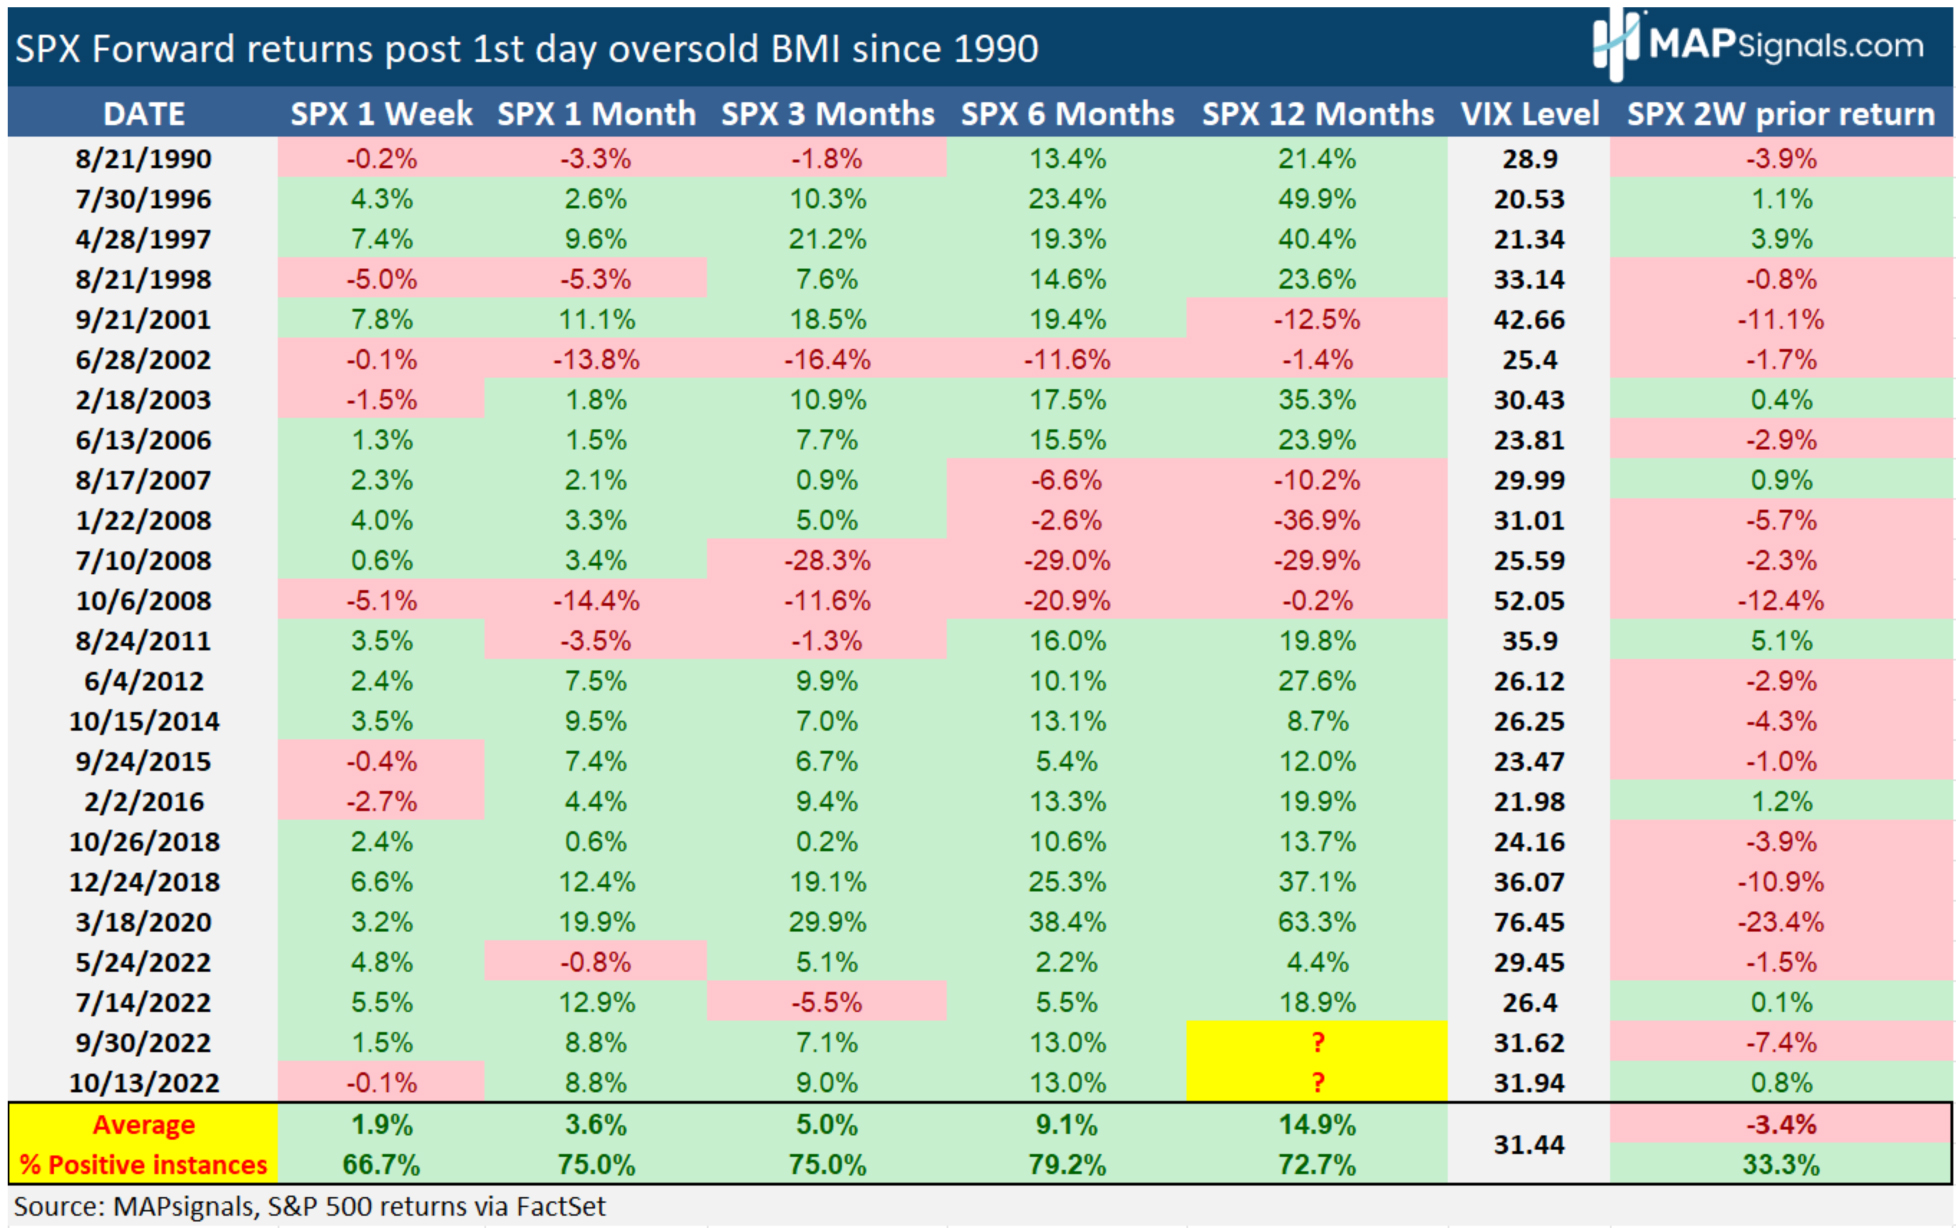
Another reason why a near oversold BMI is good news is because, if you’re familiar with the BMI, you’re familiar with what a powerful forward indicator it is – especially when it hits oversold levels.
Forward returns are significantly higher by an astonishingly high percentage of the time after the BMI goes oversold. The average forward returns are in the bottom boxed portion of the chart below.
Graphs are for illustrative and discussion purposes only. Please read important disclosures at the end of this commentary.
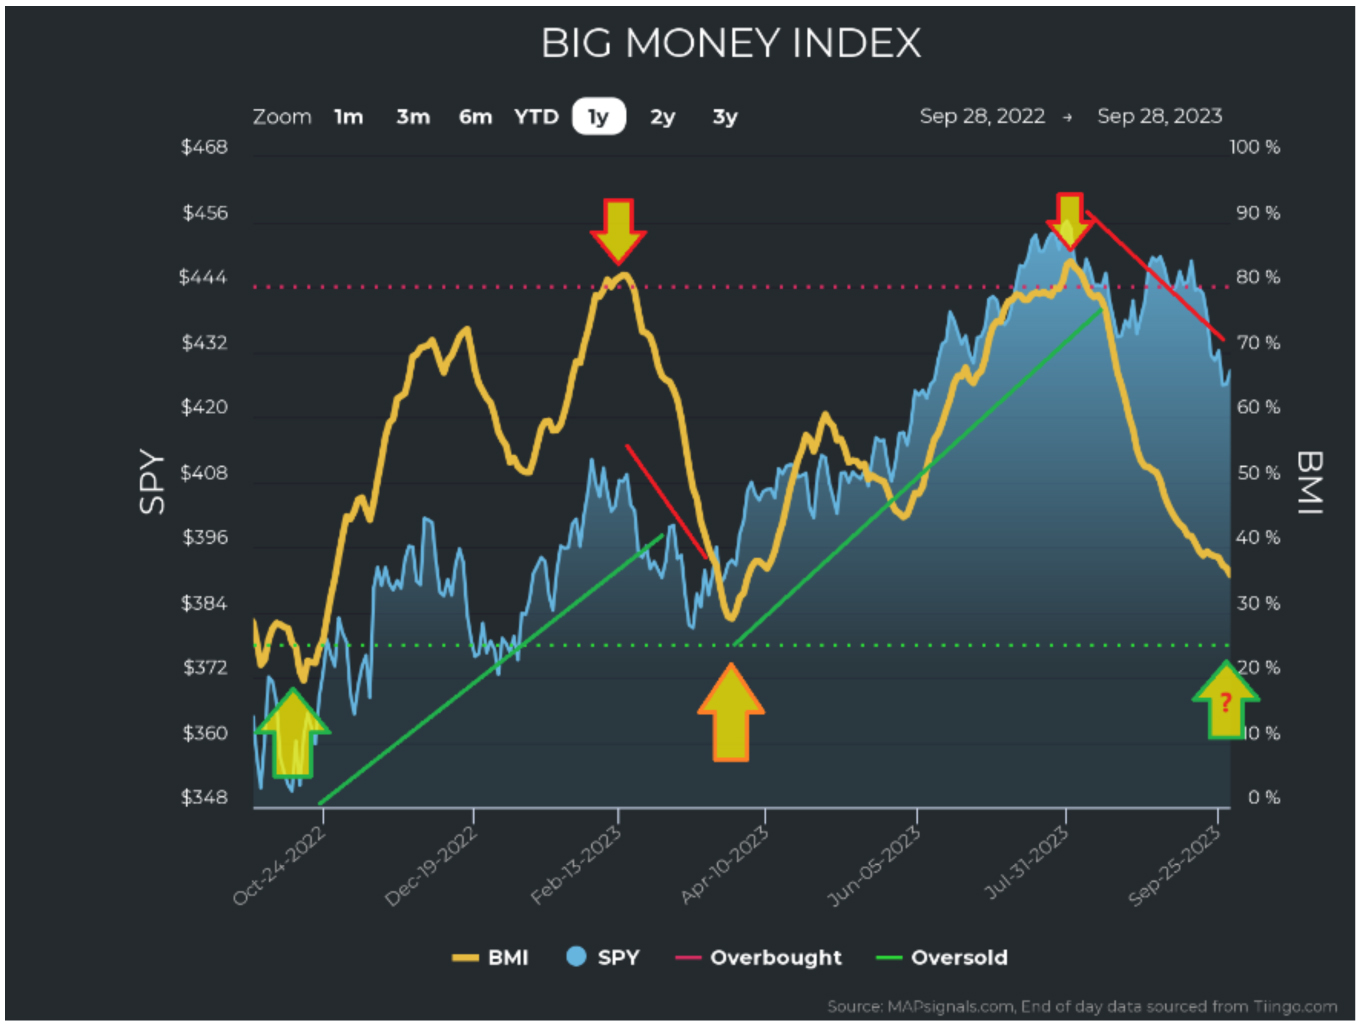
We see this in the past 12 months, below. When the BMI goes oversold – markets tend to zoom thereafter:
Graphs are for illustrative and discussion purposes only. Please read important disclosures at the end of this commentary.
We see this again when we look at a 3-year chart of buying and selling. We see clearly that extreme selling (the huge red bars) preface market rises thereafter:
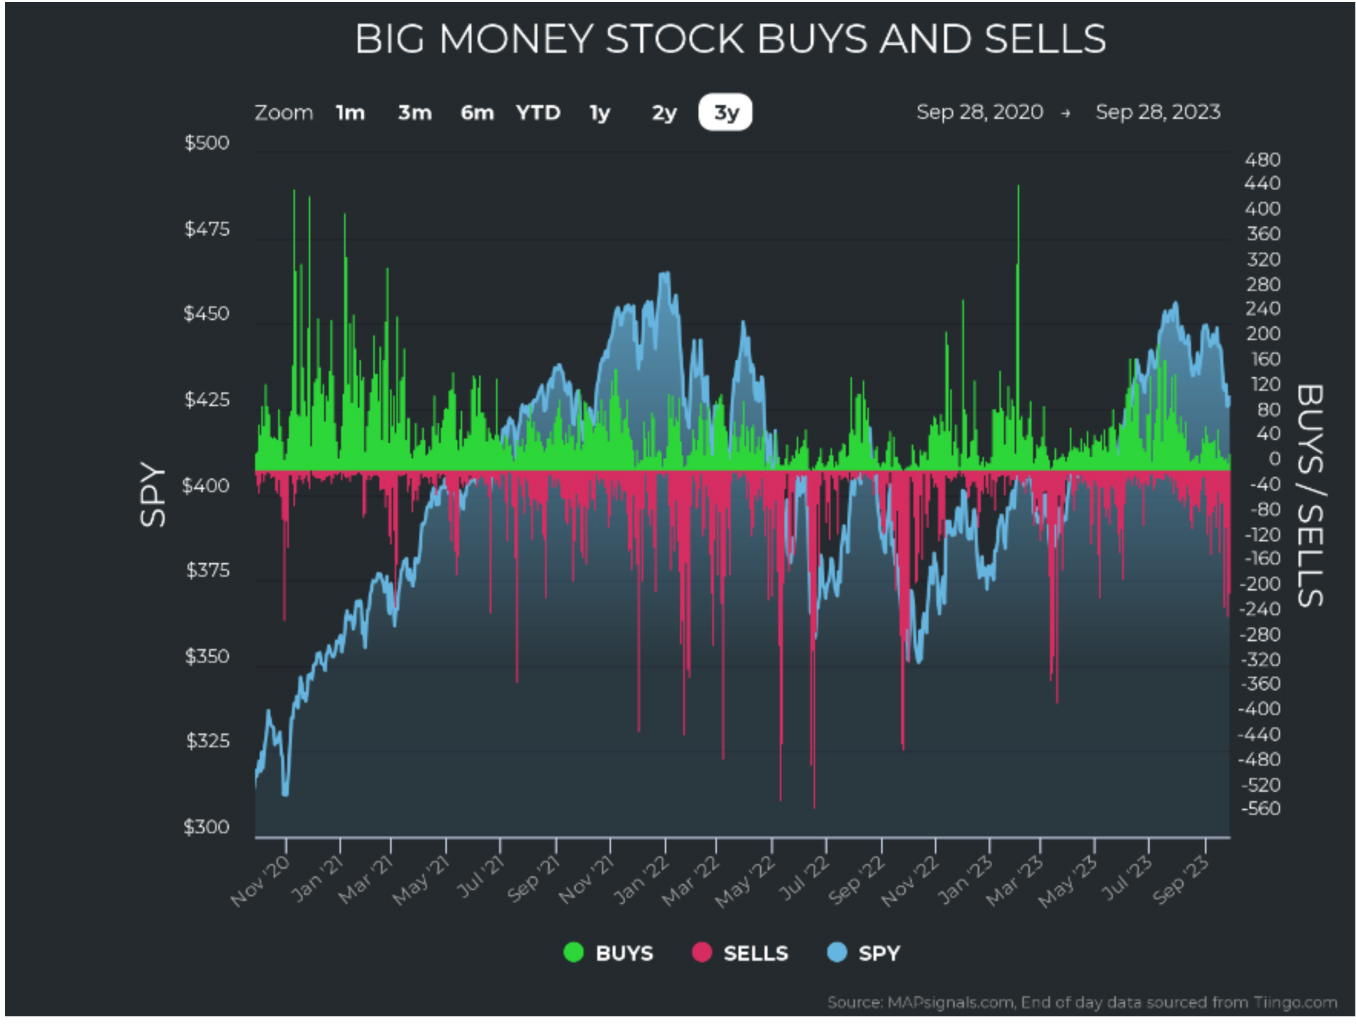
Graphs are for illustrative and discussion purposes only. Please read important disclosures at the end of this commentary.
The possibility remains that we don’t in fact, go oversold, just like in April, above. We came close, but when buyers stepped in and reversed the tide of the BMI, it was huge rally.
Since the BMI went oversold last October 12, the S&P 500 gained nearly 21%.
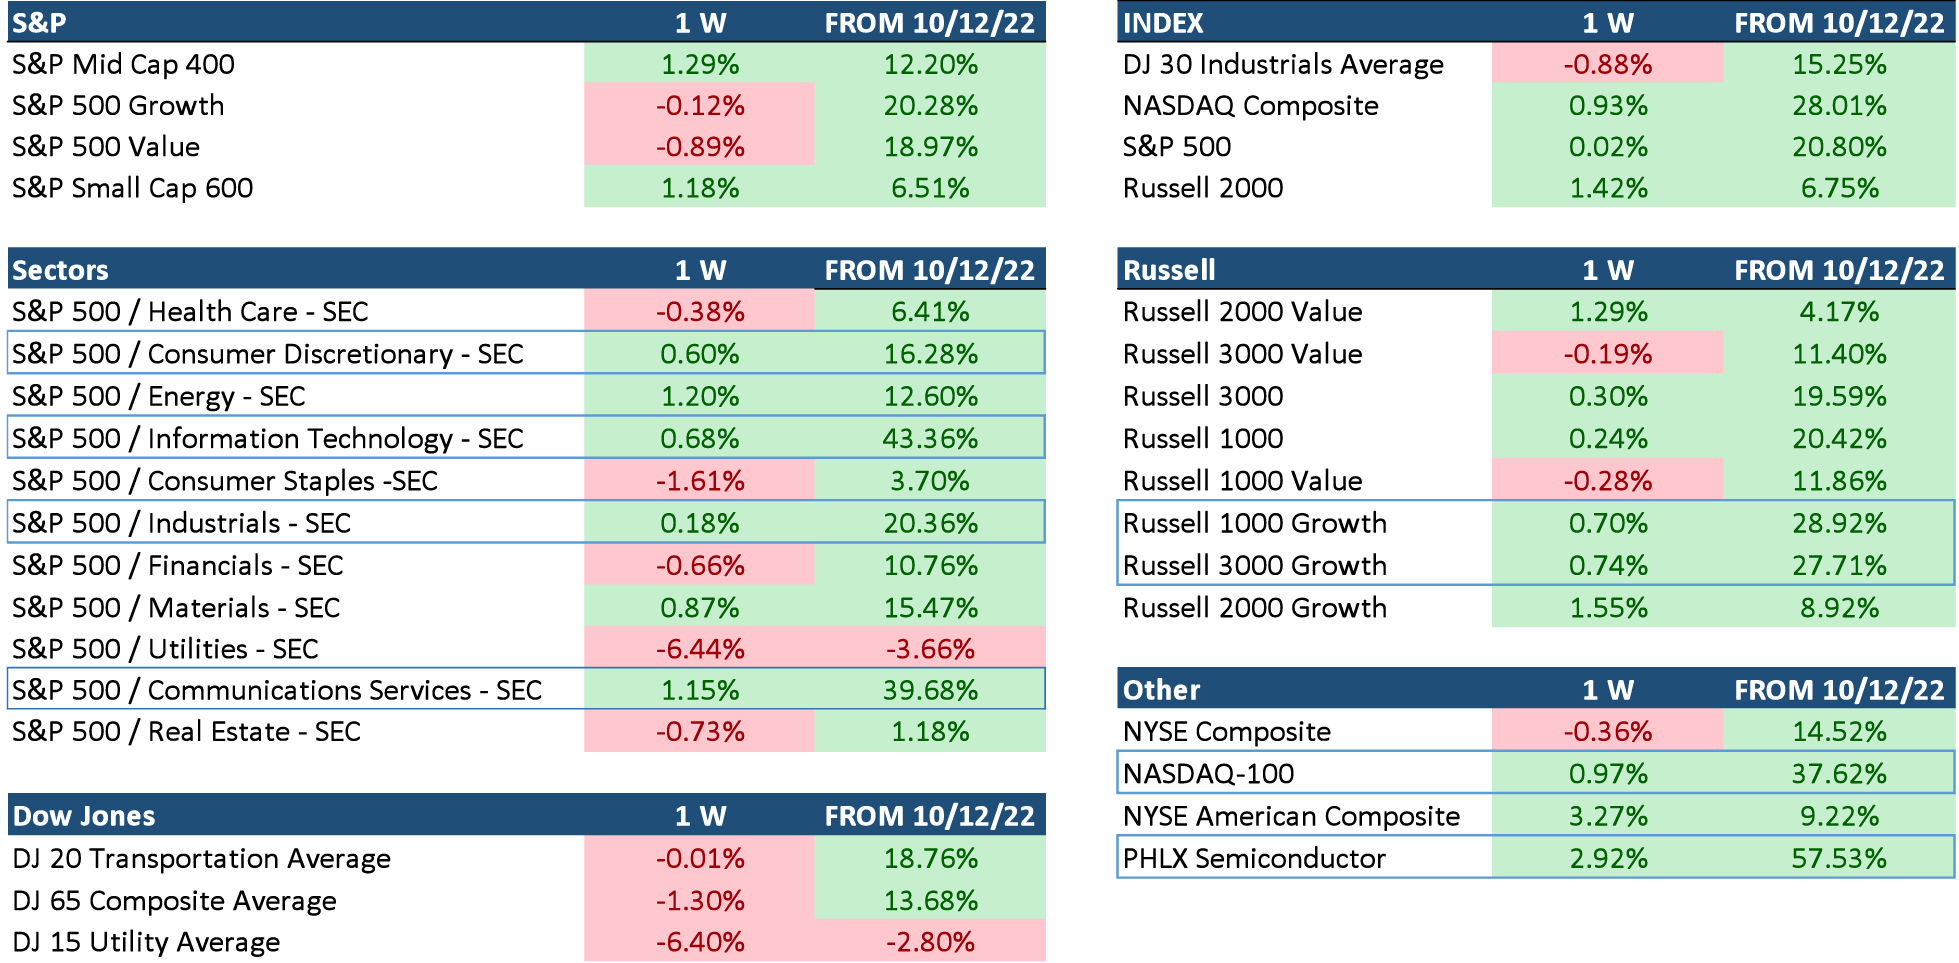
Graphs are for illustrative and discussion purposes only. Please read important disclosures at the end of this commentary.
You can also see that, despite the summer volatility, all indexes above, save one, are up since then, many of them substantially. I have boxed the best performers in blue. They are mostly growth areas.
Yet, while we look to the future, we shouldn’t ignore the present. There has been some wicked selling going on lately. There has been only one real bright spot: Energy. You can see clearly that this single sector is the only one showing signs of life. On the flip-side, all other sectors are feeling the burn.
Utilities and Real Estate, in particular, are getting clocked.
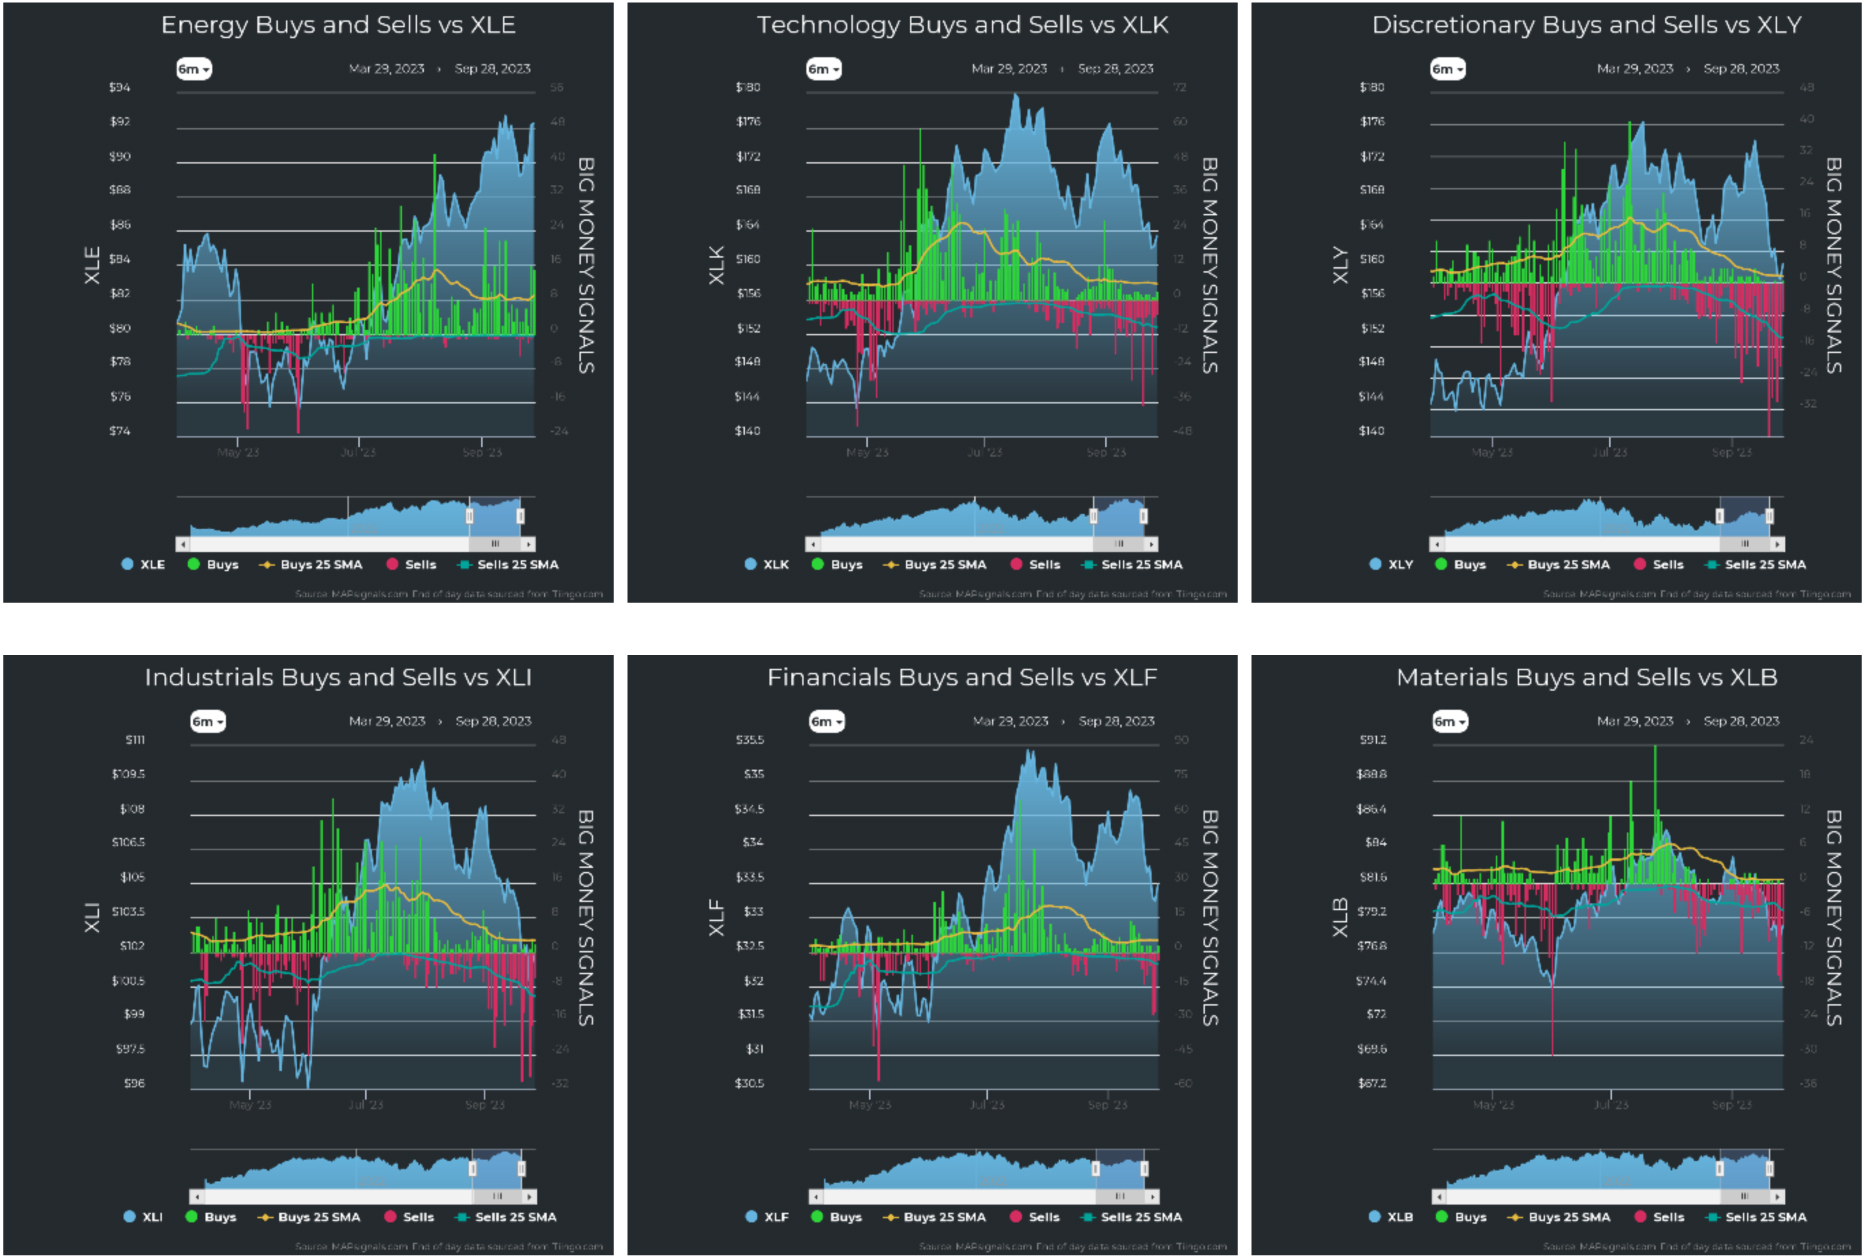
Graphs are for illustrative and discussion purposes only. Please read important disclosures at the end of this commentary.
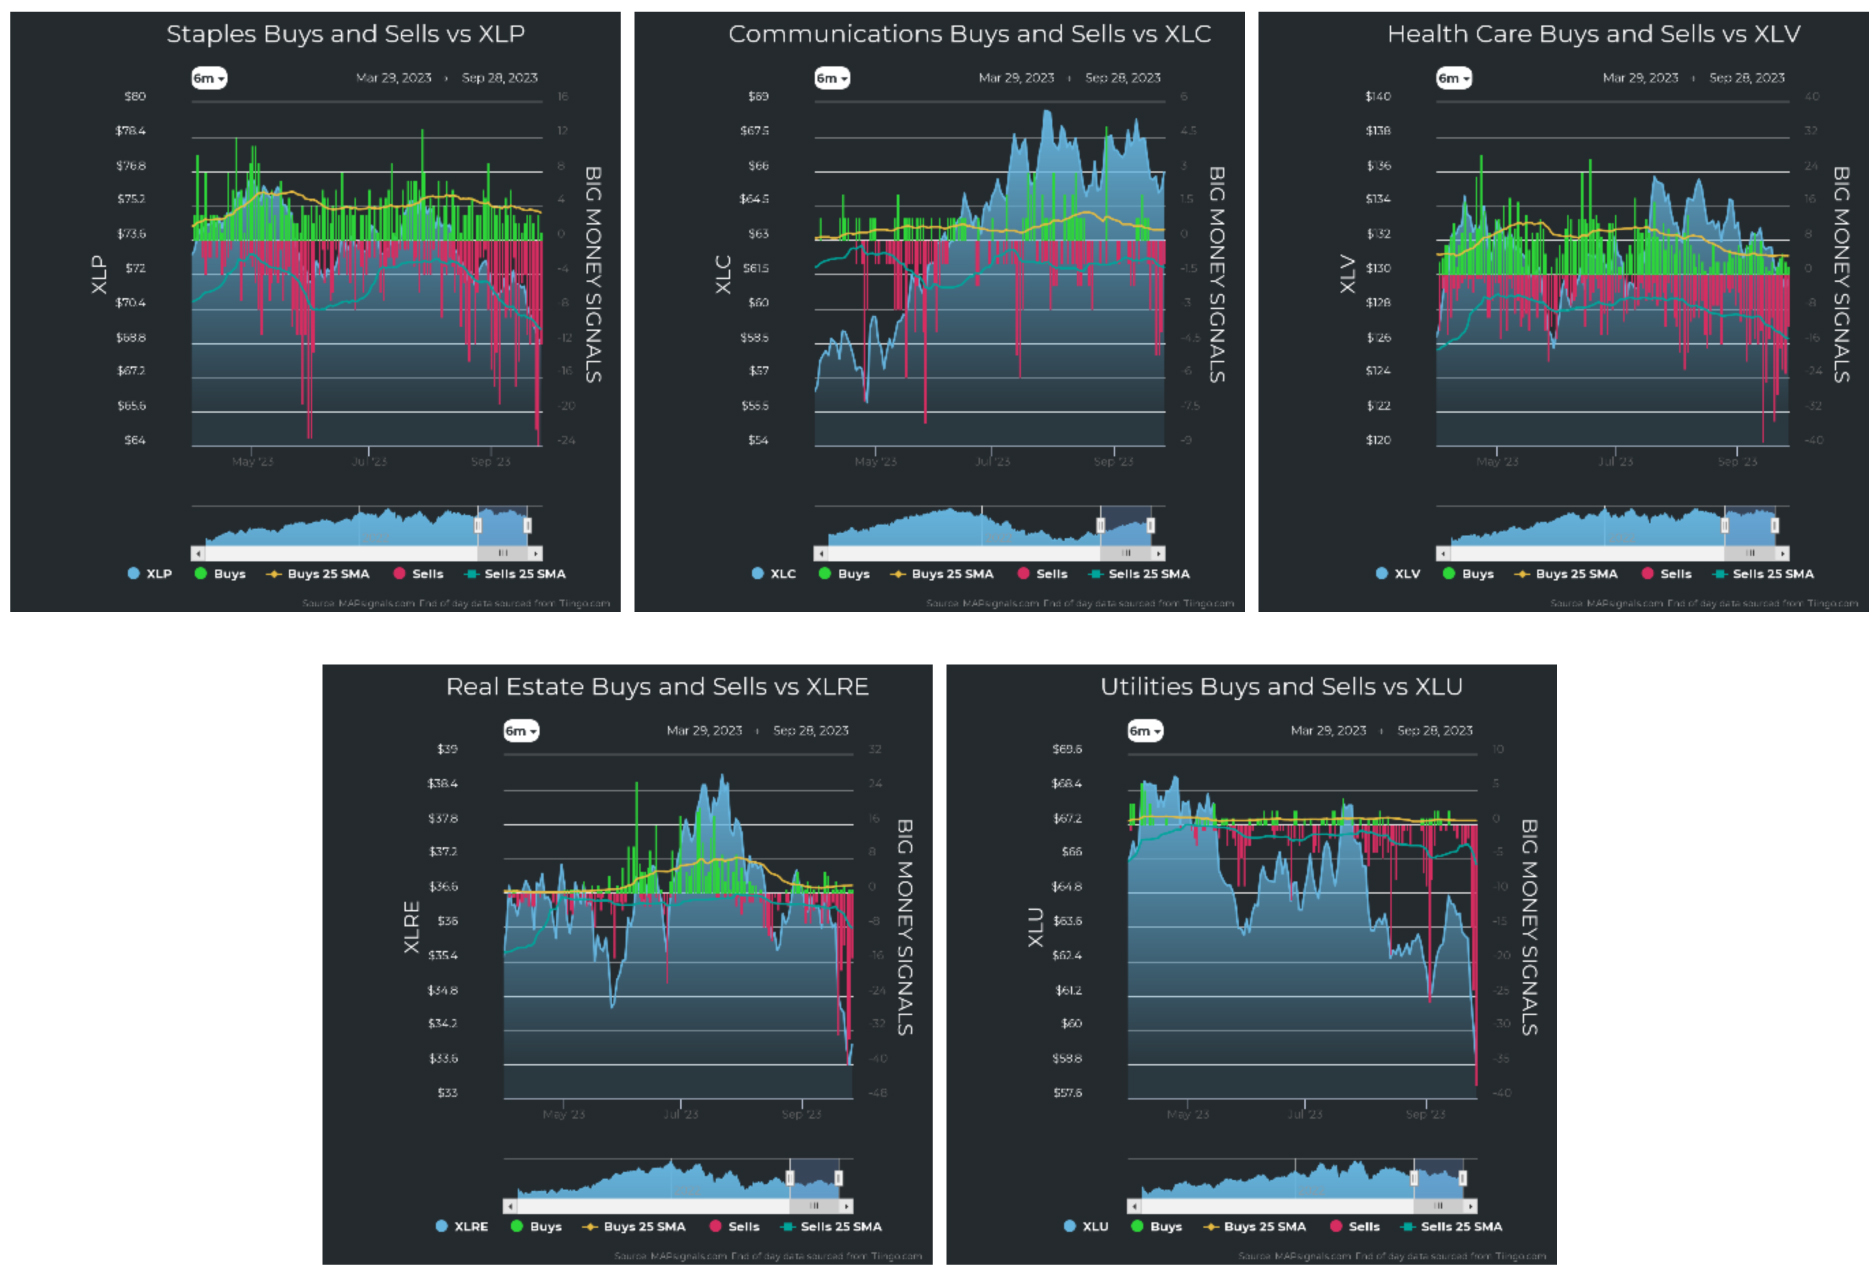
Ugly as that may seem, when Utilities get sold into oblivion, like right now, it prefaces a pretty swift snap back, as can be seen in the 3-year Utilities chart below:
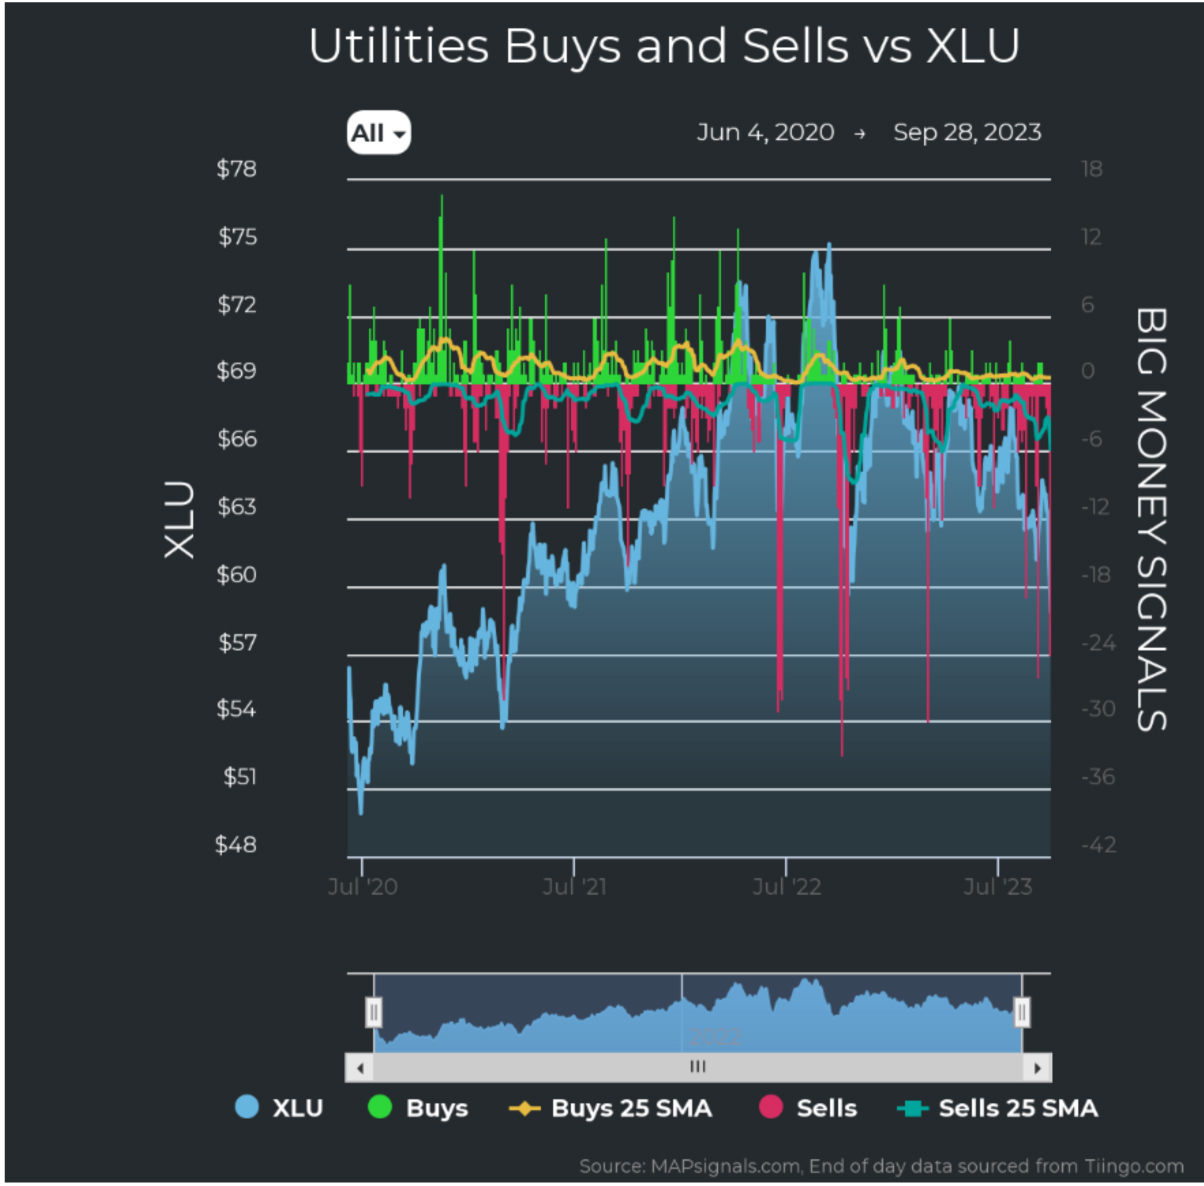
Graphs are for illustrative and discussion purposes only. Please read important disclosures at the end of this commentary.
These typically yield-intensive securities also have the happy side effect of providing exploding dividend yields as the stocks get pummeled. This makes them more and more attractive the lower they go.
And let’s be real here: Utilities won’t go away. We all need power in our homes and our lives.
Utilities and Real Estate are just the worst of the market-wide (excepting energy) selling that we are experiencing. I write this off to typical summer shenanigans.
I predicted this in July, as the market was busy frothily peaking. Since August 1st, look at the amount of sell signals. And look how they are all almost exclusively concentrated in small and mid-caps:
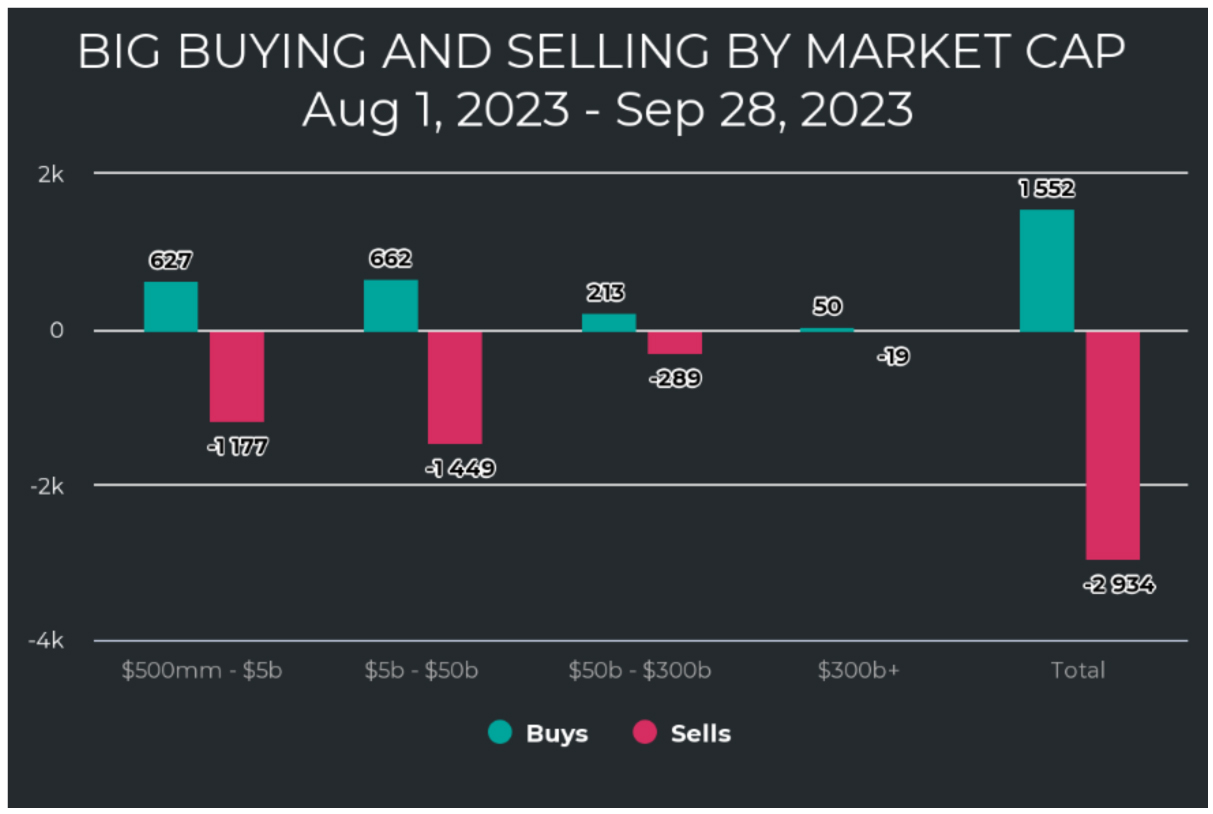
Graphs are for illustrative and discussion purposes only. Please read important disclosures at the end of this commentary.
This is where I see the opportunity for a fourth-quarter recovery coming. Again, this is based on decades of strong seasonal historical data. But as the season turns the page into fall and winter, I expect a strong tech-led rally with concentrated buying in the small and mid-cap regions, starting likely in November.
There are already some signs the tide is turning. Since September, the market was worried about a government shutdown. Apparently, that’s in the rear-view mirror. Rate hike fears, geopolitical tensions, and all the usual monsters are still under the bed. But this will always be in the background until we are all no longer monitoring market noise. Fear and greed are still the life blood of the stock market.
This is all well and good, but I live by data. The data says we are in a BMI downdraft which means possible near-term pain and then multi-month gain. So now is the time to start identifying deals you may want to take advantage of. While there are no guarantees in life, the landscape is tilted asymmetrically in favor of price appreciation in the near future. That’s not only rare, but it’s reliable and accurate.
I am looking at oversold areas like semiconductors, utilities, health care and discretionary stocks.
Don’t let the bad times scare you or ruin your day. Each day we are here is a good one! It makes me reflect on Led Zeppelin’s generation-changing tunes. One stanza, in particular, seems to fit today:
In the days of my youth
I was told what it means to be a man.
Now I’ve reached that age.
I’ve tried to do all those things the best I can.
No matter how I try,
I find my way to the same old jam.
All content above represents the opinion of Jason Bodner of Navellier & Associates, Inc.
Also In This Issue
A Look Ahead by Louis Navellier
Crude Oil Prices Reach a 13-Month High
Income Mail by Bryan Perry
Lower Inflation May Not Mean Lower Treasury Yields
Growth Mail by Gary Alexander
The Fourth Quarter Explosion is About to Start
Global Mail by Ivan Martchev
The Selloff in Stocks is the Fed’s Fault
Sector Spotlight by Jason Bodner
October – the Good News and the Bad News
View Full Archive
Read Past Issues Here

Jason Bodner
MARKETMAIL EDITOR FOR SECTOR SPOTLIGHT
Jason Bodner writes Sector Spotlight in the weekly Marketmail publication and has authored several white papers for the company. He is also Co-Founder of Macro Analytics for Professionals which produces proprietary equity accumulation/distribution research for its clients. Previously, Mr. Bodner served as Director of European Equity Derivatives for Cantor Fitzgerald Europe in London, then moved to the role of Head of Equity Derivatives North America for the same company in New York. He also served as S.V.P. Equity Derivatives for Jefferies, LLC. He received a B.S. in business administration in 1996, with honors, from Skidmore College as a member of the Periclean Honors Society. All content of “Sector Spotlight” represents the opinion of Jason Bodner
Important Disclosures:
Jason Bodner is a co-founder and co-owner of Mapsignals. Mr. Bodner is an independent contractor who is occasionally hired by Navellier & Associates to write an article and or provide opinions for possible use in articles that appear in Navellier & Associates weekly Market Mail. Mr. Bodner is not employed or affiliated with Louis Navellier, Navellier & Associates, Inc., or any other Navellier owned entity. The opinions and statements made here are those of Mr. Bodner and not necessarily those of any other persons or entities. This is not an endorsement, or solicitation or testimonial or investment advice regarding the BMI Index or any statements or recommendations or analysis in the article or the BMI Index or Mapsignals or its products or strategies.
Although information in these reports has been obtained from and is based upon sources that Navellier believes to be reliable, Navellier does not guarantee its accuracy and it may be incomplete or condensed. All opinions and estimates constitute Navellier’s judgment as of the date the report was created and are subject to change without notice. These reports are for informational purposes only and are not a solicitation for the purchase or sale of a security. Any decision to purchase securities mentioned in these reports must take into account existing public information on such securities or any registered prospectus.To the extent permitted by law, neither Navellier & Associates, Inc., nor any of its affiliates, agents, or service providers assumes any liability or responsibility nor owes any duty of care for any consequences of any person acting or refraining to act in reliance on the information contained in this communication or for any decision based on it.
Past performance is no indication of future results. Investment in securities involves significant risk and has the potential for partial or complete loss of funds invested. It should not be assumed that any securities recommendations made by Navellier. in the future will be profitable or equal the performance of securities made in this report. Dividend payments are not guaranteed. The amount of a dividend payment, if any, can vary over time and issuers may reduce dividends paid on securities in the event of a recession or adverse event affecting a specific industry or issuer.
None of the stock information, data, and company information presented herein constitutes a recommendation by Navellier or a solicitation to buy or sell any securities. Any specific securities identified and described do not represent all of the securities purchased, sold, or recommended for advisory clients. The holdings identified do not represent all of the securities purchased, sold, or recommended for advisory clients and the reader should not assume that investments in the securities identified and discussed were or will be profitable.
Information presented is general information that does not take into account your individual circumstances, financial situation, or needs, nor does it present a personalized recommendation to you. Individual stocks presented may not be suitable for every investor. Investment in securities involves significant risk and has the potential for partial or complete loss of funds invested. Investment in fixed income securities has the potential for the investment return and principal value of an investment to fluctuate so that an investor’s holdings, when redeemed, may be worth less than their original cost.
One cannot invest directly in an index. Index is unmanaged and index performance does not reflect deduction of fees, expenses, or taxes. Presentation of Index data does not reflect a belief by Navellier that any stock index constitutes an investment alternative to any Navellier equity strategy or is necessarily comparable to such strategies. Among the most important differences between the Indices and Navellier strategies are that the Navellier equity strategies may (1) incur material management fees, (2) concentrate its investments in relatively few stocks, industries, or sectors, (3) have significantly greater trading activity and related costs, and (4) be significantly more or less volatile than the Indices.
ETF Risk: We may invest in exchange traded funds (“ETFs”) and some of our investment strategies are generally fully invested in ETFs. Like traditional mutual funds, ETFs charge asset-based fees, but they generally do not charge initial sales charges or redemption fees and investors typically pay only customary brokerage fees to buy and sell ETF shares. The fees and costs charged by ETFs held in client accounts will not be deducted from the compensation the client pays Navellier. ETF prices can fluctuate up or down, and a client account could lose money investing in an ETF if the prices of the securities owned by the ETF go down. ETFs are subject to additional risks:
- ETF shares may trade above or below their net asset value;
- An active trading market for an ETF’s shares may not develop or be maintained;
- The value of an ETF may be more volatile than the underlying portfolio of securities the ETF is designed to track;
- The cost of owning shares of the ETF may exceed those a client would incur by directly investing in the underlying securities; and
- Trading of an ETF’s shares may be halted if the listing exchange’s officials deem it appropriate, the shares are delisted from the exchange, or the activation of market-wide “circuit breakers” (which are tied to large decreases in stock prices) halts stock trading generally.
Grader Disclosures: Investment in equity strategies involves substantial risk and has the potential for partial or complete loss of funds invested. The sample portfolio and any accompanying charts are for informational purposes only and are not to be construed as a solicitation to buy or sell any financial instrument and should not be relied upon as the sole factor in an investment making decision. As a matter of normal and important disclosures to you, as a potential investor, please consider the following: The performance presented is not based on any actual securities trading, portfolio, or accounts, and the reported performance of the A, B, C, D, and F portfolios (collectively the “model portfolios”) should be considered mere “paper” or pro forma performance results based on Navellier’s research.
Investors evaluating any of Navellier & Associates, Inc.’s, (or its affiliates’) Investment Products must not use any information presented here, including the performance figures of the model portfolios, in their evaluation of any Navellier Investment Products. Navellier Investment Products include the firm’s mutual funds and managed accounts. The model portfolios, charts, and other information presented do not represent actual funded trades and are not actual funded portfolios. There are material differences between Navellier Investment Products’ portfolios and the model portfolios, research, and performance figures presented here. The model portfolios and the research results (1) may contain stocks or ETFs that are illiquid and difficult to trade; (2) may contain stock or ETF holdings materially different from actual funded Navellier Investment Product portfolios; (3) include the reinvestment of all dividends and other earnings, estimated trading costs, commissions, or management fees; and, (4) may not reflect prices obtained in an actual funded Navellier Investment Product portfolio. For these and other reasons, the reported performances of model portfolios do not reflect the performance results of Navellier’s actually funded and traded Investment Products. In most cases, Navellier’s Investment Products have materially lower performance results than the performances of the model portfolios presented.
This report contains statements that are, or may be considered to be, forward-looking statements. All statements that are not historical facts, including statements about our beliefs or expectations, are “forward-looking statements” within the meaning of The U.S. Private Securities Litigation Reform Act of 1995. These statements may be identified by such forward-looking terminology as “expect,” “estimate,” “plan,” “intend,” “believe,” “anticipate,” “may,” “will,” “should,” “could,” “continue,” “project,” or similar statements or variations of such terms. Our forward-looking statements are based on a series of expectations, assumptions, and projections, are not guarantees of future results or performance, and involve substantial risks and uncertainty as described in Form ADV Part 2A of our filing with the Securities and Exchange Commission (SEC), which is available at www.adviserinfo.sec.gov or by requesting a copy by emailing info@navellier.com. All of our forward-looking statements are as of the date of this report only. We can give no assurance that such expectations or forward-looking statements will prove to be correct. Actual results may differ materially. You are urged to carefully consider all such factors.
FEDERAL TAX ADVICE DISCLAIMER: As required by U.S. Treasury Regulations, you are informed that, to the extent this presentation includes any federal tax advice, the presentation is not written by Navellier to be used, and cannot be used, for the purpose of avoiding federal tax penalties. Navellier does not advise on any income tax requirements or issues. Use of any information presented by Navellier is for general information only and does not represent tax advice either express or implied. You are encouraged to seek professional tax advice for income tax questions and assistance.
IMPORTANT NEWSLETTER DISCLOSURE:The hypothetical performance results for investment newsletters that are authored or edited by Louis Navellier, including Louis Navellier’s Growth Investor, Louis Navellier’s Breakthrough Stocks, Louis Navellier’s Accelerated Profits, and Louis Navellier’s Platinum Club, are not based on any actual securities trading, portfolio, or accounts, and the newsletters’ reported hypothetical performances should be considered mere “paper” or proforma hypothetical performance results and are not actual performance of real world trades. Navellier & Associates, Inc. does not have any relation to or affiliation with the owner of these newsletters. There are material differences between Navellier Investment Products’ portfolios and the InvestorPlace Media, LLC newsletter portfolios authored by Louis Navellier. The InvestorPlace Media, LLC newsletters contain hypothetical performance that do not include transaction costs, advisory fees, or other fees a client might incur if actual investments and trades were being made by an investor. As a result, newsletter performance should not be used to evaluate Navellier Investment services which are separate and different from the newsletters. The owner of the newsletters is InvestorPlace Media, LLC and any questions concerning the newsletters, including any newsletter advertising or hypothetical Newsletter performance claims, (which are calculated solely by Investor Place Media and not Navellier) should be referred to InvestorPlace Media, LLC at (800) 718-8289.
Please note that Navellier & Associates and the Navellier Private Client Group are managed completely independent of the newsletters owned and published by InvestorPlace Media, LLC and written and edited by Louis Navellier, and investment performance of the newsletters should in no way be considered indicative of potential future investment performance for any Navellier & Associates separately managed account portfolio. Potential investors should consult with their financial advisor before investing in any Navellier Investment Product.
Navellier claims compliance with Global Investment Performance Standards (GIPS). To receive a complete list and descriptions of Navellier’s composites and/or a presentation that adheres to the GIPS standards, please contact Navellier or click here. It should not be assumed that any securities recommendations made by Navellier & Associates, Inc. in the future will be profitable or equal the performance of securities made in this report.
FactSet Disclosure: Navellier does not independently calculate the statistical information included in the attached report. The calculation and the information are provided by FactSet, a company not related to Navellier. Although information contained in the report has been obtained from FactSet and is based on sources Navellier believes to be reliable, Navellier does not guarantee its accuracy, and it may be incomplete or condensed. The report and the related FactSet sourced information are provided on an “as is” basis. The user assumes the entire risk of any use made of this information. Investors should consider the report as only a single factor in making their investment decision. The report is for informational purposes only and is not intended as an offer or solicitation for the purchase or sale of a security. FactSet sourced information is the exclusive property of FactSet. Without prior written permission of FactSet, this information may not be reproduced, disseminated or used to create any financial products. All indices are unmanaged and performance of the indices include reinvestment of dividends and interest income, unless otherwise noted, are not illustrative of any particular investment and an investment cannot be made in any index. Past performance is no guarantee of future results.