by Jason Bodner
October 17, 2023
I got my wrist X-rayed as a kid. I wondered how the doctor could see what I couldn’t see. Nonetheless, X-rays can illuminate what would otherwise be in the dark. And that can be super useful in health care.
Believe it or not, X-rays helped us learn about the structure of DNA. In the 1950s, Rosalind Franklin took the first picture that revealed the DNA helix structure using X-rays. Think of all the benefits from seeing the unseen. As an investor, I wondered, what if there were an X-ray machine for the stock market….
It turns out there is – and it’s highly reliable and accurate. It can peer beneath the proverbial skin, muscle, and sinew to get down to the heart of the market. It’s called the Big Money Index (BMI) and the latest X-ray film reveals that the market is showing classic signs of bottoming out. To a market radiologist like me, this reveals some solid data to inspire hope for a broad-based rally in the coming weeks – or even days.
First and foremost, the big picture from X-ray machine says the BMI “oversold” indicator was triggered.
As a quick refresher, Institutional money flow drives most market prices. Firms like Morgan Stanley and JP Morgan estimate that between 70% and 90% of all daily trading volume is institutional. When those big boys and girls do something unusual, that catches my eye. When their money floods into a stock or ETF with unusual volume and volatility, that can issue a “buy signal” in my data. The same goes for a stock or ETF. Certain considerations must be met, but when we measure these buy or sell signals across 25 days and plot a moving average, we see the BMI’s reading of the overall money flows in the market.
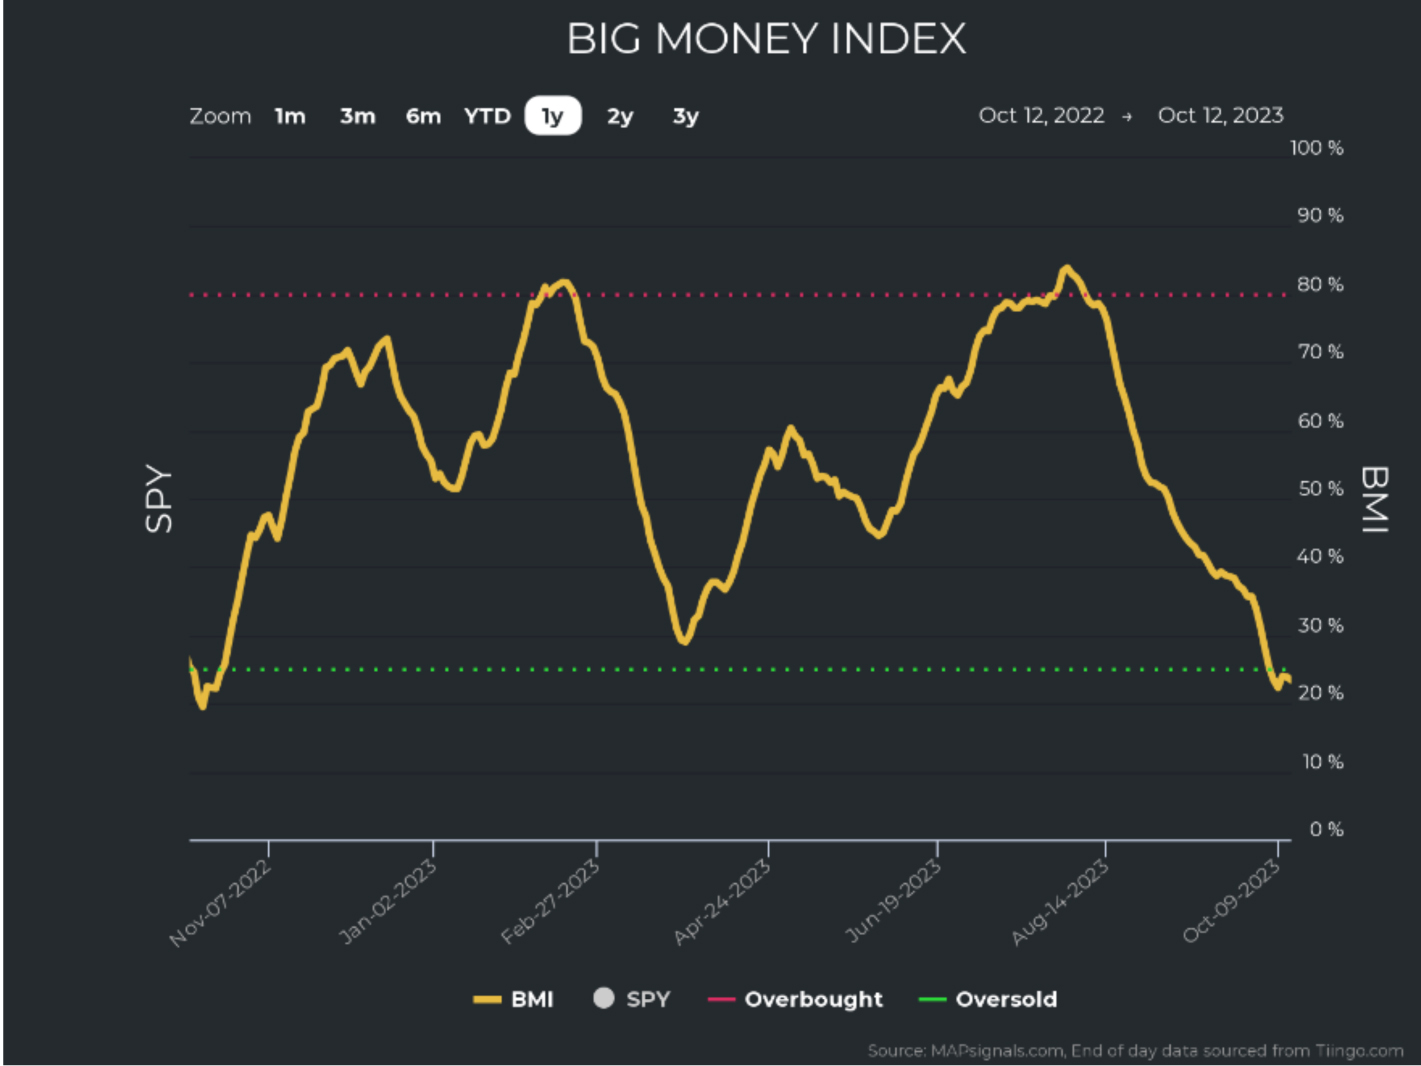
Here’s the current BMI X-ray picture for the last 12 months:
Graphs are for illustrative and discussion purposes only. Please read important disclosures at the end of this commentary.
To the uninitiated, this looks like some random ups and downs, but to the trained eye, it’s a stunningly accurate market barometer. The amber line looks like an EKG. In a sense, it is: It’s the heartbeat of the market. Big money flows in and out, like blood pumping through our veins. As the line rises, money is flowing in. As the line falls, money drains out. But like your own heartbeat, too much or too little blood flow isn’t a good thing. And unless it’s your last heartbeat, things need to (and will) get back in line.
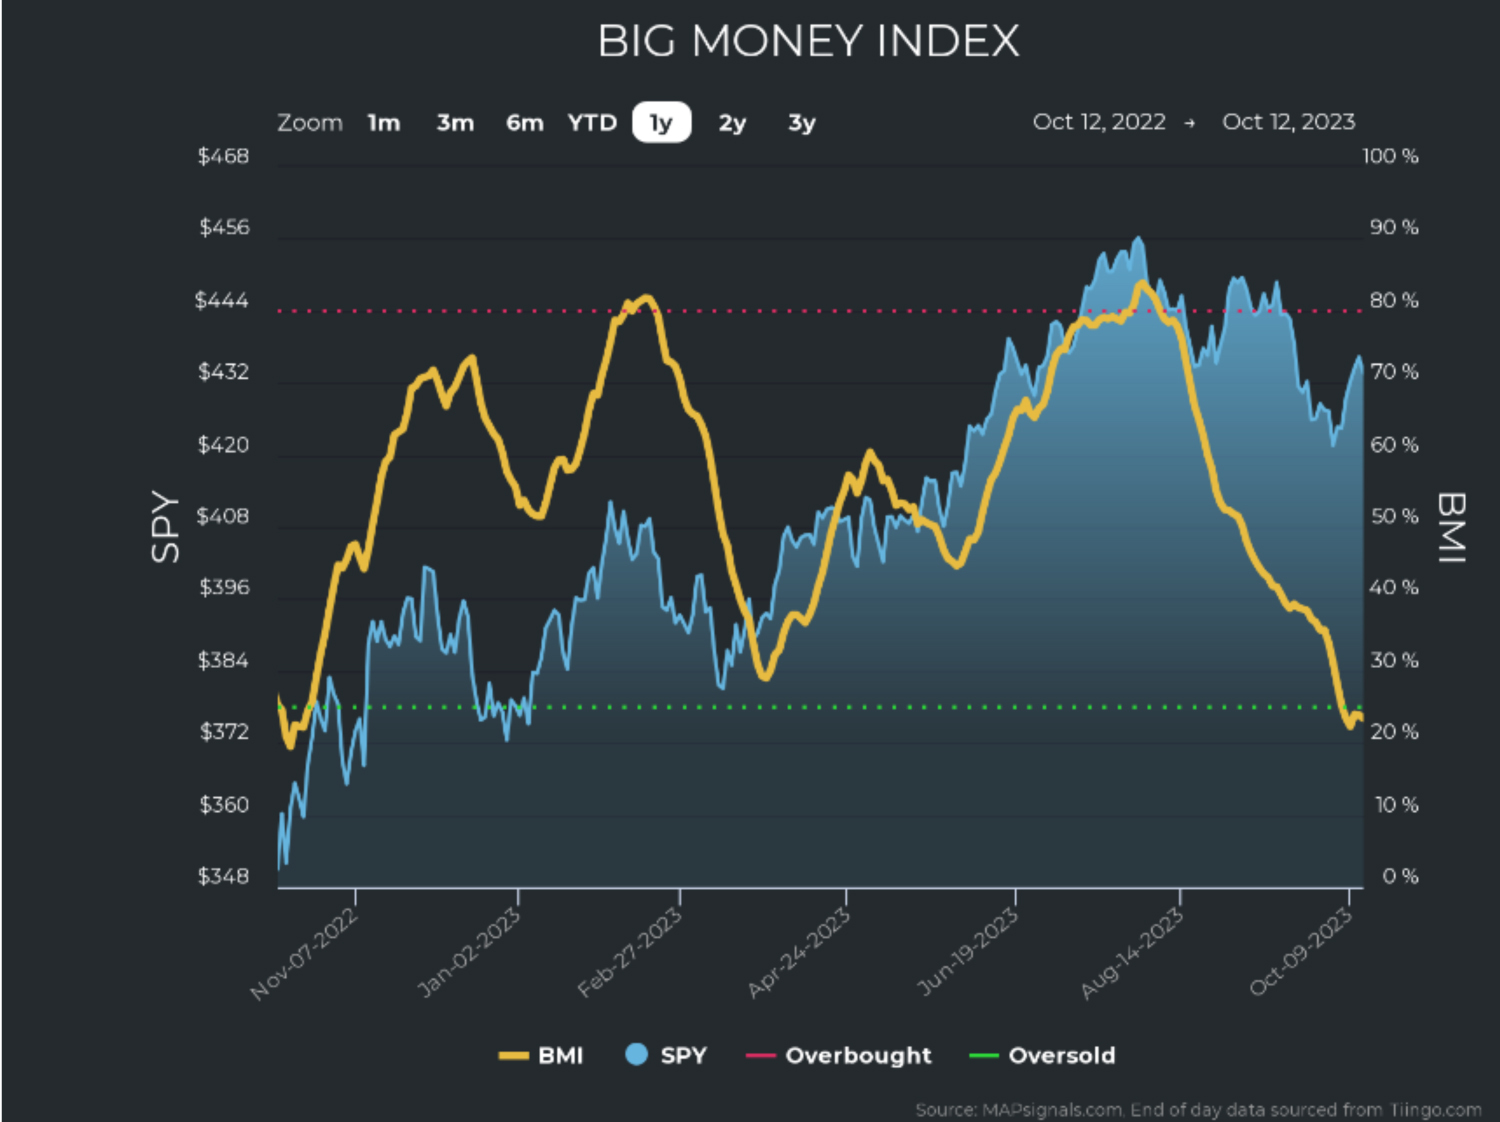
Too much money flowing in pushes up to that red zone, above 80%. This means the market is overbought – a lot like high blood pressure. There are drugs you can take, but typically if you avoid excesses and start exercising, your body will naturally bring high blood pressure under control. The same goes for low blood pressure. When money drains out of the market too fast, the patient either crashes and burns, or things get back in line. It’s when we overlay the skin (market prices) that the BMI’s X-ray snaps clearly into view:
Graphs are for illustrative and discussion purposes only. Please read important disclosures at the end of this commentary.
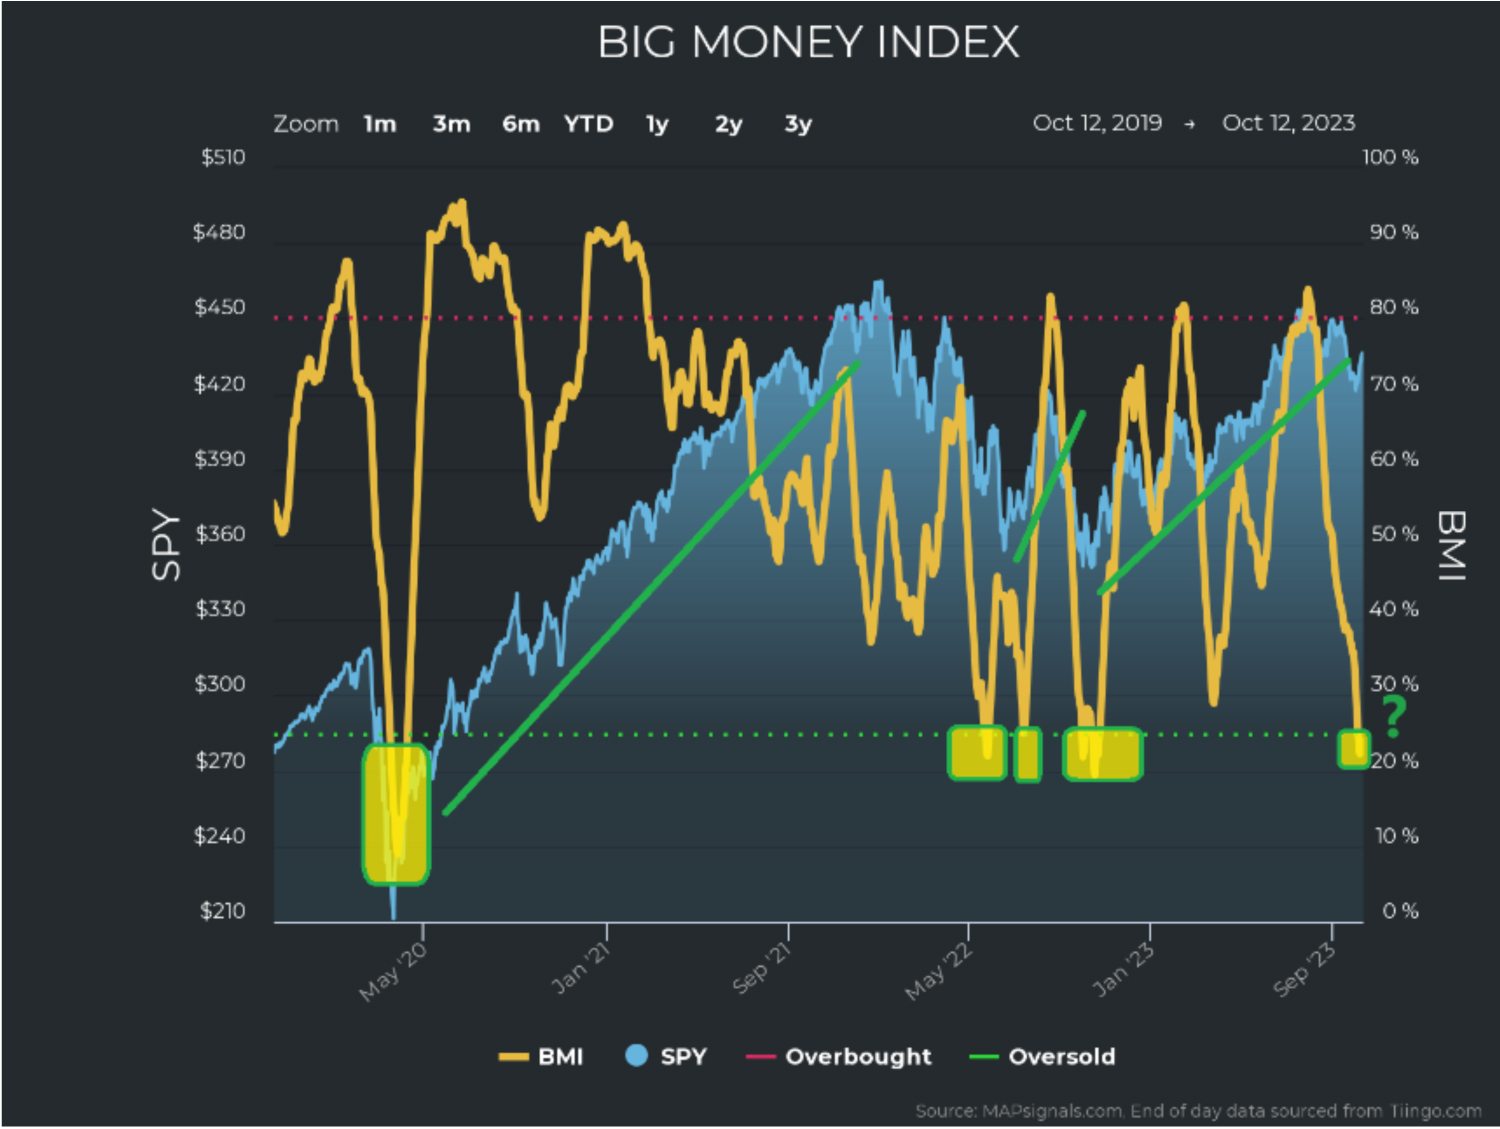
The latest X-ray shows that we are oversold (under 25%). And like a doctor who has seen a thousand X-rays, I can tell you that the patient’s prognosis is good. This is a common and healthy flushing out of risk. At worst, an oversold condition is like a wrist-break after bracing for a fall – it should heal quite nicely. Your nerves may need some physical therapy, though. I suggest a glass of wine and studying great stocks on sale. I took the liberty of showing the last few years of instances like today on the following X-ray:
Graphs are for illustrative and discussion purposes only. Please read important disclosures at the end of this commentary.
You’ll notice that each of the four or so prior times that the BMI went oversold, prices went higher very shortly thereafter. If I were a doctor, I would try to make people feel better about what they are seeing, hearing, or feeling, meaning I would show the patient the long history of how things work out over time.
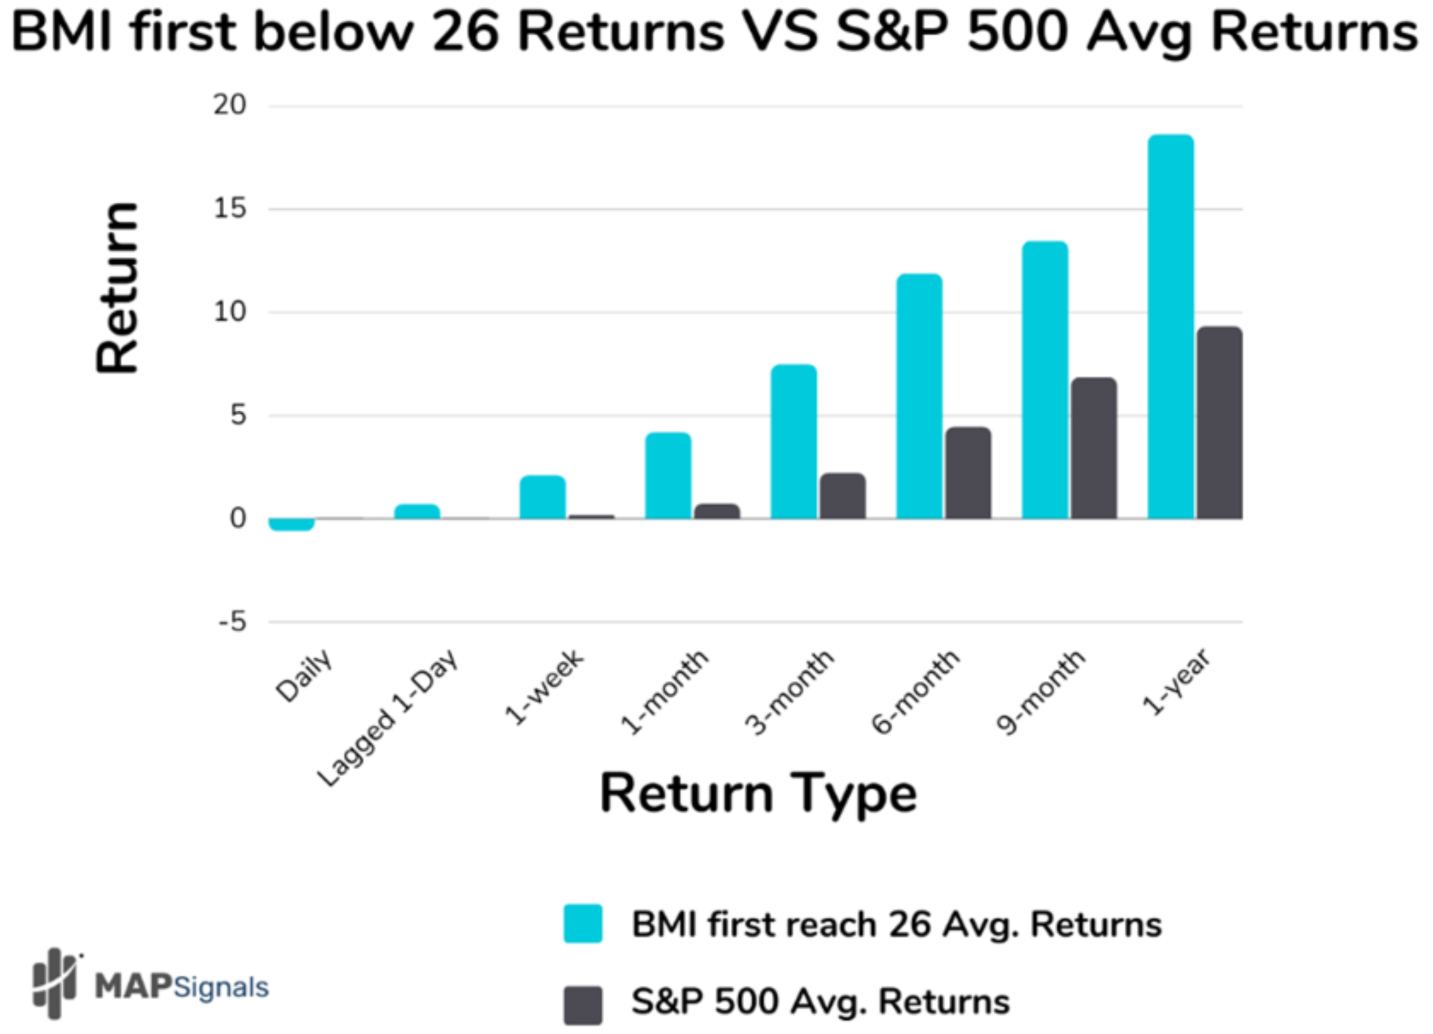
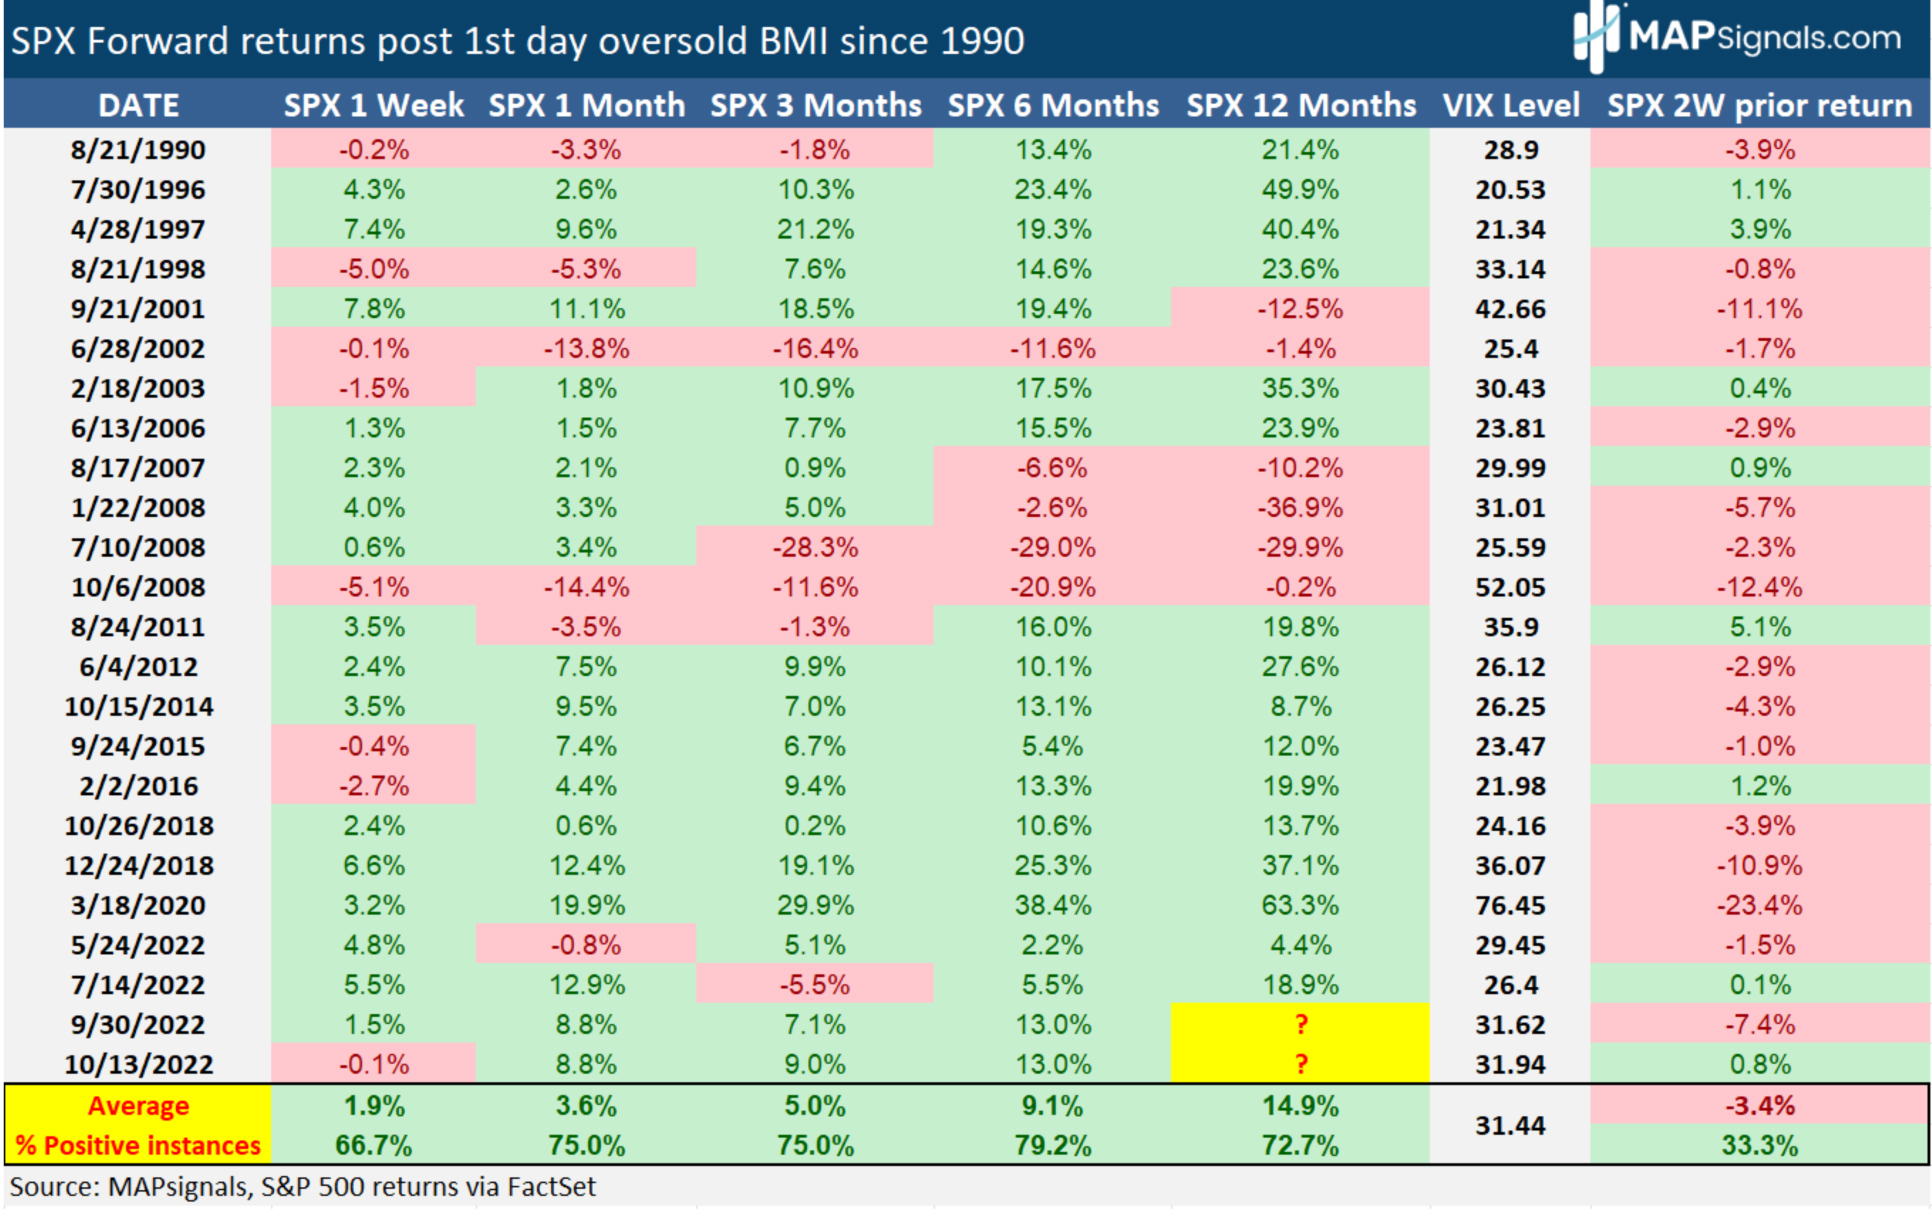
So, check this out: Since 1990, the BMI went oversold 24 times, and the 1, 3, 6, 9, 12, and 24 month returns of the S&P 500 after being oversold are spectacular – way better than average.
Here’s a sample:
Graphs are for illustrative and discussion purposes only. Please read important disclosures at the end of this commentary.
In fact, as your market doctor, I am here to tell you that in a vast majority of cases over the last 33+ years, things looked great after the market turns oversold:
Graphs are for illustrative and discussion purposes only. Please read important disclosures at the end of this commentary.
If you need more reassurance, I’d say that the market is about to recover from serious inflammation. All 11 sectors have sustained heavy selling. A handful are still swollen and raw, like Discretionary and Health Care. But all in all, I like what I’m seeing. Too much selling (inflammation) is going away, and I see small signs of buying (healing) in sectors, especially energy, tech and industrials, but I see small green appearing in all sectors after the violent selling. Here they are, ranked in order of strength to weakness:
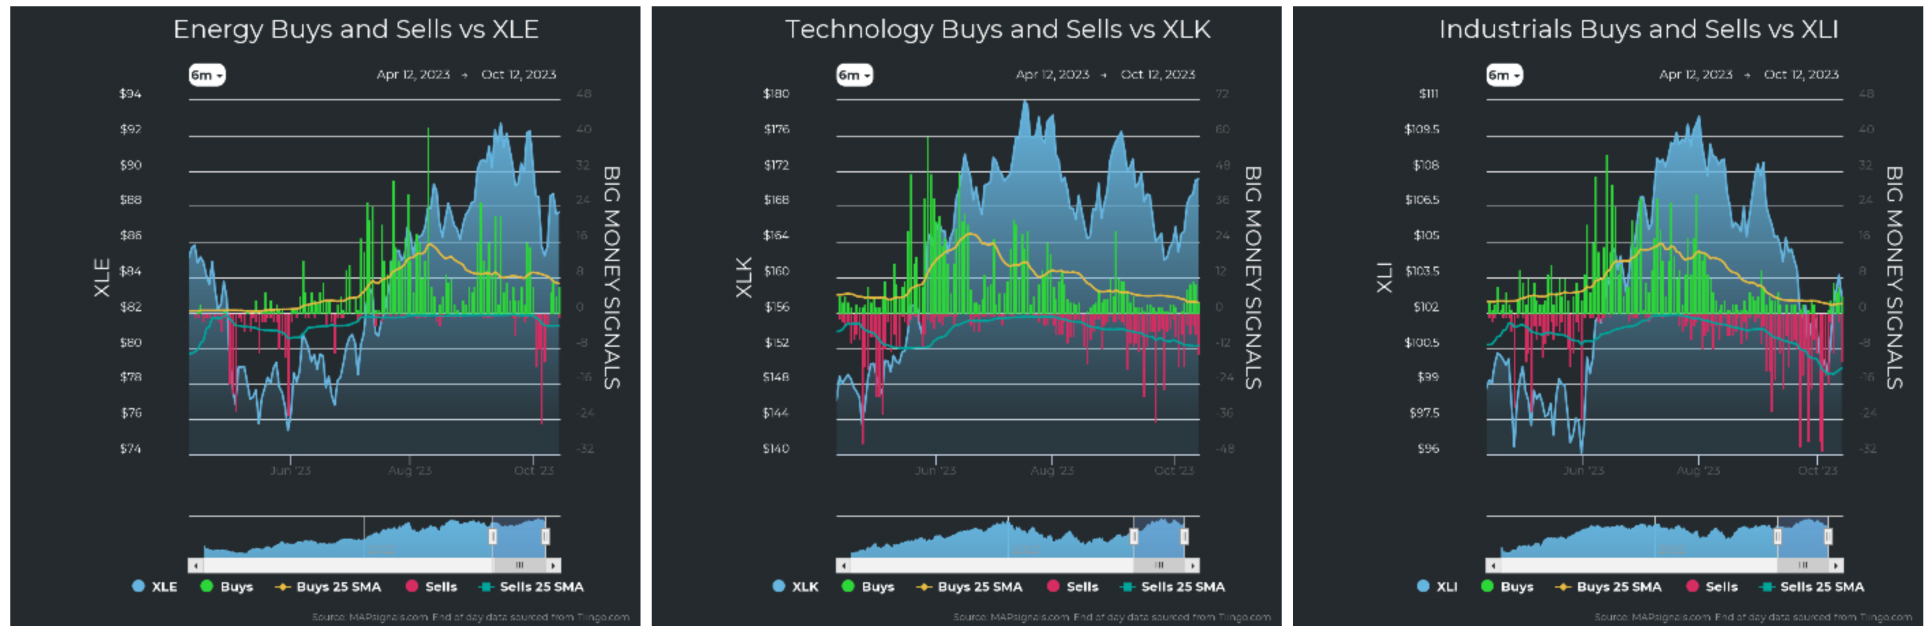
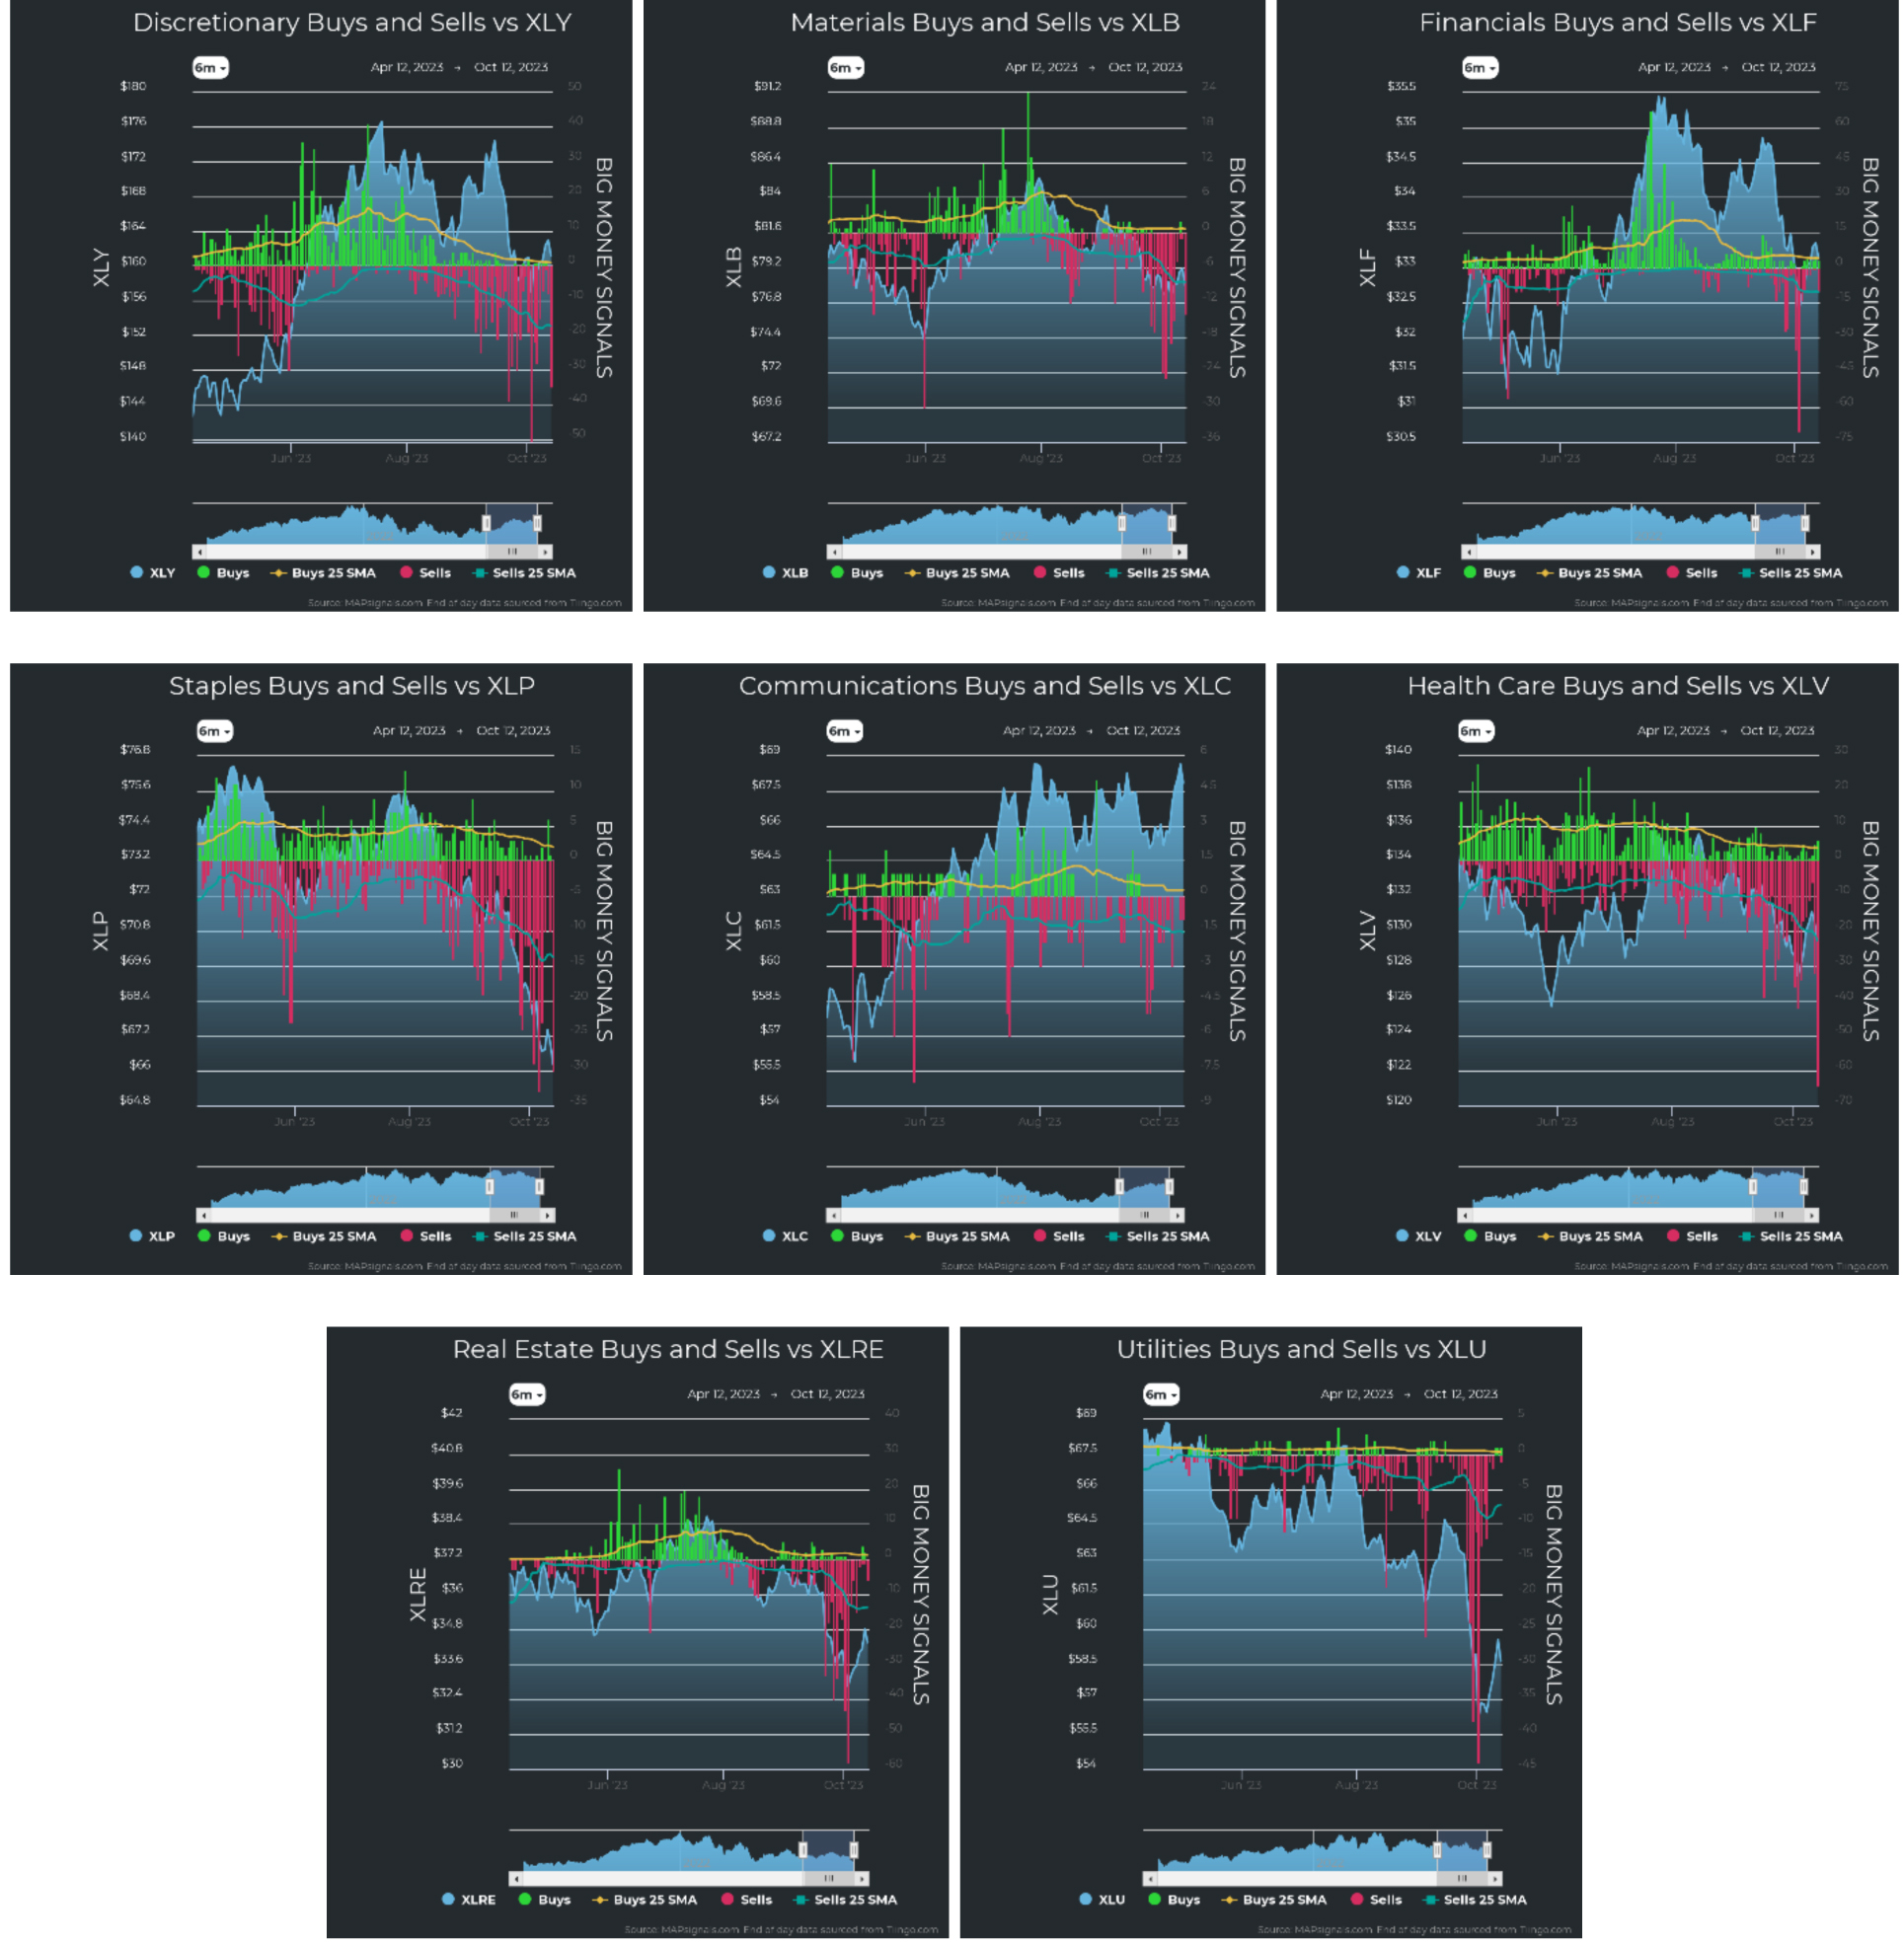
Graphs are for illustrative and discussion purposes only. Please read important disclosures at the end of this commentary.
What you’re looking at, above, is a battery of X-rays of the market’s broken body sectors. But it doesn’t stop there. To further reassure you, the market’s high-level functions look fine – even though the body has suffered some trauma. Stock selling is calming down and ETF selling has suddenly stopped:
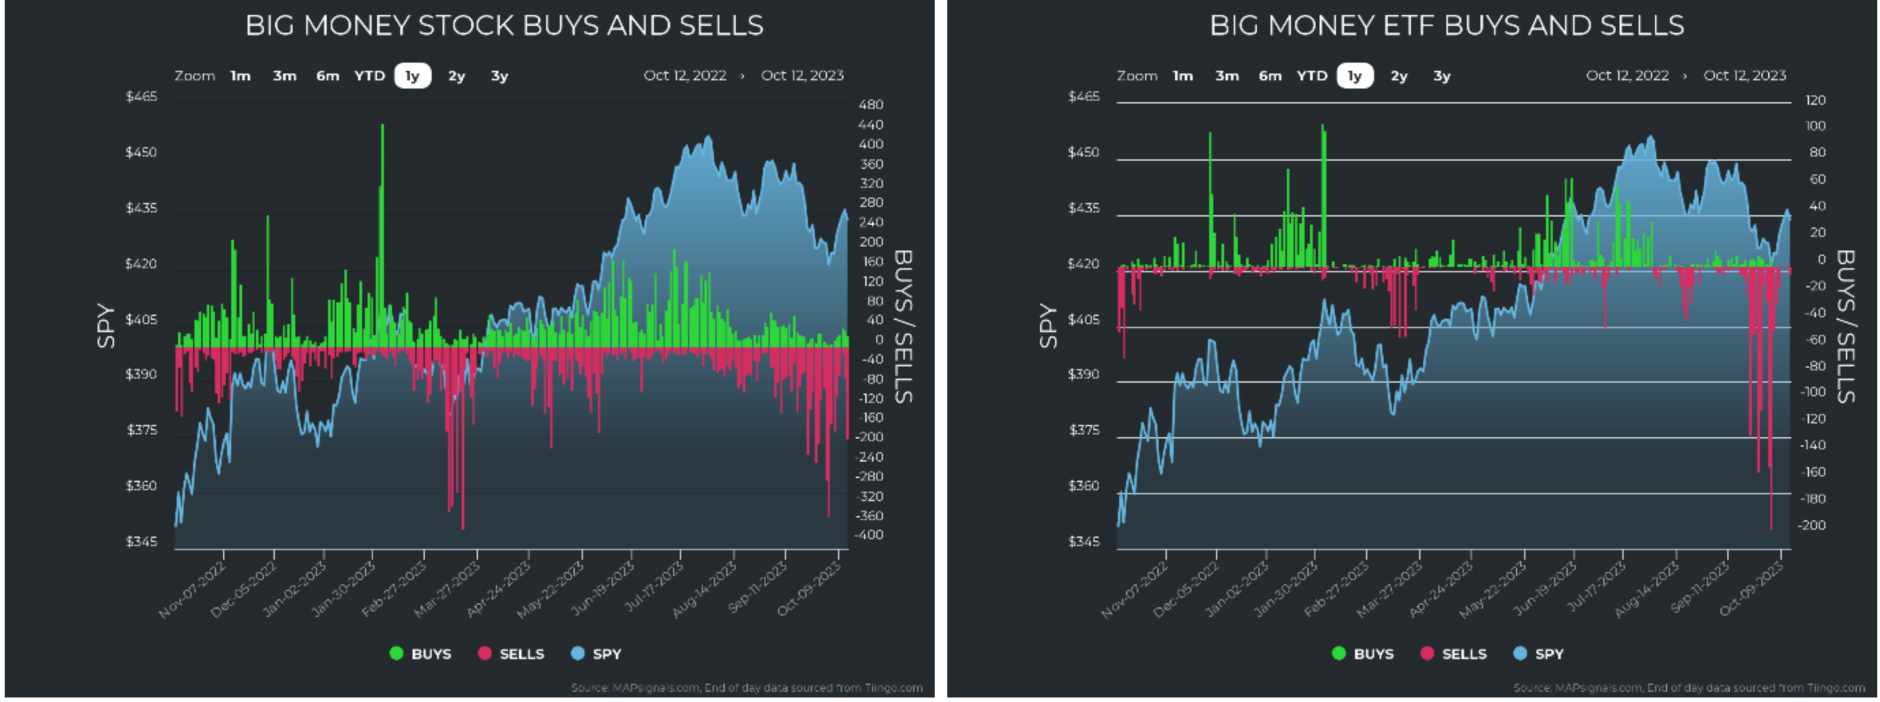
Graphs are for illustrative and discussion purposes only. Please read important disclosures at the end of this commentary.
So, here’s the deal: The market suffered a nasty injury, but underneath, it’s healthy and resilient. Over 33 years of history tell me that everything will be just fine, and we can expect a nice rally (a healthy recovery) very soon. My advice? Relax, have a drink, and identify some great stocks to buy.
Be like Groucho Marx, who said, “I’m not feeling well. I need a doctor. Ring the nearest golf course.”
At least you’re not like this unlucky bride-to-be, whose engagement ring was hidden in a milkshake:

All content above represents the opinion of Jason Bodner of Navellier & Associates, Inc.
Also In This Issue
A Look Ahead by Louis Navellier
Can Washington Afford to Fund Another Overseas War?
Income Mail by Bryan Perry
Bulls Retreat to the Bunker During Middle East Tensions
Growth Mail by Gary Alexander
In The War Against Growth, The Luddites are the Losers!
Global Mail by Ivan Martchev
The Present Explosive Geopolitical Situation is Impossible to Predict
Sector Spotlight by Jason Bodner
What Would a Market X-Ray Look Like?
View Full Archive
Read Past Issues Here

Jason Bodner
MARKETMAIL EDITOR FOR SECTOR SPOTLIGHT
Jason Bodner writes Sector Spotlight in the weekly Marketmail publication and has authored several white papers for the company. He is also Co-Founder of Macro Analytics for Professionals which produces proprietary equity accumulation/distribution research for its clients. Previously, Mr. Bodner served as Director of European Equity Derivatives for Cantor Fitzgerald Europe in London, then moved to the role of Head of Equity Derivatives North America for the same company in New York. He also served as S.V.P. Equity Derivatives for Jefferies, LLC. He received a B.S. in business administration in 1996, with honors, from Skidmore College as a member of the Periclean Honors Society. All content of “Sector Spotlight” represents the opinion of Jason Bodner
Important Disclosures:
Jason Bodner is a co-founder and co-owner of Mapsignals. Mr. Bodner is an independent contractor who is occasionally hired by Navellier & Associates to write an article and or provide opinions for possible use in articles that appear in Navellier & Associates weekly Market Mail. Mr. Bodner is not employed or affiliated with Louis Navellier, Navellier & Associates, Inc., or any other Navellier owned entity. The opinions and statements made here are those of Mr. Bodner and not necessarily those of any other persons or entities. This is not an endorsement, or solicitation or testimonial or investment advice regarding the BMI Index or any statements or recommendations or analysis in the article or the BMI Index or Mapsignals or its products or strategies.
Although information in these reports has been obtained from and is based upon sources that Navellier believes to be reliable, Navellier does not guarantee its accuracy and it may be incomplete or condensed. All opinions and estimates constitute Navellier’s judgment as of the date the report was created and are subject to change without notice. These reports are for informational purposes only and are not a solicitation for the purchase or sale of a security. Any decision to purchase securities mentioned in these reports must take into account existing public information on such securities or any registered prospectus.To the extent permitted by law, neither Navellier & Associates, Inc., nor any of its affiliates, agents, or service providers assumes any liability or responsibility nor owes any duty of care for any consequences of any person acting or refraining to act in reliance on the information contained in this communication or for any decision based on it.
Past performance is no indication of future results. Investment in securities involves significant risk and has the potential for partial or complete loss of funds invested. It should not be assumed that any securities recommendations made by Navellier. in the future will be profitable or equal the performance of securities made in this report. Dividend payments are not guaranteed. The amount of a dividend payment, if any, can vary over time and issuers may reduce dividends paid on securities in the event of a recession or adverse event affecting a specific industry or issuer.
None of the stock information, data, and company information presented herein constitutes a recommendation by Navellier or a solicitation to buy or sell any securities. Any specific securities identified and described do not represent all of the securities purchased, sold, or recommended for advisory clients. The holdings identified do not represent all of the securities purchased, sold, or recommended for advisory clients and the reader should not assume that investments in the securities identified and discussed were or will be profitable.
Information presented is general information that does not take into account your individual circumstances, financial situation, or needs, nor does it present a personalized recommendation to you. Individual stocks presented may not be suitable for every investor. Investment in securities involves significant risk and has the potential for partial or complete loss of funds invested. Investment in fixed income securities has the potential for the investment return and principal value of an investment to fluctuate so that an investor’s holdings, when redeemed, may be worth less than their original cost.
One cannot invest directly in an index. Index is unmanaged and index performance does not reflect deduction of fees, expenses, or taxes. Presentation of Index data does not reflect a belief by Navellier that any stock index constitutes an investment alternative to any Navellier equity strategy or is necessarily comparable to such strategies. Among the most important differences between the Indices and Navellier strategies are that the Navellier equity strategies may (1) incur material management fees, (2) concentrate its investments in relatively few stocks, industries, or sectors, (3) have significantly greater trading activity and related costs, and (4) be significantly more or less volatile than the Indices.
ETF Risk: We may invest in exchange traded funds (“ETFs”) and some of our investment strategies are generally fully invested in ETFs. Like traditional mutual funds, ETFs charge asset-based fees, but they generally do not charge initial sales charges or redemption fees and investors typically pay only customary brokerage fees to buy and sell ETF shares. The fees and costs charged by ETFs held in client accounts will not be deducted from the compensation the client pays Navellier. ETF prices can fluctuate up or down, and a client account could lose money investing in an ETF if the prices of the securities owned by the ETF go down. ETFs are subject to additional risks:
- ETF shares may trade above or below their net asset value;
- An active trading market for an ETF’s shares may not develop or be maintained;
- The value of an ETF may be more volatile than the underlying portfolio of securities the ETF is designed to track;
- The cost of owning shares of the ETF may exceed those a client would incur by directly investing in the underlying securities; and
- Trading of an ETF’s shares may be halted if the listing exchange’s officials deem it appropriate, the shares are delisted from the exchange, or the activation of market-wide “circuit breakers” (which are tied to large decreases in stock prices) halts stock trading generally.
Grader Disclosures: Investment in equity strategies involves substantial risk and has the potential for partial or complete loss of funds invested. The sample portfolio and any accompanying charts are for informational purposes only and are not to be construed as a solicitation to buy or sell any financial instrument and should not be relied upon as the sole factor in an investment making decision. As a matter of normal and important disclosures to you, as a potential investor, please consider the following: The performance presented is not based on any actual securities trading, portfolio, or accounts, and the reported performance of the A, B, C, D, and F portfolios (collectively the “model portfolios”) should be considered mere “paper” or pro forma performance results based on Navellier’s research.
Investors evaluating any of Navellier & Associates, Inc.’s, (or its affiliates’) Investment Products must not use any information presented here, including the performance figures of the model portfolios, in their evaluation of any Navellier Investment Products. Navellier Investment Products include the firm’s mutual funds and managed accounts. The model portfolios, charts, and other information presented do not represent actual funded trades and are not actual funded portfolios. There are material differences between Navellier Investment Products’ portfolios and the model portfolios, research, and performance figures presented here. The model portfolios and the research results (1) may contain stocks or ETFs that are illiquid and difficult to trade; (2) may contain stock or ETF holdings materially different from actual funded Navellier Investment Product portfolios; (3) include the reinvestment of all dividends and other earnings, estimated trading costs, commissions, or management fees; and, (4) may not reflect prices obtained in an actual funded Navellier Investment Product portfolio. For these and other reasons, the reported performances of model portfolios do not reflect the performance results of Navellier’s actually funded and traded Investment Products. In most cases, Navellier’s Investment Products have materially lower performance results than the performances of the model portfolios presented.
This report contains statements that are, or may be considered to be, forward-looking statements. All statements that are not historical facts, including statements about our beliefs or expectations, are “forward-looking statements” within the meaning of The U.S. Private Securities Litigation Reform Act of 1995. These statements may be identified by such forward-looking terminology as “expect,” “estimate,” “plan,” “intend,” “believe,” “anticipate,” “may,” “will,” “should,” “could,” “continue,” “project,” or similar statements or variations of such terms. Our forward-looking statements are based on a series of expectations, assumptions, and projections, are not guarantees of future results or performance, and involve substantial risks and uncertainty as described in Form ADV Part 2A of our filing with the Securities and Exchange Commission (SEC), which is available at www.adviserinfo.sec.gov or by requesting a copy by emailing info@navellier.com. All of our forward-looking statements are as of the date of this report only. We can give no assurance that such expectations or forward-looking statements will prove to be correct. Actual results may differ materially. You are urged to carefully consider all such factors.
FEDERAL TAX ADVICE DISCLAIMER: As required by U.S. Treasury Regulations, you are informed that, to the extent this presentation includes any federal tax advice, the presentation is not written by Navellier to be used, and cannot be used, for the purpose of avoiding federal tax penalties. Navellier does not advise on any income tax requirements or issues. Use of any information presented by Navellier is for general information only and does not represent tax advice either express or implied. You are encouraged to seek professional tax advice for income tax questions and assistance.
IMPORTANT NEWSLETTER DISCLOSURE:The hypothetical performance results for investment newsletters that are authored or edited by Louis Navellier, including Louis Navellier’s Growth Investor, Louis Navellier’s Breakthrough Stocks, Louis Navellier’s Accelerated Profits, and Louis Navellier’s Platinum Club, are not based on any actual securities trading, portfolio, or accounts, and the newsletters’ reported hypothetical performances should be considered mere “paper” or proforma hypothetical performance results and are not actual performance of real world trades. Navellier & Associates, Inc. does not have any relation to or affiliation with the owner of these newsletters. There are material differences between Navellier Investment Products’ portfolios and the InvestorPlace Media, LLC newsletter portfolios authored by Louis Navellier. The InvestorPlace Media, LLC newsletters contain hypothetical performance that do not include transaction costs, advisory fees, or other fees a client might incur if actual investments and trades were being made by an investor. As a result, newsletter performance should not be used to evaluate Navellier Investment services which are separate and different from the newsletters. The owner of the newsletters is InvestorPlace Media, LLC and any questions concerning the newsletters, including any newsletter advertising or hypothetical Newsletter performance claims, (which are calculated solely by Investor Place Media and not Navellier) should be referred to InvestorPlace Media, LLC at (800) 718-8289.
Please note that Navellier & Associates and the Navellier Private Client Group are managed completely independent of the newsletters owned and published by InvestorPlace Media, LLC and written and edited by Louis Navellier, and investment performance of the newsletters should in no way be considered indicative of potential future investment performance for any Navellier & Associates separately managed account portfolio. Potential investors should consult with their financial advisor before investing in any Navellier Investment Product.
Navellier claims compliance with Global Investment Performance Standards (GIPS). To receive a complete list and descriptions of Navellier’s composites and/or a presentation that adheres to the GIPS standards, please contact Navellier or click here. It should not be assumed that any securities recommendations made by Navellier & Associates, Inc. in the future will be profitable or equal the performance of securities made in this report.
FactSet Disclosure: Navellier does not independently calculate the statistical information included in the attached report. The calculation and the information are provided by FactSet, a company not related to Navellier. Although information contained in the report has been obtained from FactSet and is based on sources Navellier believes to be reliable, Navellier does not guarantee its accuracy, and it may be incomplete or condensed. The report and the related FactSet sourced information are provided on an “as is” basis. The user assumes the entire risk of any use made of this information. Investors should consider the report as only a single factor in making their investment decision. The report is for informational purposes only and is not intended as an offer or solicitation for the purchase or sale of a security. FactSet sourced information is the exclusive property of FactSet. Without prior written permission of FactSet, this information may not be reproduced, disseminated or used to create any financial products. All indices are unmanaged and performance of the indices include reinvestment of dividends and interest income, unless otherwise noted, are not illustrative of any particular investment and an investment cannot be made in any index. Past performance is no guarantee of future results.