by Gary Alexander
January 30, 2024
I hope you all know by now that the market doesn’t care who wins Super Bowl 58 – or whether global warming will return earlier than usual if a Groundhog named Phil shows his head this Friday – but some investors still cling to other outdated myths, like the January Indicator (“so goes January, so goes the year”), or the magic pixie dust of a Santa Claus Rally – which technically refers to a year-end boost spanning the last five trading days of December and the first two days of January – which failed this year.
This year, a red-hot November/December market rally finally endured its first multi-day correction during the famed Santa Claus rally week, declining over 1% from the S&P 500’s pre-Christmas close to January 3, 2024, the second trading day of the New Year. That followed a meteoric 15.5% rise in the S&P 500 from Friday, October 27, 2023, to the Friday before Christmas. But after that 1%+ sag in the Santa Claus rally week, the S&P 500 recovered for a 4% gain through last Friday, January 26, 2024.
As for the reputedly reliable “January Indicator,” it’s barely worth a coin flip – a 50% bet. We don’t know yet if this January will finish up or down, but it really doesn’t matter. You’ve probably heard that January is a strong month – and that was true during the 20th Century – but it may surprise you to discover that January isn’t such a great month during the 21st Century, with only 11 rising January months and 12 falling Januaries, and the January Indicator only worked 12 of 23 times (52%), just above a coin flip.
- In 23 years (2001-23), January rose 11 times. The S&P 500 rose eight of those years, falling 3 times.
- From 2001 to 2023, January fell 12 times. The S&P fell only 4 of those times, rising 8 times. Oops!
More appropriate to our current realities (and recent memories), since the 2007-08 Great Financial Crisis, the January Indicator is even less reliable. Since 2009, the January Indicator has only worked in seven of 15 years (47%), or less than a coin flip, and January has actually been a negative month in 8 of those 15 years (53%), belying its previous record and reputation of being a positive month. In fact, in those 15 years, February (with a negative historical reputation) was up 9 times, vs. only 7 positive January months.
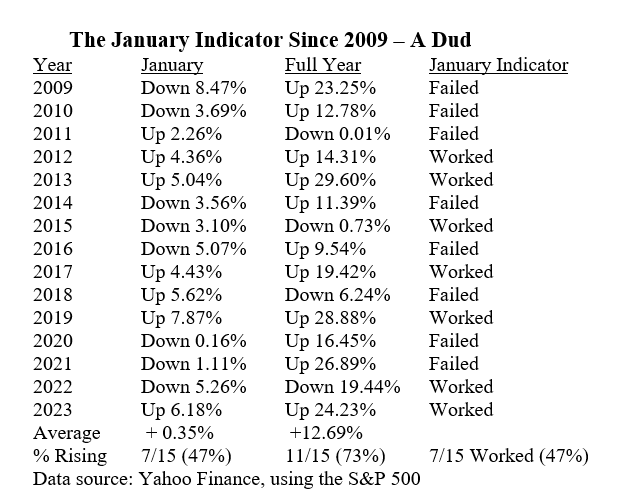
I’m not cherry-picking the starting date. The 2003 bull market began with a declining January (-2.74%) and a +26.4% full year. Before that, a rough 2001 (-13%) began with a +3.74% January. In 1998, the Dow was down in January, while the S&P was up 1%, so it was tough to read, but 1998 rose near 20%.
In most seasonality claims these days, they say January is a positive month and February is negative, because such studies usually started 50 or 100 years ago, but I don’t care what happened that long ago.
Graphs are for illustrative and discussion purposes only. Please read important disclosures at the end of this commentary.
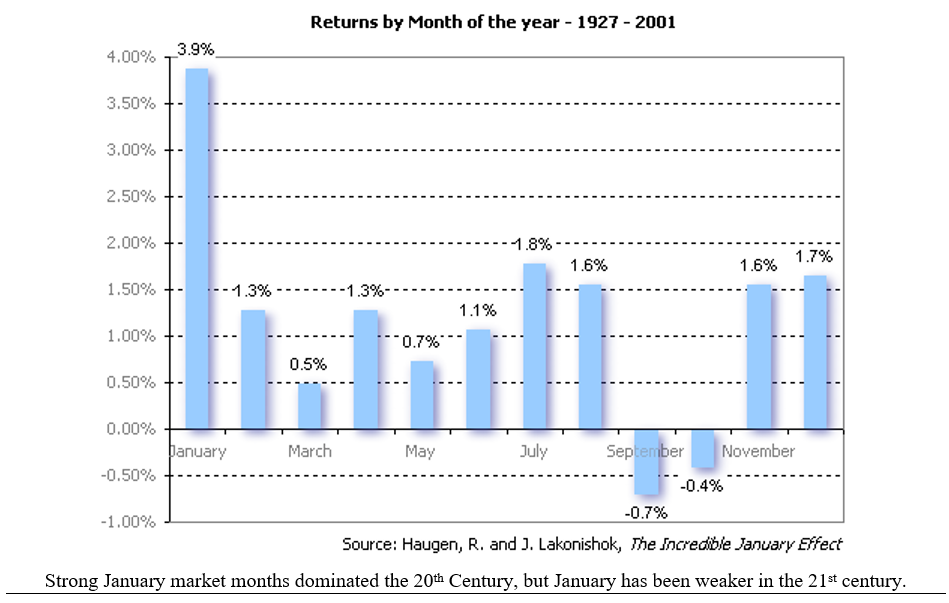
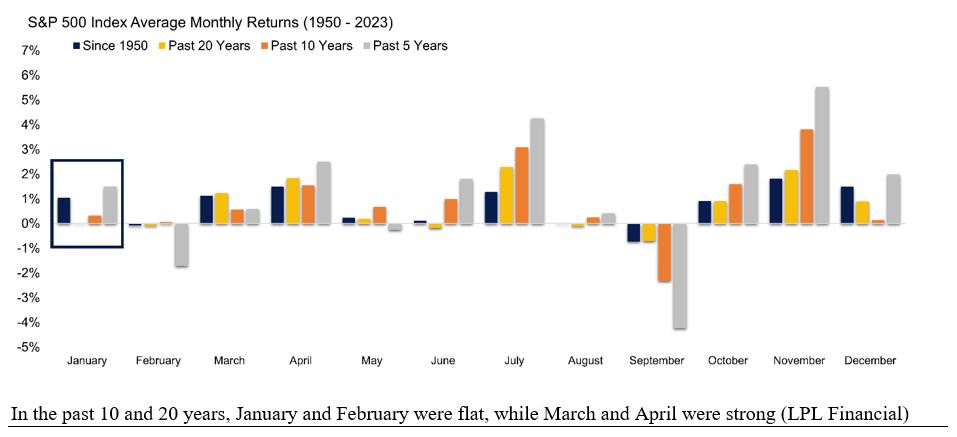
Most of these familiar indicators (Super Bowls, Santa Claus, Hemlines or January Indicators) were based on looking backward in search of a string of coincidences. Statisticians like to look for any common denominator – some as silly as Super Bowl winners, hemlines or Triple Crown-winning horse races – and then predict the future based on a football team’s division, or a super-horse, or a skirt’s length, but one of the basic laws of statistics is that a coin flip is always a 50-50 proposition, no matter how many times it came up heads or tails in the past. In the 20th century (above), for instance, January and February were robust, and March was weak, but since 2001 – which is far more relevant today – the opposite is true:
Graphs are for illustrative and discussion purposes only. Please read important disclosures at the end of this commentary.
Unless there is a logical reason why some outside event or calendar cycle should impact the market, I’d say that such a theory is often based on a statistical coincidence, an anomaly, that fits well historically but is not likely to fit well in the future. One major exception I have found is the 4-year Presidential cycle, since national leadership impacts economic policies in a major way. Fourth-quarter year-end tax trading, or April tax trading, is another logical seasonal marker, but there are very few reliable seasonal indicators left standing, in my view. Most calendar systems and external trading cues have faded in value over time.
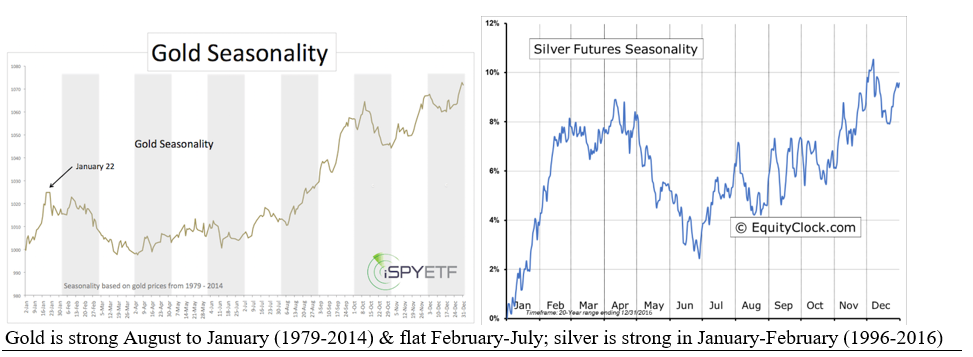
Gold (and Silver) Seasonality is a More Clearly Defined
Today marks an important anniversary in gold history. It was 90 years ago today that President Franklin D. Roosevelt revalued the price of gold up 69%, in a time of massive deflation – on his birthday, no less.
On January 30, 1934, FDR signed the Gold Reserve Act, revaluing gold from $20.67 per ounce, where it had stood for 100 years, to $35.00 per ounce – after repatriating most of the nation’s privately-held gold coins and bars at $20.67 per ounce the previous April, under threat of hefty fines and jail time. Americans were not legally allowed to hold gold bullion or legal tender U.S. coins for over 40 years, until late 1974.
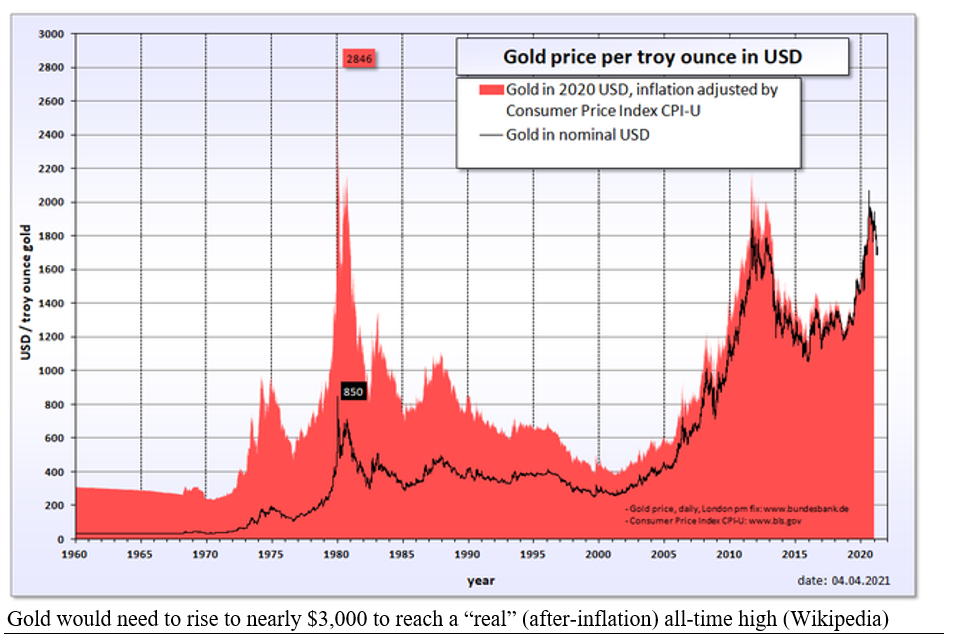
Gold’s other red-letter dates in late January were, first, its major discovery in Sutter’s Mill on January 24, 1848, leading to the 49ers (a world of gold-seekers, not the NFL football team, winner of five Super Bowls so far), and January 21, 1980, the date of gold’s all-time “real” (adjusted for inflation) high price, even though that was just a one-day spike. Gold was at $750 the day before and after that one-day spike.
Graphs are for illustrative and discussion purposes only. Please read important disclosures at the end of this commentary.
There is a plausible reason for a distinct seasonal cycle in precious metals (charts, below). Fund manager Frank Holmes calls it “the love trade.” Around Christmas, you see a boatload of jewelry ads for rings or other tokens of love for your spouse or partner. These aren’t limited to the Christmas season. Valentine’s Day is coming soon (as is my wife’s birthday in February, or our 56th anniversary, just past, January 14).
In Asia, where there are far more people, and rapidly rising wealth, there is India’s Diwali in November and the Chinese New Year in early February this year, both involving gold jewelry as auspicious gifts.
Graphs are for illustrative and discussion purposes only. Please read important disclosures at the end of this commentary.
OK, if November through February is the peak of the holiday “love trade,” then why does gold demand rise fastest in late summer – August to September? Because that’s when jewelers need to order bullion to fabricate their intricate products to put on sale from October to January for shoppers for those gifts.
So far in January 2024, gold is down 2.1%, but gold tends to move in a mirror image to the U.S. dollar, and the U.S. Dollar Index (DXY) is up exactly +2.1%, so gold is neutral in terms of a wide basket of other currencies. Gold tends to act opposite to the U.S. dollar, and it also often trades opposite to stocks.
For investment purposes, gold serves as a ballast to your portfolio, usually taking the place of currencies, cash, or even bonds, but not replacing stocks. It is also a crisis hedge. This month, the world is voting for the dollar as a crisis hedge amid various wars and rumors of wars, but if the nations of the Middle East and Asia revert to form, they will likely elect to buy gold over the dollar as their preferred crisis hedge.
It might be best to buy gold and good stocks during any doldrums of slower demand, and that could be the next six months for precious metals, or the next two months for stocks in a presidential election year. Why? Here is a chart our colleague Jason Bodner introduced in early January. He charted the 11 election years since 1980. The first quarter fell by -1.5% vs. the usual +2.1%, but the rest of the year rose by 8.1%.
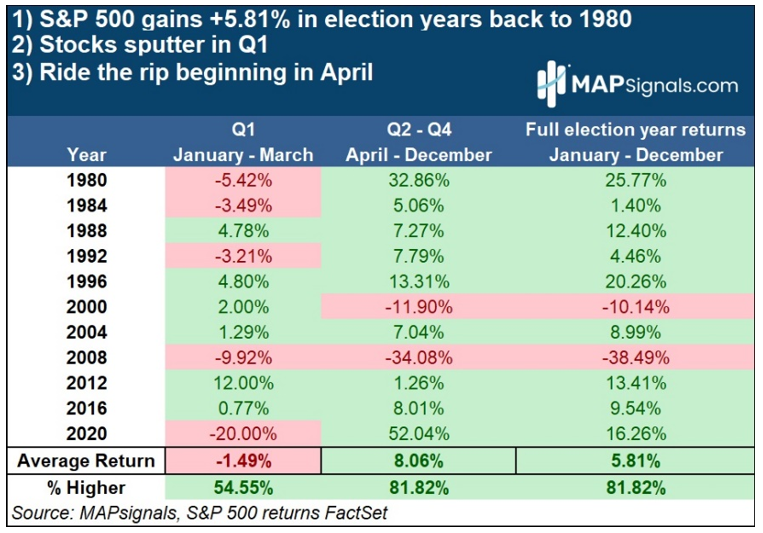
Graphs are for illustrative and discussion purposes only. Please read important disclosures at the end of this commentary.
To me, this means the first quarter could give us a great opportunity to buy stocks or gold on sale.
All content above represents the opinion of Gary Alexander of Navellier & Associates, Inc.
Also In This Issue
A Look Ahead by Louis Navellier
Biden’s Clueless Energy Policies May Cost Him Re-Election
Income Mail by Bryan Perry
Sizing Up the New AI-Driven Rally
Growth Mail by Gary Alexander
Ignore All January Indicators, Santa Claus Rallies and Super Bowl Winners
Global Mail by Ivan Martchev
The January Barometer Holds 2024 Promise
Sector Spotlight by Jason Bodner
Market Secrets From “Another Planet”
View Full Archive
Read Past Issues Here
About The Author

Gary Alexander
SENIOR EDITOR
Gary Alexander has been Senior Writer at Navellier since 2009. He edits Navellier’s weekly Marketmail and writes a weekly Growth Mail column, in which he uses market history to support the case for growth stocks. For the previous 20 years before joining Navellier, he was Senior Executive Editor at InvestorPlace Media (formerly Phillips Publishing), where he worked with several leading investment analysts, including Louis Navellier (since 1997), helping launch Louis Navellier’s Blue Chip Growth and Global Growth newsletters.
Prior to that, Gary edited Wealth Magazine and Gold Newsletter and wrote various investment research reports for Jefferson Financial in New Orleans in the 1980s. He began his financial newsletter career with KCI Communications in 1980, where he served as consulting editor for Personal Finance newsletter while serving as general manager of KCI’s Alexandria House book division. Before that, he covered the economics beat for news magazines. All content of “Growth Mail” represents the opinion of Gary Alexander
Important Disclosures:
Although information in these reports has been obtained from and is based upon sources that Navellier believes to be reliable, Navellier does not guarantee its accuracy and it may be incomplete or condensed. All opinions and estimates constitute Navellier’s judgment as of the date the report was created and are subject to change without notice. These reports are for informational purposes only and are not a solicitation for the purchase or sale of a security. Any decision to purchase securities mentioned in these reports must take into account existing public information on such securities or any registered prospectus.To the extent permitted by law, neither Navellier & Associates, Inc., nor any of its affiliates, agents, or service providers assumes any liability or responsibility nor owes any duty of care for any consequences of any person acting or refraining to act in reliance on the information contained in this communication or for any decision based on it.
Past performance is no indication of future results. Investment in securities involves significant risk and has the potential for partial or complete loss of funds invested. It should not be assumed that any securities recommendations made by Navellier. in the future will be profitable or equal the performance of securities made in this report. Dividend payments are not guaranteed. The amount of a dividend payment, if any, can vary over time and issuers may reduce dividends paid on securities in the event of a recession or adverse event affecting a specific industry or issuer.
None of the stock information, data, and company information presented herein constitutes a recommendation by Navellier or a solicitation to buy or sell any securities. Any specific securities identified and described do not represent all of the securities purchased, sold, or recommended for advisory clients. The holdings identified do not represent all of the securities purchased, sold, or recommended for advisory clients and the reader should not assume that investments in the securities identified and discussed were or will be profitable.
Information presented is general information that does not take into account your individual circumstances, financial situation, or needs, nor does it present a personalized recommendation to you. Individual stocks presented may not be suitable for every investor. Investment in securities involves significant risk and has the potential for partial or complete loss of funds invested. Investment in fixed income securities has the potential for the investment return and principal value of an investment to fluctuate so that an investor’s holdings, when redeemed, may be worth less than their original cost.
One cannot invest directly in an index. Index is unmanaged and index performance does not reflect deduction of fees, expenses, or taxes. Presentation of Index data does not reflect a belief by Navellier that any stock index constitutes an investment alternative to any Navellier equity strategy or is necessarily comparable to such strategies. Among the most important differences between the Indices and Navellier strategies are that the Navellier equity strategies may (1) incur material management fees, (2) concentrate its investments in relatively few stocks, industries, or sectors, (3) have significantly greater trading activity and related costs, and (4) be significantly more or less volatile than the Indices.
ETF Risk: We may invest in exchange traded funds (“ETFs”) and some of our investment strategies are generally fully invested in ETFs. Like traditional mutual funds, ETFs charge asset-based fees, but they generally do not charge initial sales charges or redemption fees and investors typically pay only customary brokerage fees to buy and sell ETF shares. The fees and costs charged by ETFs held in client accounts will not be deducted from the compensation the client pays Navellier. ETF prices can fluctuate up or down, and a client account could lose money investing in an ETF if the prices of the securities owned by the ETF go down. ETFs are subject to additional risks:
- ETF shares may trade above or below their net asset value;
- An active trading market for an ETF’s shares may not develop or be maintained;
- The value of an ETF may be more volatile than the underlying portfolio of securities the ETF is designed to track;
- The cost of owning shares of the ETF may exceed those a client would incur by directly investing in the underlying securities; and
- Trading of an ETF’s shares may be halted if the listing exchange’s officials deem it appropriate, the shares are delisted from the exchange, or the activation of market-wide “circuit breakers” (which are tied to large decreases in stock prices) halts stock trading generally.
Grader Disclosures: Investment in equity strategies involves substantial risk and has the potential for partial or complete loss of funds invested. The sample portfolio and any accompanying charts are for informational purposes only and are not to be construed as a solicitation to buy or sell any financial instrument and should not be relied upon as the sole factor in an investment making decision. As a matter of normal and important disclosures to you, as a potential investor, please consider the following: The performance presented is not based on any actual securities trading, portfolio, or accounts, and the reported performance of the A, B, C, D, and F portfolios (collectively the “model portfolios”) should be considered mere “paper” or pro forma performance results based on Navellier’s research.
Investors evaluating any of Navellier & Associates, Inc.’s, (or its affiliates’) Investment Products must not use any information presented here, including the performance figures of the model portfolios, in their evaluation of any Navellier Investment Products. Navellier Investment Products include the firm’s mutual funds and managed accounts. The model portfolios, charts, and other information presented do not represent actual funded trades and are not actual funded portfolios. There are material differences between Navellier Investment Products’ portfolios and the model portfolios, research, and performance figures presented here. The model portfolios and the research results (1) may contain stocks or ETFs that are illiquid and difficult to trade; (2) may contain stock or ETF holdings materially different from actual funded Navellier Investment Product portfolios; (3) include the reinvestment of all dividends and other earnings, estimated trading costs, commissions, or management fees; and, (4) may not reflect prices obtained in an actual funded Navellier Investment Product portfolio. For these and other reasons, the reported performances of model portfolios do not reflect the performance results of Navellier’s actually funded and traded Investment Products. In most cases, Navellier’s Investment Products have materially lower performance results than the performances of the model portfolios presented.
This report contains statements that are, or may be considered to be, forward-looking statements. All statements that are not historical facts, including statements about our beliefs or expectations, are “forward-looking statements” within the meaning of The U.S. Private Securities Litigation Reform Act of 1995. These statements may be identified by such forward-looking terminology as “expect,” “estimate,” “plan,” “intend,” “believe,” “anticipate,” “may,” “will,” “should,” “could,” “continue,” “project,” or similar statements or variations of such terms. Our forward-looking statements are based on a series of expectations, assumptions, and projections, are not guarantees of future results or performance, and involve substantial risks and uncertainty as described in Form ADV Part 2A of our filing with the Securities and Exchange Commission (SEC), which is available at www.adviserinfo.sec.gov or by requesting a copy by emailing info@navellier.com. All of our forward-looking statements are as of the date of this report only. We can give no assurance that such expectations or forward-looking statements will prove to be correct. Actual results may differ materially. You are urged to carefully consider all such factors.
FEDERAL TAX ADVICE DISCLAIMER: As required by U.S. Treasury Regulations, you are informed that, to the extent this presentation includes any federal tax advice, the presentation is not written by Navellier to be used, and cannot be used, for the purpose of avoiding federal tax penalties. Navellier does not advise on any income tax requirements or issues. Use of any information presented by Navellier is for general information only and does not represent tax advice either express or implied. You are encouraged to seek professional tax advice for income tax questions and assistance.
IMPORTANT NEWSLETTER DISCLOSURE:The hypothetical performance results for investment newsletters that are authored or edited by Louis Navellier, including Louis Navellier’s Growth Investor, Louis Navellier’s Breakthrough Stocks, Louis Navellier’s Accelerated Profits, and Louis Navellier’s Platinum Club, are not based on any actual securities trading, portfolio, or accounts, and the newsletters’ reported hypothetical performances should be considered mere “paper” or proforma hypothetical performance results and are not actual performance of real world trades. Navellier & Associates, Inc. does not have any relation to or affiliation with the owner of these newsletters. There are material differences between Navellier Investment Products’ portfolios and the InvestorPlace Media, LLC newsletter portfolios authored by Louis Navellier. The InvestorPlace Media, LLC newsletters contain hypothetical performance that do not include transaction costs, advisory fees, or other fees a client might incur if actual investments and trades were being made by an investor. As a result, newsletter performance should not be used to evaluate Navellier Investment services which are separate and different from the newsletters. The owner of the newsletters is InvestorPlace Media, LLC and any questions concerning the newsletters, including any newsletter advertising or hypothetical Newsletter performance claims, (which are calculated solely by Investor Place Media and not Navellier) should be referred to InvestorPlace Media, LLC at (800) 718-8289.
Please note that Navellier & Associates and the Navellier Private Client Group are managed completely independent of the newsletters owned and published by InvestorPlace Media, LLC and written and edited by Louis Navellier, and investment performance of the newsletters should in no way be considered indicative of potential future investment performance for any Navellier & Associates separately managed account portfolio. Potential investors should consult with their financial advisor before investing in any Navellier Investment Product.
Navellier claims compliance with Global Investment Performance Standards (GIPS). To receive a complete list and descriptions of Navellier’s composites and/or a presentation that adheres to the GIPS standards, please contact Navellier or click here. It should not be assumed that any securities recommendations made by Navellier & Associates, Inc. in the future will be profitable or equal the performance of securities made in this report.
FactSet Disclosure: Navellier does not independently calculate the statistical information included in the attached report. The calculation and the information are provided by FactSet, a company not related to Navellier. Although information contained in the report has been obtained from FactSet and is based on sources Navellier believes to be reliable, Navellier does not guarantee its accuracy, and it may be incomplete or condensed. The report and the related FactSet sourced information are provided on an “as is” basis. The user assumes the entire risk of any use made of this information. Investors should consider the report as only a single factor in making their investment decision. The report is for informational purposes only and is not intended as an offer or solicitation for the purchase or sale of a security. FactSet sourced information is the exclusive property of FactSet. Without prior written permission of FactSet, this information may not be reproduced, disseminated or used to create any financial products. All indices are unmanaged and performance of the indices include reinvestment of dividends and interest income, unless otherwise noted, are not illustrative of any particular investment and an investment cannot be made in any index. Past performance is no guarantee of future results.