by Gary Alexander
January 23, 2024
So Why Do We Trade On It?
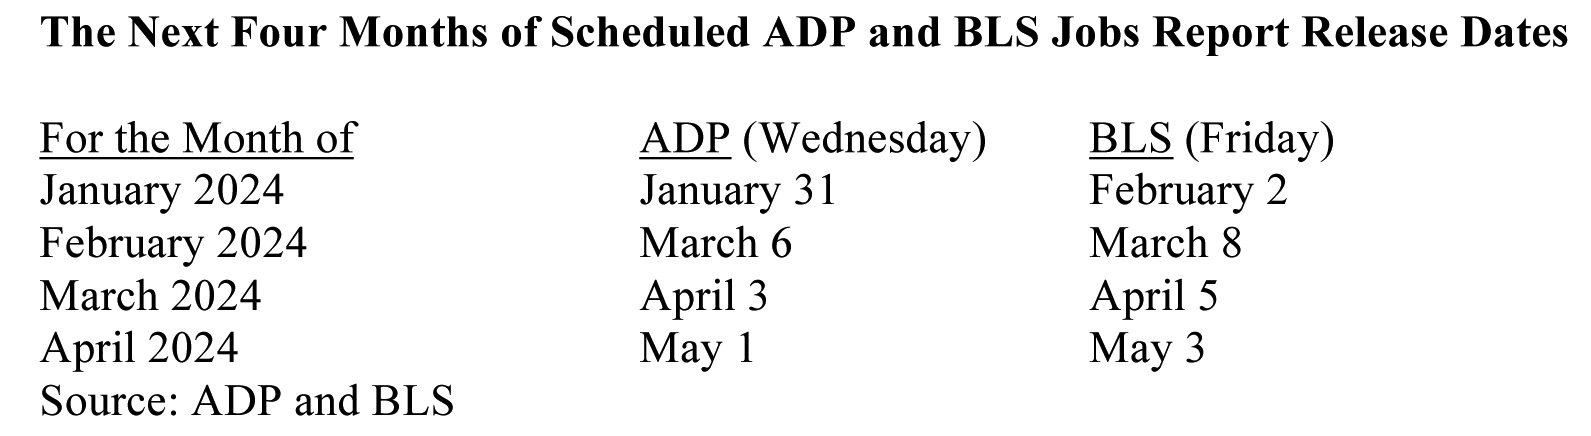
Next Week, January 31 falls on a Wednesday. Come 8:30 (EST), Friday morning, the Bureau of Labor Statistics (BLS) will throw out a number of the total jobs created in January – that notorious month of part-time labor lost after the Christmas shopping season. That number will quietly be adjusted by an arcane “seasonal” formula that only a PhD economist could dream up, and then the stock market will surge (or fall) based on that phony number. Fittingly, that nonsense will happen on Groundhog Day, a holiday based on a rodent, now more famous as a Bill Murray movie about an endlessly repeating day.
Why do I call that jobs number bogus? For evidence, look at the recent monthly revisions. The number of jobs created each month was revised down in 10 of the last 11 months, and these cumulative revisions were ratcheted down by a huge total of 443,000 jobs, the largest downward revisions outside of a recession year since 2002, and yet those buoyant initial monthly jobs figures tended to move the market up each first Friday of the month. Like Charlie Brown kicking at Lucy’s ever disappearing football, it makes you wonder when young Chuckster will wise up to reality. Consider this reality: Is it possible that the bean counters at the Bureau of Labor Statistics can count all the new jobs in the nation in just a few hours after the close of each month – or that their “seasonal adjustments” aren’t just political happy dust?
In looking at the latest (December) jobs report, I noticed this footnote about the wide range of revisions:
“The confidence interval for the monthly change in total non-farm employment from the establishment survey is on the order of plus or minus 130,000. Suppose the estimate of non-farm employment increases by 50,000 from one month to the next. The 90-percent confidence interval on the monthly change would range from -80,000 to +180,000 (50,000 +/- 130,000).”
That explains the wide variance in future revisions. You simply can’t count on an accurate figure the first or second day – or really the first week – after the end of the month, especially when based on interviews with real human beings, who have their own agenda in answering questions from government agents.
Inside the Official (versus Real) December 2023 Jobs Report
Here’s how to dissect a monthly jobs report. In the latest jobs report, the “headline” number was a +216,000 monthly “non-farm payroll” increase in December. But let’s look at some details for clarity.
• If you take out the 52,000 bump in government payrolls, the gain is whittled down to 164,000. The BLS December report said, “Government added an average of 56,000 jobs per month in 2023, more than double the average monthly gain of 23,000 in 2022.” (Those aren’t productive private-sector jobs).
• The October and November payrolls were revised down by 71,000, so make that a net +93,000 gain.
• There are still 8.8 million job openings (see the chart below). Also, Fed Chair Jerome Powell says that there are 2.5 million more unemployed workers than job offerings (mostly because 49% of small business owners said last month that there were no qualified applicants for their job openings).
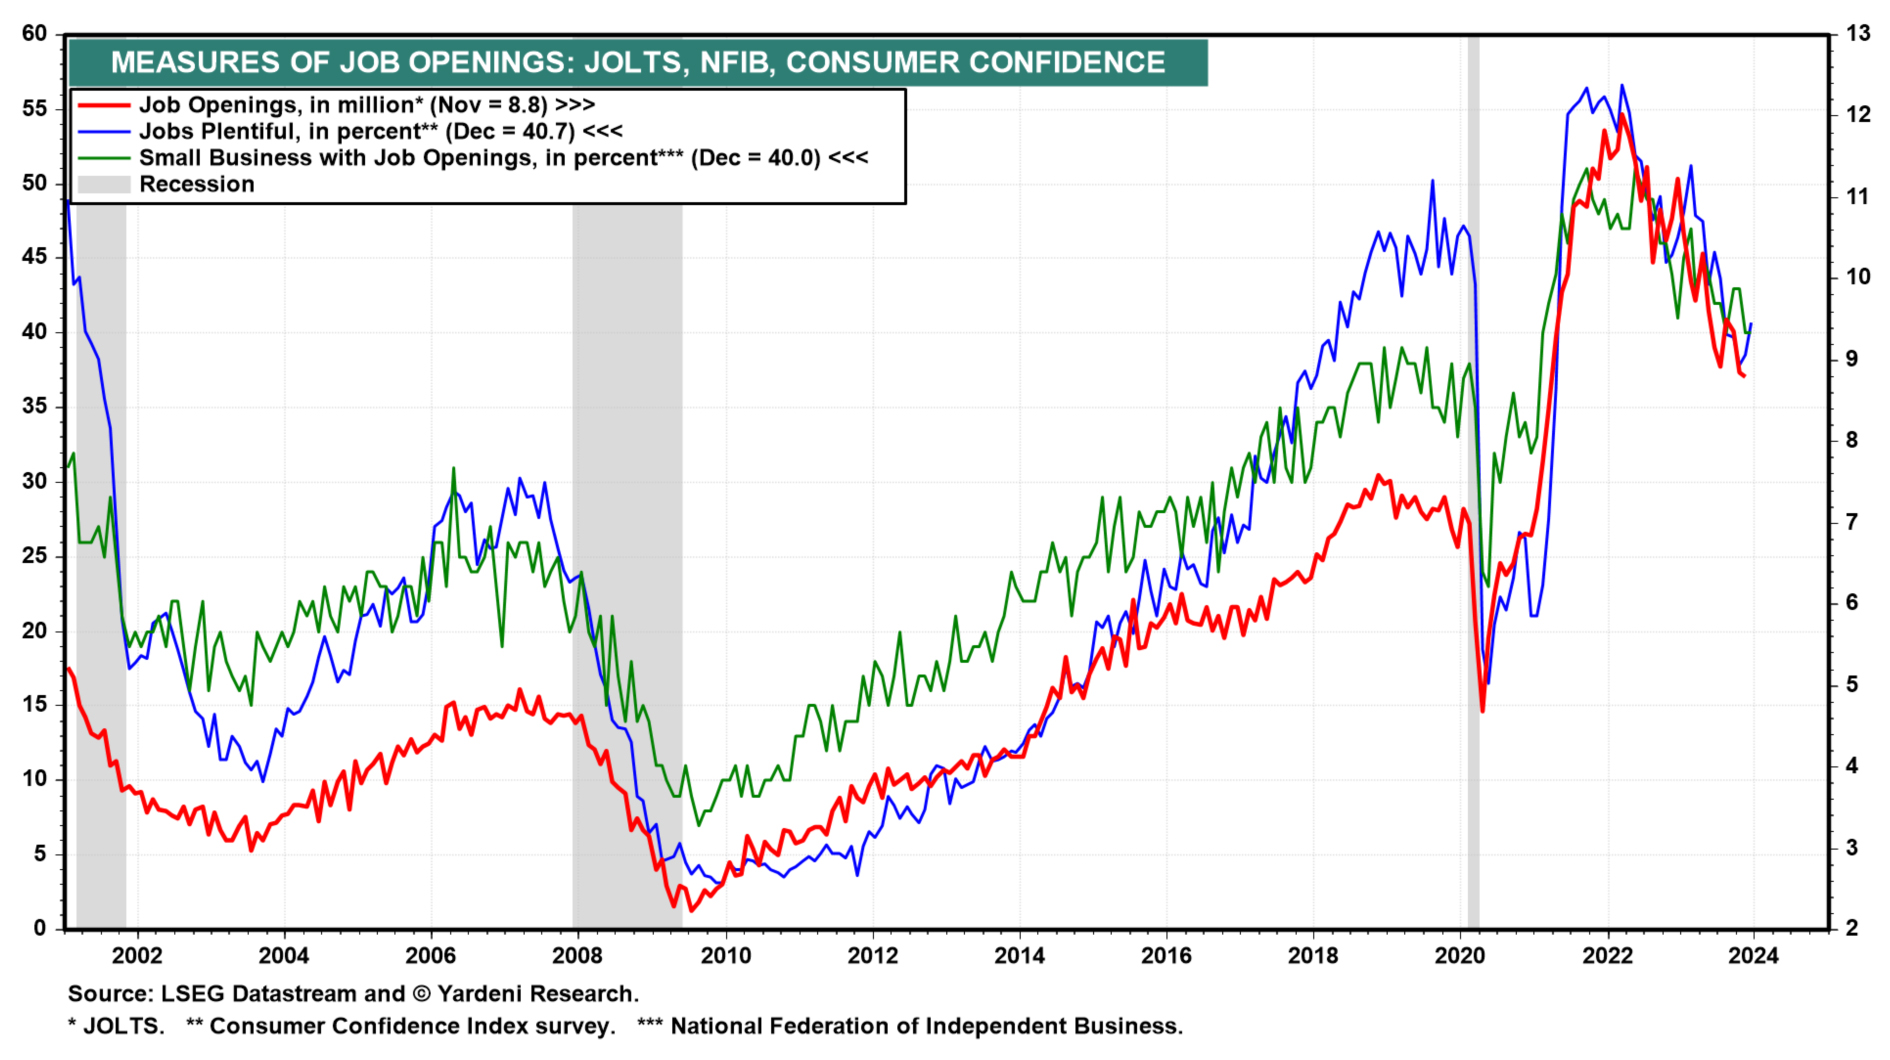
Graphs are for illustrative and discussion purposes only. Please read important disclosures at the end of this commentary.
- The unemployment rate was only 3.7% in December, but 845,000 workers disappeared from the labor force in December, since the labor force participation rate declined by 0.3 points to 62.5%, the biggest monthly drop in almost three years (since January 2021). The BLS only counts people who say they are “looking for work” as unemployed persons. Those who have dropped out are not counted as jobless.
This brings up the subject of how jobs (and the jobless) are counted. The BLS has two surveys each month – one being the household survey, to determine how many people are working or are looking for work, and the other is the establishment survey, to ask businesses how many people work there.
This gets into human nature and how people answer surveys: What is a job, and how (or why) would a clever person answer a complex question with a yes-no answer? In the household survey, you may be working part-time for money (and big-time in the underground economy for untaxed money). Would you admit to two jobs? Probably not. And how would a guy like me answer that question? I’m 78 and I work part-time writing about economics for Louis Navellier. Is that a job? You tell me. It sounds like fun.
When it comes to the business survey, a small business owner might employ a handful of part-time migrants. Which are workers, and which are transients? A government phone surveyor calls in: “How many people work there?” The business owner takes out a pencil and tallies up names. How many are taking trips as semi-sabbaticals? In this age of fun-employment Generation Z baristas, it’s hard to tell.
With that in mind, here’s how the BLS finesses the middle ground of non-working non-job seekers in their latest “Household Survey” for the December 2023 jobs report, released Friday, January 6, 2024:
“The number of persons not in the labor force who currently want a job edged up to 5.7 million in December and was up by 514,000 over the year. These individuals were not counted as unemployed because they were not actively looking for work during the 4 weeks preceding the survey or were unavailable to take a job. Among those not in the labor force who wanted a job, the number of persons marginally attached to the labor force changed little at 1.6 million in December but was up by 306,000 over the year. These individuals wanted and were available for work and had looked for a job some-time in the prior 12 months but had not looked for work in the 4 weeks preceding the survey. The number of discouraged workers, a subset of the marginally attached who believed that no jobs were available for them, at 346,000, was little changed in December and over the year.”
Confused? Me too. There is a lot of middle ground between work and no work. In contrast, the ADP jobs survey, published on the Wednesday before the Friday BLS report, is based on actual payroll reports made by the company in charge of processing actual payrolls, Automatic Data Processing (ADP).
I would trust ADP data before placing stock market bets based on premature BLS jobs data. ADP has the added virtue of only covering private sector, not government jobs, which add zero to the economy.
All content above represents the opinion of Gary Alexander of Navellier & Associates, Inc.
Also In This Issue
A Look Ahead by Louis Navellier
European Leaders Are Anxious About a Possible Trump Win
Income Mail by Bryan Perry
It Seems Like Living With 3%-4% Inflation Is OK With Mr. Market
Growth Mail by Gary Alexander
The Monthly Jobs Data is Bogus and Premature…
Global Mail by Ivan Martchev
Fresh All-Time Highs Across the Board
Sector Spotlight by Jason Bodner
My Cure for Any Market Blues
View Full Archive
Read Past Issues Here
About The Author

Gary Alexander
SENIOR EDITOR
Gary Alexander has been Senior Writer at Navellier since 2009. He edits Navellier’s weekly Marketmail and writes a weekly Growth Mail column, in which he uses market history to support the case for growth stocks. For the previous 20 years before joining Navellier, he was Senior Executive Editor at InvestorPlace Media (formerly Phillips Publishing), where he worked with several leading investment analysts, including Louis Navellier (since 1997), helping launch Louis Navellier’s Blue Chip Growth and Global Growth newsletters.
Prior to that, Gary edited Wealth Magazine and Gold Newsletter and wrote various investment research reports for Jefferson Financial in New Orleans in the 1980s. He began his financial newsletter career with KCI Communications in 1980, where he served as consulting editor for Personal Finance newsletter while serving as general manager of KCI’s Alexandria House book division. Before that, he covered the economics beat for news magazines. All content of “Growth Mail” represents the opinion of Gary Alexander
Important Disclosures:
Although information in these reports has been obtained from and is based upon sources that Navellier believes to be reliable, Navellier does not guarantee its accuracy and it may be incomplete or condensed. All opinions and estimates constitute Navellier’s judgment as of the date the report was created and are subject to change without notice. These reports are for informational purposes only and are not a solicitation for the purchase or sale of a security. Any decision to purchase securities mentioned in these reports must take into account existing public information on such securities or any registered prospectus.To the extent permitted by law, neither Navellier & Associates, Inc., nor any of its affiliates, agents, or service providers assumes any liability or responsibility nor owes any duty of care for any consequences of any person acting or refraining to act in reliance on the information contained in this communication or for any decision based on it.
Past performance is no indication of future results. Investment in securities involves significant risk and has the potential for partial or complete loss of funds invested. It should not be assumed that any securities recommendations made by Navellier. in the future will be profitable or equal the performance of securities made in this report. Dividend payments are not guaranteed. The amount of a dividend payment, if any, can vary over time and issuers may reduce dividends paid on securities in the event of a recession or adverse event affecting a specific industry or issuer.
None of the stock information, data, and company information presented herein constitutes a recommendation by Navellier or a solicitation to buy or sell any securities. Any specific securities identified and described do not represent all of the securities purchased, sold, or recommended for advisory clients. The holdings identified do not represent all of the securities purchased, sold, or recommended for advisory clients and the reader should not assume that investments in the securities identified and discussed were or will be profitable.
Information presented is general information that does not take into account your individual circumstances, financial situation, or needs, nor does it present a personalized recommendation to you. Individual stocks presented may not be suitable for every investor. Investment in securities involves significant risk and has the potential for partial or complete loss of funds invested. Investment in fixed income securities has the potential for the investment return and principal value of an investment to fluctuate so that an investor’s holdings, when redeemed, may be worth less than their original cost.
One cannot invest directly in an index. Index is unmanaged and index performance does not reflect deduction of fees, expenses, or taxes. Presentation of Index data does not reflect a belief by Navellier that any stock index constitutes an investment alternative to any Navellier equity strategy or is necessarily comparable to such strategies. Among the most important differences between the Indices and Navellier strategies are that the Navellier equity strategies may (1) incur material management fees, (2) concentrate its investments in relatively few stocks, industries, or sectors, (3) have significantly greater trading activity and related costs, and (4) be significantly more or less volatile than the Indices.
ETF Risk: We may invest in exchange traded funds (“ETFs”) and some of our investment strategies are generally fully invested in ETFs. Like traditional mutual funds, ETFs charge asset-based fees, but they generally do not charge initial sales charges or redemption fees and investors typically pay only customary brokerage fees to buy and sell ETF shares. The fees and costs charged by ETFs held in client accounts will not be deducted from the compensation the client pays Navellier. ETF prices can fluctuate up or down, and a client account could lose money investing in an ETF if the prices of the securities owned by the ETF go down. ETFs are subject to additional risks:
- ETF shares may trade above or below their net asset value;
- An active trading market for an ETF’s shares may not develop or be maintained;
- The value of an ETF may be more volatile than the underlying portfolio of securities the ETF is designed to track;
- The cost of owning shares of the ETF may exceed those a client would incur by directly investing in the underlying securities; and
- Trading of an ETF’s shares may be halted if the listing exchange’s officials deem it appropriate, the shares are delisted from the exchange, or the activation of market-wide “circuit breakers” (which are tied to large decreases in stock prices) halts stock trading generally.
Grader Disclosures: Investment in equity strategies involves substantial risk and has the potential for partial or complete loss of funds invested. The sample portfolio and any accompanying charts are for informational purposes only and are not to be construed as a solicitation to buy or sell any financial instrument and should not be relied upon as the sole factor in an investment making decision. As a matter of normal and important disclosures to you, as a potential investor, please consider the following: The performance presented is not based on any actual securities trading, portfolio, or accounts, and the reported performance of the A, B, C, D, and F portfolios (collectively the “model portfolios”) should be considered mere “paper” or pro forma performance results based on Navellier’s research.
Investors evaluating any of Navellier & Associates, Inc.’s, (or its affiliates’) Investment Products must not use any information presented here, including the performance figures of the model portfolios, in their evaluation of any Navellier Investment Products. Navellier Investment Products include the firm’s mutual funds and managed accounts. The model portfolios, charts, and other information presented do not represent actual funded trades and are not actual funded portfolios. There are material differences between Navellier Investment Products’ portfolios and the model portfolios, research, and performance figures presented here. The model portfolios and the research results (1) may contain stocks or ETFs that are illiquid and difficult to trade; (2) may contain stock or ETF holdings materially different from actual funded Navellier Investment Product portfolios; (3) include the reinvestment of all dividends and other earnings, estimated trading costs, commissions, or management fees; and, (4) may not reflect prices obtained in an actual funded Navellier Investment Product portfolio. For these and other reasons, the reported performances of model portfolios do not reflect the performance results of Navellier’s actually funded and traded Investment Products. In most cases, Navellier’s Investment Products have materially lower performance results than the performances of the model portfolios presented.
This report contains statements that are, or may be considered to be, forward-looking statements. All statements that are not historical facts, including statements about our beliefs or expectations, are “forward-looking statements” within the meaning of The U.S. Private Securities Litigation Reform Act of 1995. These statements may be identified by such forward-looking terminology as “expect,” “estimate,” “plan,” “intend,” “believe,” “anticipate,” “may,” “will,” “should,” “could,” “continue,” “project,” or similar statements or variations of such terms. Our forward-looking statements are based on a series of expectations, assumptions, and projections, are not guarantees of future results or performance, and involve substantial risks and uncertainty as described in Form ADV Part 2A of our filing with the Securities and Exchange Commission (SEC), which is available at www.adviserinfo.sec.gov or by requesting a copy by emailing info@navellier.com. All of our forward-looking statements are as of the date of this report only. We can give no assurance that such expectations or forward-looking statements will prove to be correct. Actual results may differ materially. You are urged to carefully consider all such factors.
FEDERAL TAX ADVICE DISCLAIMER: As required by U.S. Treasury Regulations, you are informed that, to the extent this presentation includes any federal tax advice, the presentation is not written by Navellier to be used, and cannot be used, for the purpose of avoiding federal tax penalties. Navellier does not advise on any income tax requirements or issues. Use of any information presented by Navellier is for general information only and does not represent tax advice either express or implied. You are encouraged to seek professional tax advice for income tax questions and assistance.
IMPORTANT NEWSLETTER DISCLOSURE:The hypothetical performance results for investment newsletters that are authored or edited by Louis Navellier, including Louis Navellier’s Growth Investor, Louis Navellier’s Breakthrough Stocks, Louis Navellier’s Accelerated Profits, and Louis Navellier’s Platinum Club, are not based on any actual securities trading, portfolio, or accounts, and the newsletters’ reported hypothetical performances should be considered mere “paper” or proforma hypothetical performance results and are not actual performance of real world trades. Navellier & Associates, Inc. does not have any relation to or affiliation with the owner of these newsletters. There are material differences between Navellier Investment Products’ portfolios and the InvestorPlace Media, LLC newsletter portfolios authored by Louis Navellier. The InvestorPlace Media, LLC newsletters contain hypothetical performance that do not include transaction costs, advisory fees, or other fees a client might incur if actual investments and trades were being made by an investor. As a result, newsletter performance should not be used to evaluate Navellier Investment services which are separate and different from the newsletters. The owner of the newsletters is InvestorPlace Media, LLC and any questions concerning the newsletters, including any newsletter advertising or hypothetical Newsletter performance claims, (which are calculated solely by Investor Place Media and not Navellier) should be referred to InvestorPlace Media, LLC at (800) 718-8289.
Please note that Navellier & Associates and the Navellier Private Client Group are managed completely independent of the newsletters owned and published by InvestorPlace Media, LLC and written and edited by Louis Navellier, and investment performance of the newsletters should in no way be considered indicative of potential future investment performance for any Navellier & Associates separately managed account portfolio. Potential investors should consult with their financial advisor before investing in any Navellier Investment Product.
Navellier claims compliance with Global Investment Performance Standards (GIPS). To receive a complete list and descriptions of Navellier’s composites and/or a presentation that adheres to the GIPS standards, please contact Navellier or click here. It should not be assumed that any securities recommendations made by Navellier & Associates, Inc. in the future will be profitable or equal the performance of securities made in this report.
FactSet Disclosure: Navellier does not independently calculate the statistical information included in the attached report. The calculation and the information are provided by FactSet, a company not related to Navellier. Although information contained in the report has been obtained from FactSet and is based on sources Navellier believes to be reliable, Navellier does not guarantee its accuracy, and it may be incomplete or condensed. The report and the related FactSet sourced information are provided on an “as is” basis. The user assumes the entire risk of any use made of this information. Investors should consider the report as only a single factor in making their investment decision. The report is for informational purposes only and is not intended as an offer or solicitation for the purchase or sale of a security. FactSet sourced information is the exclusive property of FactSet. Without prior written permission of FactSet, this information may not be reproduced, disseminated or used to create any financial products. All indices are unmanaged and performance of the indices include reinvestment of dividends and interest income, unless otherwise noted, are not illustrative of any particular investment and an investment cannot be made in any index. Past performance is no guarantee of future results.