by Bryan Perry
January 23, 2024
It seems by now that even people without a penny in the stock market have heard that the Fed’s target rate for inflation and cutting interest rates is 2%. And while that objective sounds terrific, the world we live in is experiencing upward pricing pressure that makes this target elusive and seemingly unrealistic.
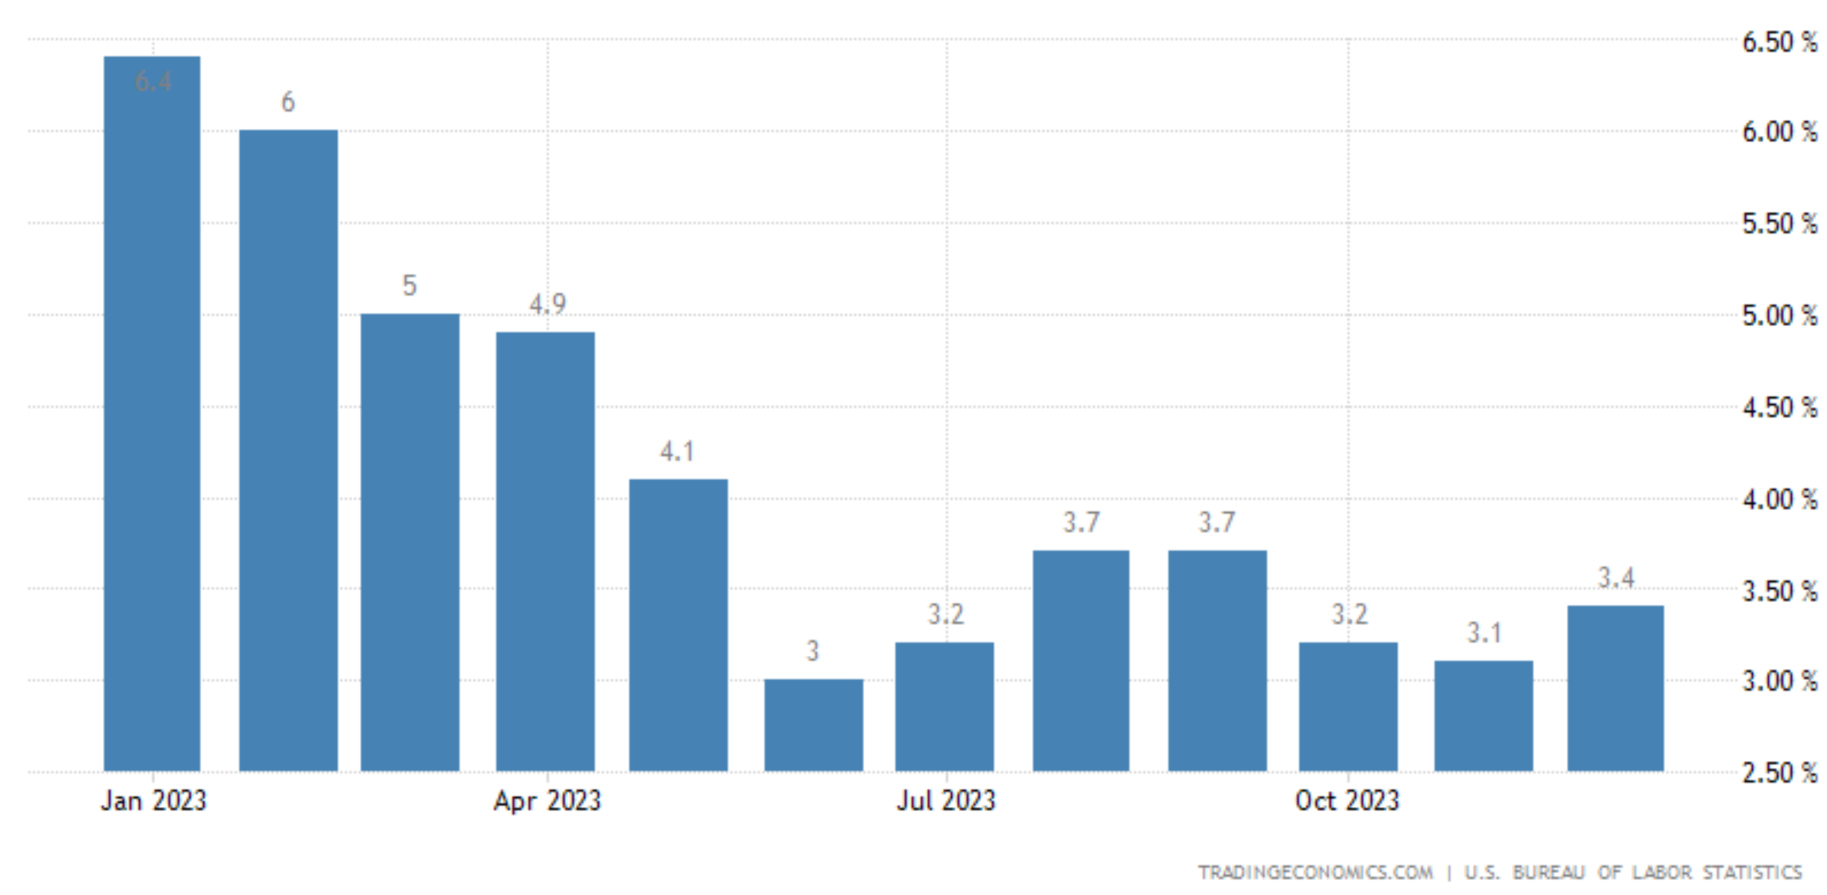
Within the latest Consumer Price Index (CPI) report for December, there were some components that highlight certain aspects of the economy that are experiencing ongoing higher costs associated with specific long-term underlying conditions that will not be resolved anytime soon. To the market’s credit, and to the consumer as well, some things are probably going to remain expensive indefinitely.
The total CPI was up 3.4% year-over-year, versus 3.1% in November, and core CPI was up 3.9% versus 4.0% in November. The key takeaway from this report is that inflation, while improved, has lost some of its downward momentum. Therefore, the Fed isn’t likely to be in a rush to cut interest rates – at least not based on this latest CPI reading. The higher-for-longer language can be squarely applied to shelter costs.
Graphs are for illustrative and discussion purposes only. Please read important disclosures at the end of this commentary.
Breaking down the CPI report further, it is clear that the cost of shelter, be it home ownership or rental units, remains stubbornly high. Strip out the cost of putting a roof over your head and inflation is running at 1.9%, but the shelter component is the biggest component of the CPI and it is a large pull on household budgets due to an ongoing supply shortage of affordable housing in the most desirable cities.
According to the CPI, released January 11, the shelter index increased 6.2% over the last year, accounting for over two thirds of the total increase in the “all items” total, less food and energy.
Some key data from the CPI include:
• The food index was up 0.2% month-over-month and 2.7% year-over-year.
• The energy index was up 0.4% month-over-month and down 2.0% year-over-year.
• The used cars and trucks index rose 0.5% month-over-month and was down 1.3% year-over-year.
• The shelter index was up 0.5% month-over-month and 6.2% year-over-year.
• The all items index less shelter was up 1.9% year-over-year.
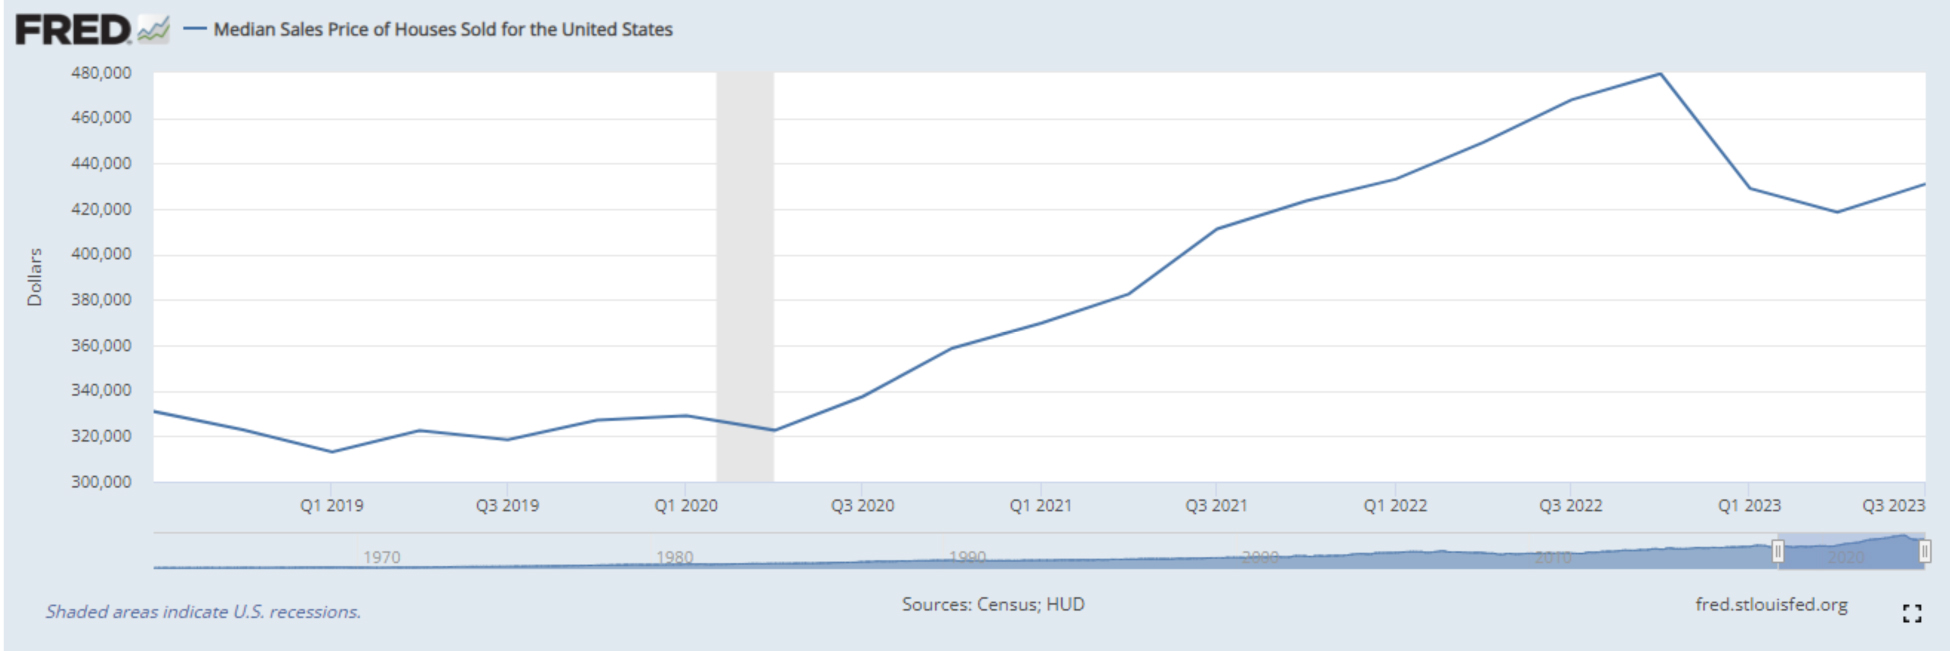
The factors contributing to higher-for-longer housing and rental costs are ongoing low supply, resulting from a work stoppage during the pandemic, strict zoning regulations, limiting the density and types of housing that can be built in certain areas, and the cost of construction materials, labor and land, making it more expensive to build new homes and full-featured apartment complexes.
In the first quarter of 2021, the median home price in the U.S. was $369,000, according to the Federal Reserve. Eleven quarter-point rate hikes later, the median home price in December was $382,600 and up 4.4% year-over-year, showing just how tight the market is for new home inventory.
Graphs are for illustrative and discussion purposes only. Please read important disclosures at the end of this commentary.
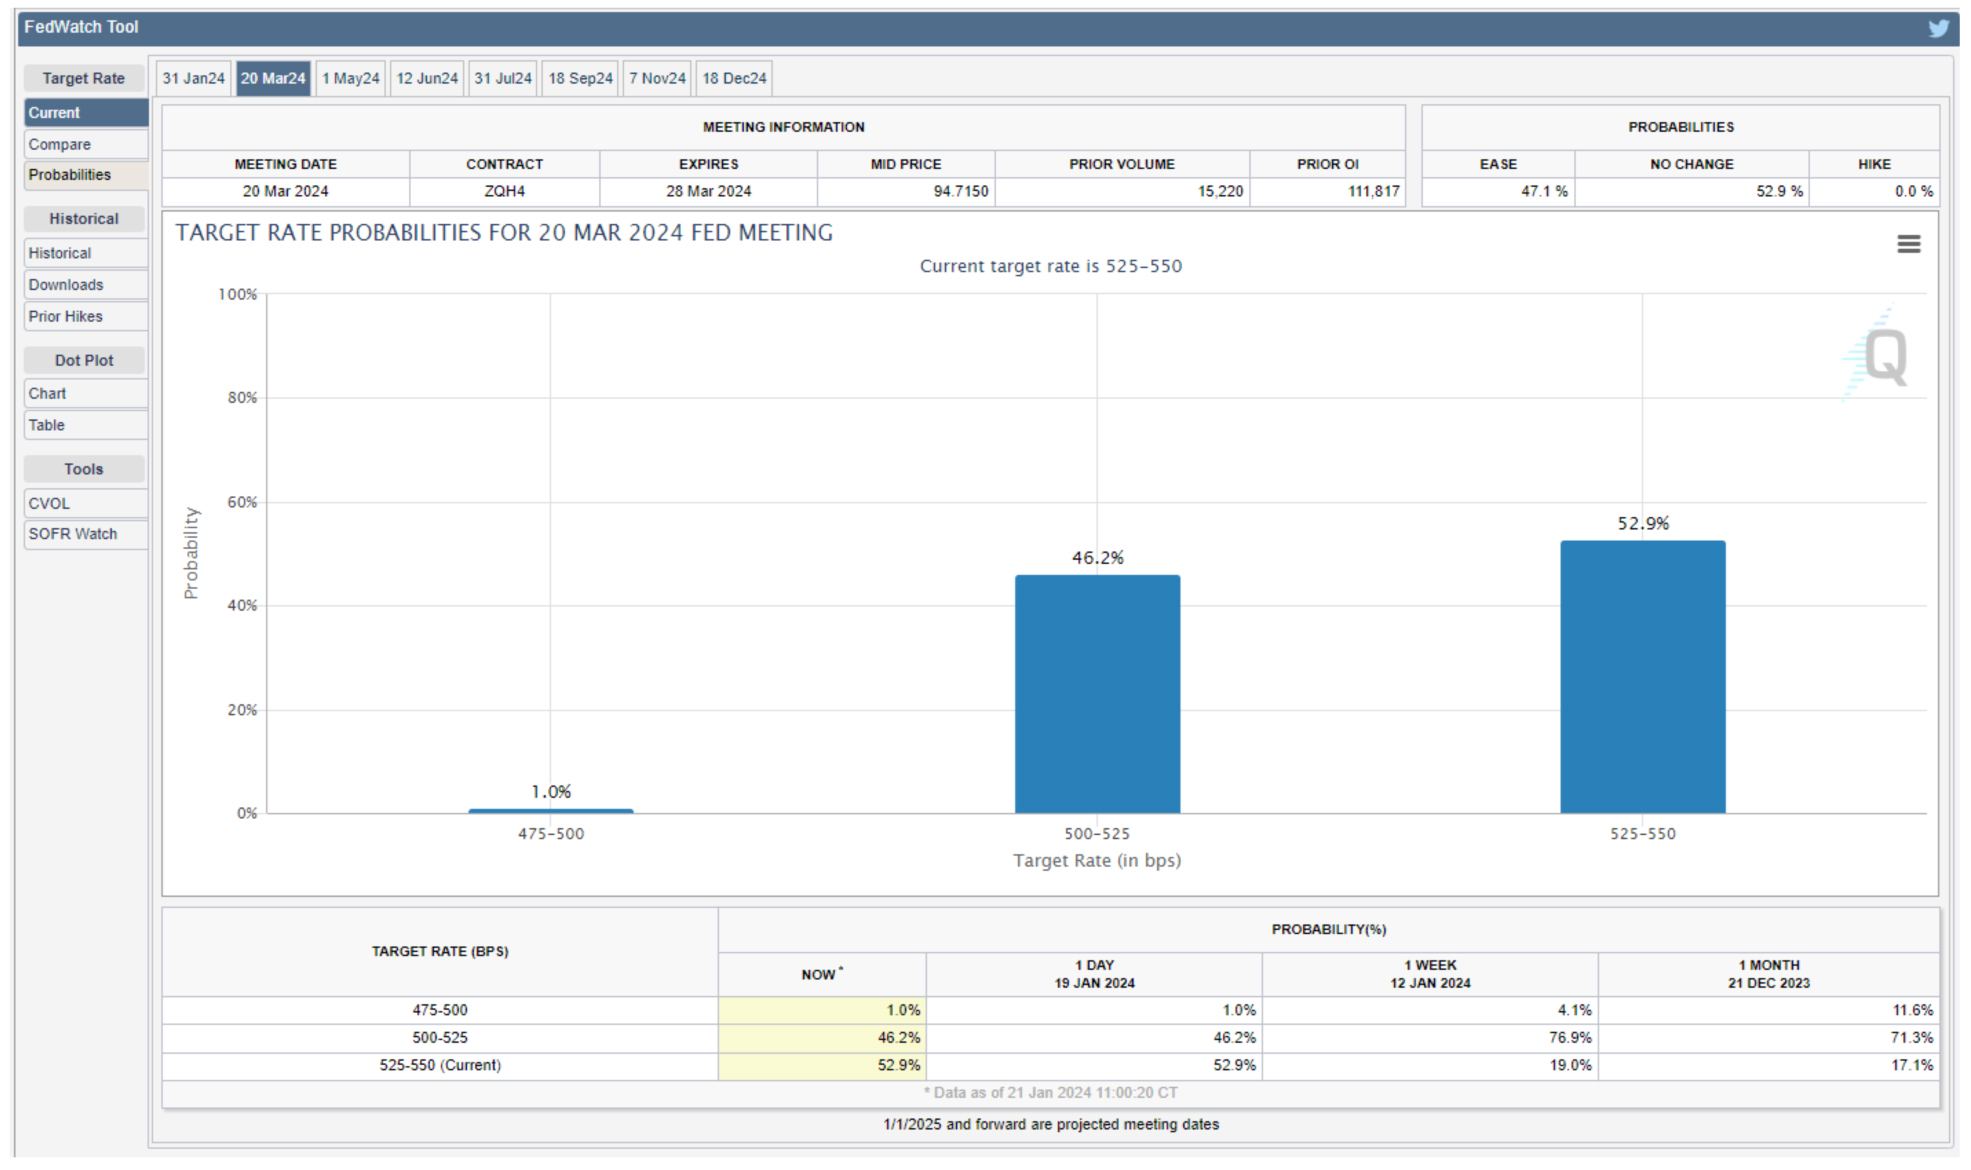
According to the current CME FedWatch Tool, there is a 46.2% probability of the Fed cutting the Fed Funds rate by a quarter-point to 5.00%-5.25% at the March 20 FOMC meeting and a 50% chance of a second quarter-point cut at the May 1 meeting. These numbers are well off the prior week, where the chance of a March cut was a dominating 76.9% before the release of the CPI report. Bond yields immediately backed up across the yield curve and stock prices gave ground against this new reality check.
Graphs are for illustrative and discussion purposes only. Please read important disclosures at the end of this commentary.
Another component of the CPI that is seeing higher ongoing costs is insurance, in all its forms – property insurance, rental insurance, motor vehicle insurance, health insurance, life insurance, disability insurance and other types of insurance. Per the latest CPI report, the cost of insurance accounted for 3.2% of the CPI weight, meaning for every $100 spent by urban consumers, $3.20 went to insurance payments.
The cost of car insurance alone was up 8.4% in 2023, according to research firm ValuPenguin, citing higher prices for cars, more traffic accidents, more car thefts, more weather-related damage, higher costs of maintenance, repairs, and medical treatment due to accidents.
A third component to inflation that isn’t likely to come down is the cost of professional services. Rising overhead costs related to rent, utilities, transportation, and wages for many professional services companies have all been raised sharply these past two years, when inflation took off. Companies are also investing in more training and technology to deliver better value to customers. Firms are being more selective about the projects they take on with a higher focus on profits and raising prices accordingly. Unless there is a deep recession, there will likely be further cost increases for essential services.
There may be some give back in food and energy prices, as has been the case in the past three weeks. And the cost of clothes, shoes, and the cost of other finished goods like consumer electronics will fluctuate lower during supply gluts, but there is likely to be very sticky pricing for shelter, insurance, professional services, medical care education and skills training for those entering the professional trades sector.
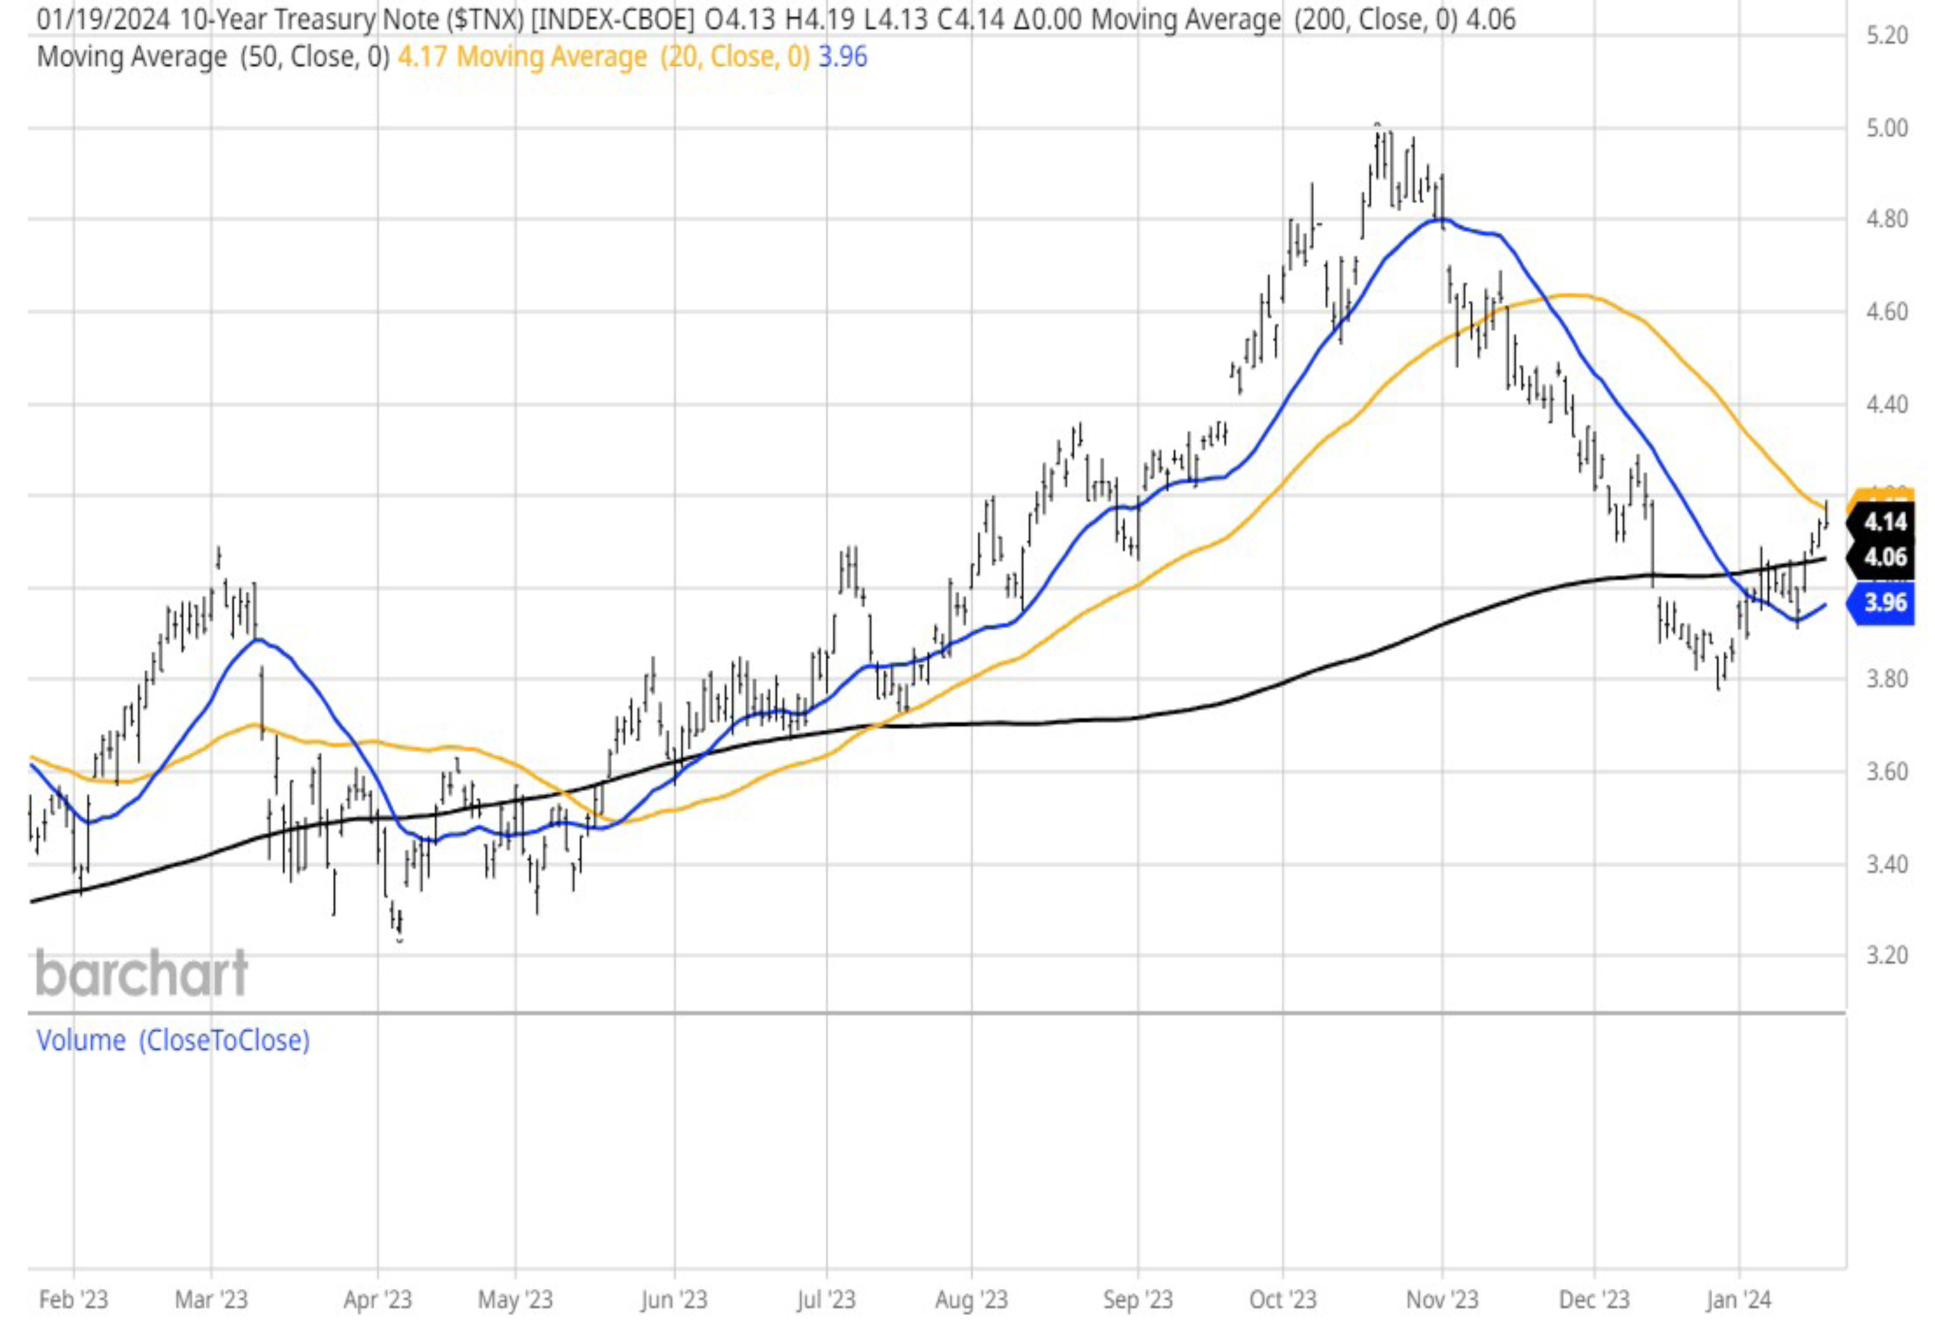
One can argue that going forward, again short of a broad and deep recession, inflation will likely run at an annual clip of 3%-4%, with the Fed probably having to adjust their long-term target to 3% from 2%. And here’s the good news: The stock market seems perfectly fine with this! The yield on the 10-year T-Note has risen from 3.78% to 4.20% in the past month with the Dow, S&P 500 and the NASDAQ at new highs.
Graphs are for illustrative and discussion purposes only. Please read important disclosures at the end of this commentary.
This market’s transition to a place where slow but steady economic growth comes with an acceptable rate of inflation is a new development and might be the new normal for the Fed in 2024. Bullish investors are buying into this narrative and is, in my opinion, why the market is trading better against a bond market that saw some selling pressure this past week. Bond prices got ahead of themselves and are normalizing to reflect a more probable Fed scenario and stocks are taking the least path of resistance – higher.
All content above represents the opinion of Bryan Perry of Navellier & Associates, Inc.
Also In This Issue
A Look Ahead by Louis Navellier
European Leaders Are Anxious About a Possible Trump Win
Income Mail by Bryan Perry
It Seems Like Living With 3%-4% Inflation Is OK With Mr. Market
Growth Mail by Gary Alexander
The Monthly Jobs Data is Bogus and Premature…
Global Mail by Ivan Martchev
Fresh All-Time Highs Across the Board
Sector Spotlight by Jason Bodner
My Cure for Any Market Blues
View Full Archive
Read Past Issues Here

Bryan Perry
SENIOR DIRECTOR
Bryan Perry is a Senior Director with Navellier Private Client Group, advising and facilitating high net worth investors in the pursuit of their financial goals.
Bryan’s financial services career spanning the past three decades includes over 20 years of wealth management experience with Wall Street firms that include Bear Stearns, Lehman Brothers and Paine Webber, working with both retail and institutional clients. Bryan earned a B.A. in Political Science from Virginia Polytechnic Institute & State University and currently holds a Series 65 license. All content of “Income Mail” represents the opinion of Bryan Perry
Important Disclosures:
Although information in these reports has been obtained from and is based upon sources that Navellier believes to be reliable, Navellier does not guarantee its accuracy and it may be incomplete or condensed. All opinions and estimates constitute Navellier’s judgment as of the date the report was created and are subject to change without notice. These reports are for informational purposes only and are not a solicitation for the purchase or sale of a security. Any decision to purchase securities mentioned in these reports must take into account existing public information on such securities or any registered prospectus.To the extent permitted by law, neither Navellier & Associates, Inc., nor any of its affiliates, agents, or service providers assumes any liability or responsibility nor owes any duty of care for any consequences of any person acting or refraining to act in reliance on the information contained in this communication or for any decision based on it.
Past performance is no indication of future results. Investment in securities involves significant risk and has the potential for partial or complete loss of funds invested. It should not be assumed that any securities recommendations made by Navellier. in the future will be profitable or equal the performance of securities made in this report. Dividend payments are not guaranteed. The amount of a dividend payment, if any, can vary over time and issuers may reduce dividends paid on securities in the event of a recession or adverse event affecting a specific industry or issuer.
None of the stock information, data, and company information presented herein constitutes a recommendation by Navellier or a solicitation to buy or sell any securities. Any specific securities identified and described do not represent all of the securities purchased, sold, or recommended for advisory clients. The holdings identified do not represent all of the securities purchased, sold, or recommended for advisory clients and the reader should not assume that investments in the securities identified and discussed were or will be profitable.
Information presented is general information that does not take into account your individual circumstances, financial situation, or needs, nor does it present a personalized recommendation to you. Individual stocks presented may not be suitable for every investor. Investment in securities involves significant risk and has the potential for partial or complete loss of funds invested. Investment in fixed income securities has the potential for the investment return and principal value of an investment to fluctuate so that an investor’s holdings, when redeemed, may be worth less than their original cost.
One cannot invest directly in an index. Index is unmanaged and index performance does not reflect deduction of fees, expenses, or taxes. Presentation of Index data does not reflect a belief by Navellier that any stock index constitutes an investment alternative to any Navellier equity strategy or is necessarily comparable to such strategies. Among the most important differences between the Indices and Navellier strategies are that the Navellier equity strategies may (1) incur material management fees, (2) concentrate its investments in relatively few stocks, industries, or sectors, (3) have significantly greater trading activity and related costs, and (4) be significantly more or less volatile than the Indices.
ETF Risk: We may invest in exchange traded funds (“ETFs”) and some of our investment strategies are generally fully invested in ETFs. Like traditional mutual funds, ETFs charge asset-based fees, but they generally do not charge initial sales charges or redemption fees and investors typically pay only customary brokerage fees to buy and sell ETF shares. The fees and costs charged by ETFs held in client accounts will not be deducted from the compensation the client pays Navellier. ETF prices can fluctuate up or down, and a client account could lose money investing in an ETF if the prices of the securities owned by the ETF go down. ETFs are subject to additional risks:
- ETF shares may trade above or below their net asset value;
- An active trading market for an ETF’s shares may not develop or be maintained;
- The value of an ETF may be more volatile than the underlying portfolio of securities the ETF is designed to track;
- The cost of owning shares of the ETF may exceed those a client would incur by directly investing in the underlying securities; and
- Trading of an ETF’s shares may be halted if the listing exchange’s officials deem it appropriate, the shares are delisted from the exchange, or the activation of market-wide “circuit breakers” (which are tied to large decreases in stock prices) halts stock trading generally.
Grader Disclosures: Investment in equity strategies involves substantial risk and has the potential for partial or complete loss of funds invested. The sample portfolio and any accompanying charts are for informational purposes only and are not to be construed as a solicitation to buy or sell any financial instrument and should not be relied upon as the sole factor in an investment making decision. As a matter of normal and important disclosures to you, as a potential investor, please consider the following: The performance presented is not based on any actual securities trading, portfolio, or accounts, and the reported performance of the A, B, C, D, and F portfolios (collectively the “model portfolios”) should be considered mere “paper” or pro forma performance results based on Navellier’s research.
Investors evaluating any of Navellier & Associates, Inc.’s, (or its affiliates’) Investment Products must not use any information presented here, including the performance figures of the model portfolios, in their evaluation of any Navellier Investment Products. Navellier Investment Products include the firm’s mutual funds and managed accounts. The model portfolios, charts, and other information presented do not represent actual funded trades and are not actual funded portfolios. There are material differences between Navellier Investment Products’ portfolios and the model portfolios, research, and performance figures presented here. The model portfolios and the research results (1) may contain stocks or ETFs that are illiquid and difficult to trade; (2) may contain stock or ETF holdings materially different from actual funded Navellier Investment Product portfolios; (3) include the reinvestment of all dividends and other earnings, estimated trading costs, commissions, or management fees; and, (4) may not reflect prices obtained in an actual funded Navellier Investment Product portfolio. For these and other reasons, the reported performances of model portfolios do not reflect the performance results of Navellier’s actually funded and traded Investment Products. In most cases, Navellier’s Investment Products have materially lower performance results than the performances of the model portfolios presented.
This report contains statements that are, or may be considered to be, forward-looking statements. All statements that are not historical facts, including statements about our beliefs or expectations, are “forward-looking statements” within the meaning of The U.S. Private Securities Litigation Reform Act of 1995. These statements may be identified by such forward-looking terminology as “expect,” “estimate,” “plan,” “intend,” “believe,” “anticipate,” “may,” “will,” “should,” “could,” “continue,” “project,” or similar statements or variations of such terms. Our forward-looking statements are based on a series of expectations, assumptions, and projections, are not guarantees of future results or performance, and involve substantial risks and uncertainty as described in Form ADV Part 2A of our filing with the Securities and Exchange Commission (SEC), which is available at www.adviserinfo.sec.gov or by requesting a copy by emailing info@navellier.com. All of our forward-looking statements are as of the date of this report only. We can give no assurance that such expectations or forward-looking statements will prove to be correct. Actual results may differ materially. You are urged to carefully consider all such factors.
FEDERAL TAX ADVICE DISCLAIMER: As required by U.S. Treasury Regulations, you are informed that, to the extent this presentation includes any federal tax advice, the presentation is not written by Navellier to be used, and cannot be used, for the purpose of avoiding federal tax penalties. Navellier does not advise on any income tax requirements or issues. Use of any information presented by Navellier is for general information only and does not represent tax advice either express or implied. You are encouraged to seek professional tax advice for income tax questions and assistance.
IMPORTANT NEWSLETTER DISCLOSURE:The hypothetical performance results for investment newsletters that are authored or edited by Louis Navellier, including Louis Navellier’s Growth Investor, Louis Navellier’s Breakthrough Stocks, Louis Navellier’s Accelerated Profits, and Louis Navellier’s Platinum Club, are not based on any actual securities trading, portfolio, or accounts, and the newsletters’ reported hypothetical performances should be considered mere “paper” or proforma hypothetical performance results and are not actual performance of real world trades. Navellier & Associates, Inc. does not have any relation to or affiliation with the owner of these newsletters. There are material differences between Navellier Investment Products’ portfolios and the InvestorPlace Media, LLC newsletter portfolios authored by Louis Navellier. The InvestorPlace Media, LLC newsletters contain hypothetical performance that do not include transaction costs, advisory fees, or other fees a client might incur if actual investments and trades were being made by an investor. As a result, newsletter performance should not be used to evaluate Navellier Investment services which are separate and different from the newsletters. The owner of the newsletters is InvestorPlace Media, LLC and any questions concerning the newsletters, including any newsletter advertising or hypothetical Newsletter performance claims, (which are calculated solely by Investor Place Media and not Navellier) should be referred to InvestorPlace Media, LLC at (800) 718-8289.
Please note that Navellier & Associates and the Navellier Private Client Group are managed completely independent of the newsletters owned and published by InvestorPlace Media, LLC and written and edited by Louis Navellier, and investment performance of the newsletters should in no way be considered indicative of potential future investment performance for any Navellier & Associates separately managed account portfolio. Potential investors should consult with their financial advisor before investing in any Navellier Investment Product.
Navellier claims compliance with Global Investment Performance Standards (GIPS). To receive a complete list and descriptions of Navellier’s composites and/or a presentation that adheres to the GIPS standards, please contact Navellier or click here. It should not be assumed that any securities recommendations made by Navellier & Associates, Inc. in the future will be profitable or equal the performance of securities made in this report.
FactSet Disclosure: Navellier does not independently calculate the statistical information included in the attached report. The calculation and the information are provided by FactSet, a company not related to Navellier. Although information contained in the report has been obtained from FactSet and is based on sources Navellier believes to be reliable, Navellier does not guarantee its accuracy, and it may be incomplete or condensed. The report and the related FactSet sourced information are provided on an “as is” basis. The user assumes the entire risk of any use made of this information. Investors should consider the report as only a single factor in making their investment decision. The report is for informational purposes only and is not intended as an offer or solicitation for the purchase or sale of a security. FactSet sourced information is the exclusive property of FactSet. Without prior written permission of FactSet, this information may not be reproduced, disseminated or used to create any financial products. All indices are unmanaged and performance of the indices include reinvestment of dividends and interest income, unless otherwise noted, are not illustrative of any particular investment and an investment cannot be made in any index. Past performance is no guarantee of future results.