
by Ivan Martchev
November 3, 2026
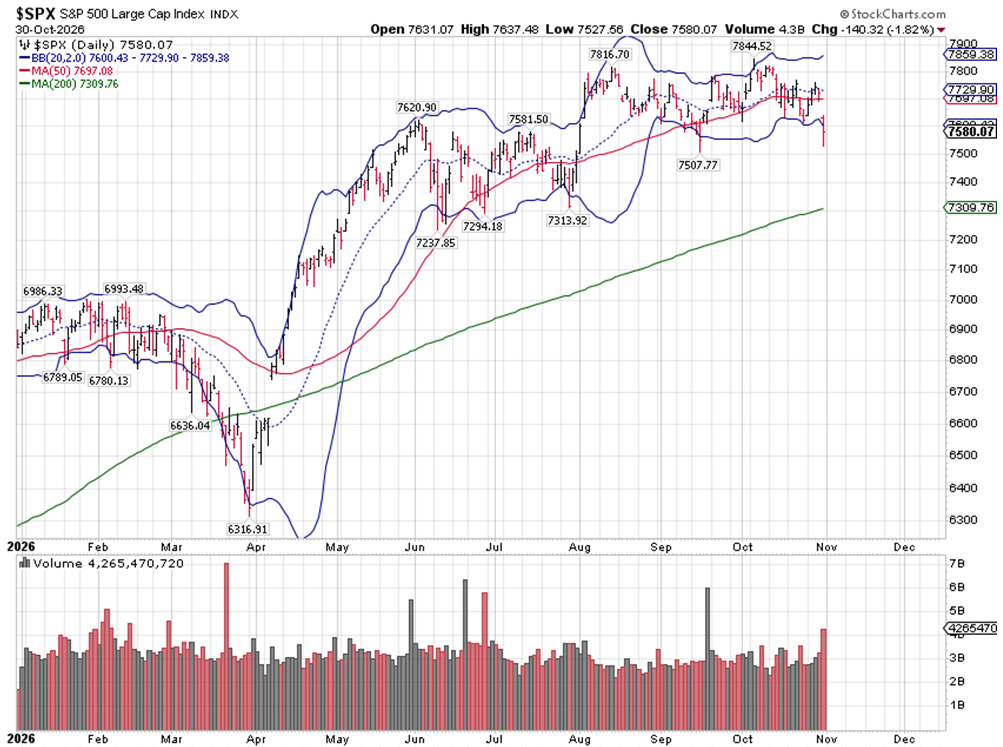
Last Friday’s market closed October with what could be called “disorderly and panicky” selling, which often happens near market buttons. Given the midterm elections have historically been a clearing event, we must consider how much of a “clearing event’ we’re likely to see if the Trump administration lands another “decapitation strike” on Iran, which they have said they are considering. Unfortunately, Iran, like a mythical three-headed monster, seems to be growing new heads faster than old heads can be removed.
Graphs are for illustrative and discussion purposes only. Please read important disclosures at the end of this commentary.
This week, I decided to draft my best-case, base-case and the worst-case scenarios for market bottoms:
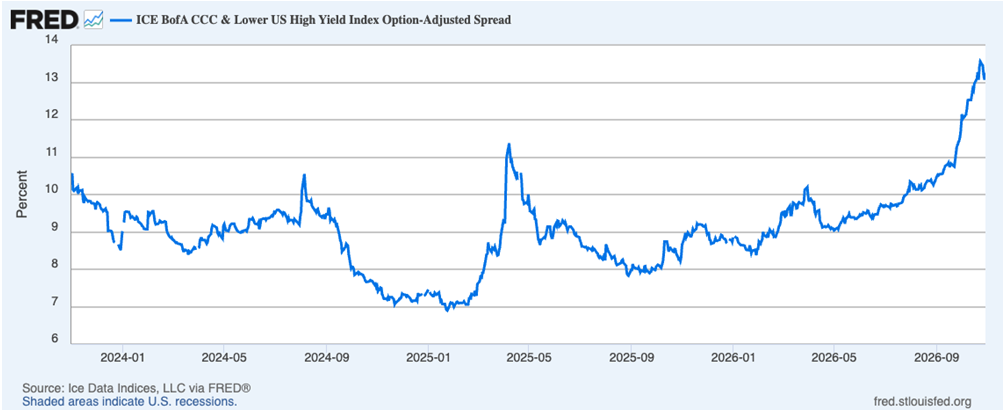
- The best-case is simple: the bottom was on Friday as the trading was disorderly and from a pure statistical perspective the S&P 500 closed more than two-standard deviations away from a 20-day moving average, below its lower Bollinger band, which in July and September led to fresh all-time highs. Also, Treasury rates have calmed down, and despite disorderly trading in the junkiest CCC bonds (only 9-10% of the market), higher grades of junk bonds like BB and B are far from distressed (about 90% of the market). I would give this best-case scenario a 15%-20% chance.
Graphs are for illustrative and discussion purposes only. Please read important disclosures at the end of this commentary.
- As a base-case scenario, the bottom may come any day this week or next. If we sell off further, the day after the election or the commencement of Iran Phase 2 may mark the bottom, and a buy signal. Everyone is tired of this war and wants it to end. With 60% of companies in the S&P 500 having reported, and EPS growth running a little over 30%, the stock market may be acting like a coiled spring. Believe it or not, share prices can go down on strong earnings, but if earnings continue to be strong, the market will likely not stay down. And the rebounds tend to be fierce. I would give the probability of hitting a stock market bottom this week or next a 60%-70% chance.
- The worst-case scenario has to do with the Iranian situation. If the war goes the wrong way and Iran manages to retaliate on Gulf infrastructure and U.S. military assets, the damage may be so large that the price of oil and price of LNG goes out of control. (More on this possibility later).
Graphs are for illustrative and discussion purposes only. Please read important disclosures at the end of this commentary.
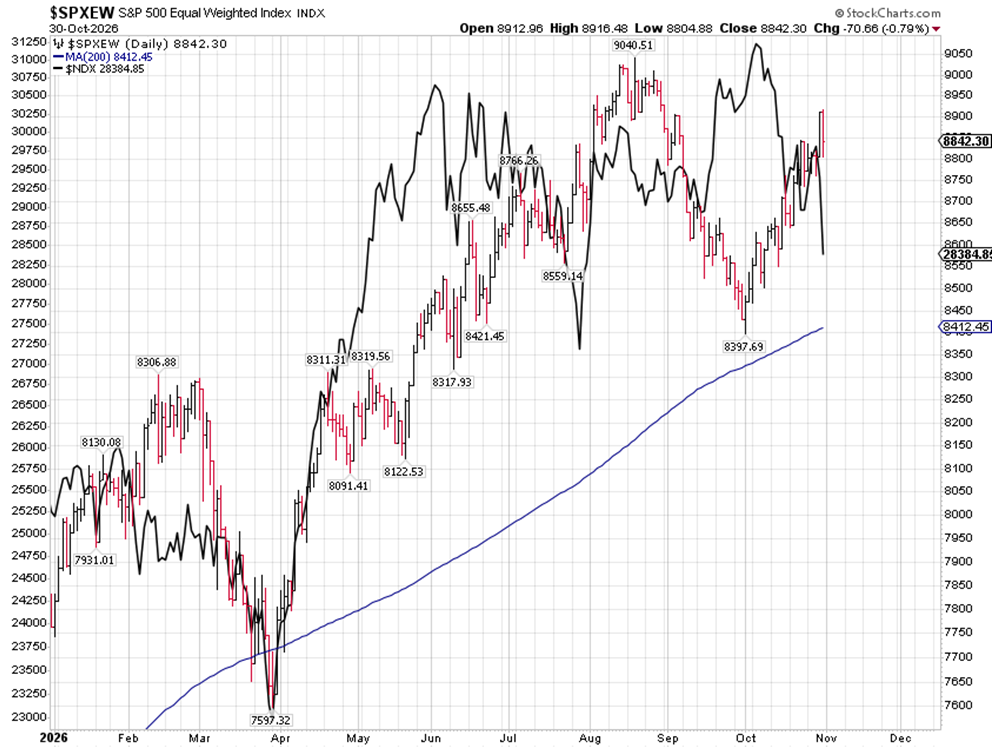
What I find fascinating is that the broad market, as measured by the S&P 500 Equal Weight index, went mostly straight down in September, mainly because of the Treasury yield spike. The broad market rallied in October on rotation out of tech and declining 10-year Treasury yield. In September, the tech sector bailed out the S&P 500 but not the S&P 500 Equal Weight, while in October the tech sector went more or less straight down (charted, above). This makes October more or less the exact opposite of September.
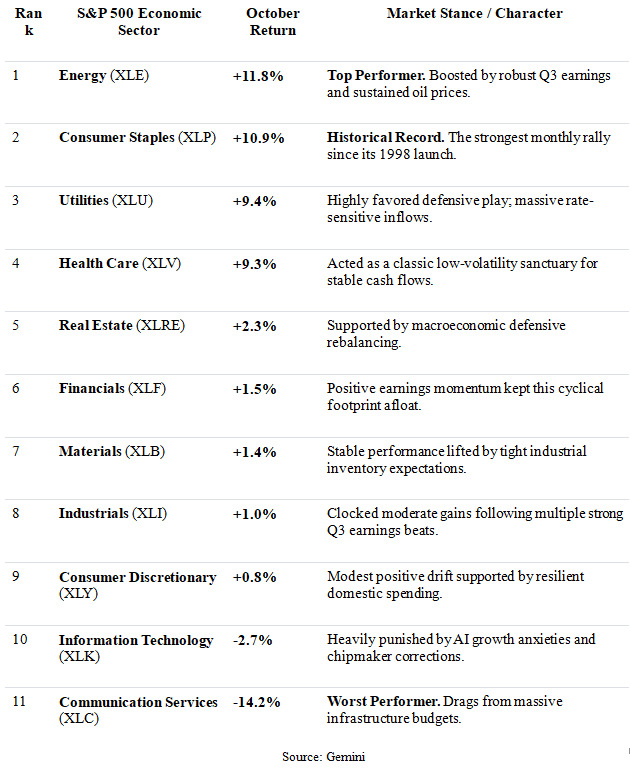
Here’s how the 11 S&P 500 sectors fared last month:
Graphs are for illustrative and discussion purposes only. Please read important disclosures at the end of this commentary.
As we move into November, there is one big fly still stuck in the ointment. Yes, we have very high EPS growth for the S&P 500, but two-companies comprise one-third of that ~30% growth, Nvidia and Micron.
Micron has already reported, and Nvidia hasn’t, but if one were to take Nvidia estimates and combine them with Micron’s reported results, then about 34% of EPS growth goes to just these two-companies out of 500 in the S&P 500. While Nvidia tends to beat estimates, and all its products of late have been on allocation, they sell their products as fast as they can make them, so the dominance of these stocks may very well rise to 36% of the EPS growth of the index for the quarter when Nvidia reports mid-November.
I am sure Nvidia will have great earnings. It has been a spectacular story, but the U.S. economy right now is experiencing AI spending that is above the level of spending on the internet boom in 1999-2000 as a percentage of nominal GDP if one were to consider all economic activity related to AI data-centers.
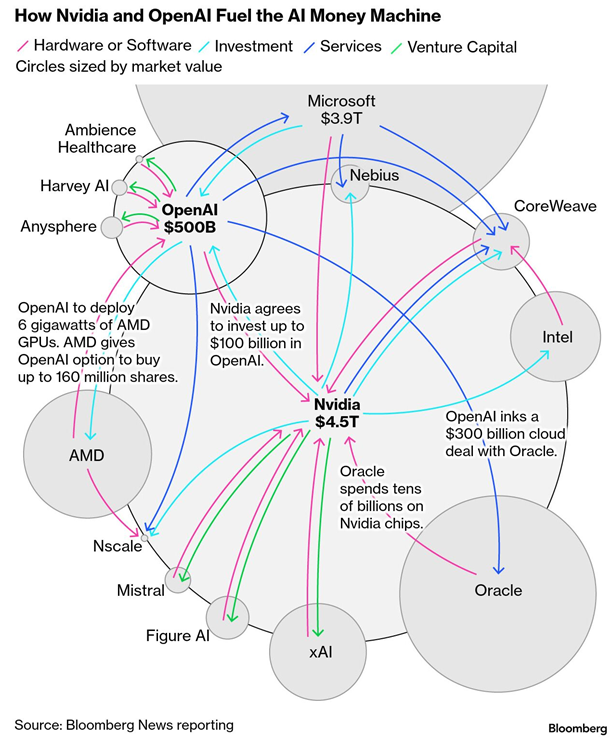
Because the level of spending is so high, despite signs of a return on investment on many fronts, investors are understandably nervous. A lot of that spending is happening with borrowed money, which has caused the cash-flow of major hyperscalers to go negative. It is a bit like the baseball epic, Field of Dreams: “If you build it, they will come.” I don’t like the circularity evident in some of that spending (see the chart below), but I think we are far from the profitless dumping of money into fiber optic cables in 1999-2000.
Graphs are for illustrative and discussion purposes only. Please read important disclosures at the end of this commentary.
This does not look like a top to me but more like an overdue shakeout in the technology sector.
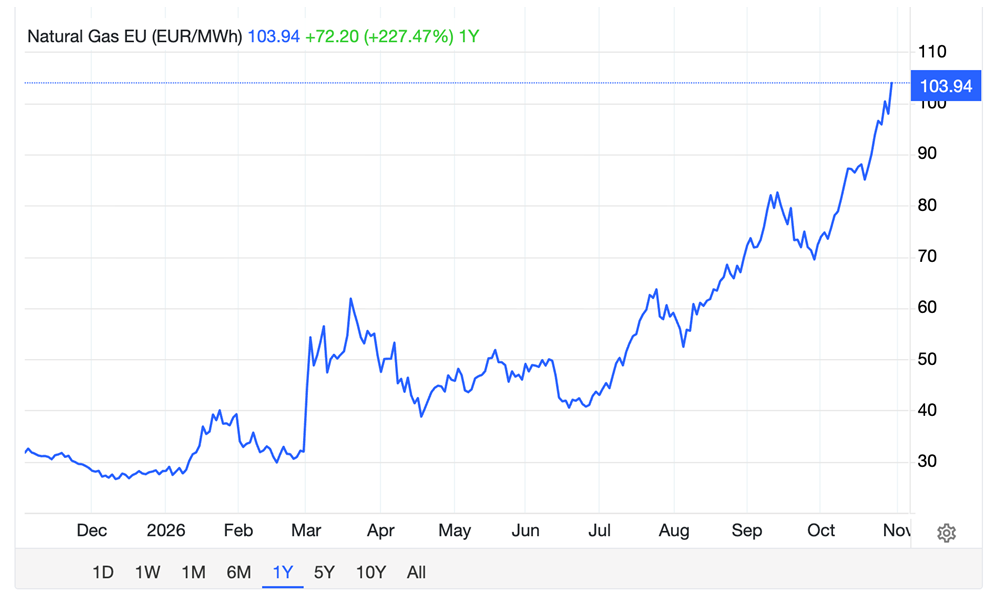
The worst case, as I said above, revolves around Iran and oil. There is enough oil in the U.S. but not in the rest of the world, which raises the U.S. price. There is also enough natural gas in the U.S. On Friday natural gas closed at just $2.89/mmBTU, while the European price keeps expanding the gap to the U.S. price. European natural gas closed on Friday at 103.94 EUR/Mwh (see chart, below), which comes out to $34.14/mmBTU in dollars, making it close to 12-times more expensive to Europeans than to Americans.
Graphs are for illustrative and discussion purposes only. Please read important disclosures at the end of this commentary.
In Europe and most places in Asia, there is not enough oil produced domestically, and there sure isn’t enough natural gas, as the war in Ukraine has resulted in disruption of pipeline supplies. The Europeans thought they could make it up with more expensive LNG, and the evidence so far is they cannot do that, as there is damage to Qatari LNG infrastructure, raising spot LNG prices globally. Some industries cannot operate profitably at current natural gas prices. Add diesel at all-time highs and we have a problem.
So, to avoid this worst-case scenario, I would hope that Iran Phase 2 goes well, or that there is a diplomatic breakthrough. If either of those happen, the chances for a strong finish to the year are high.
Navellier & Associates; own Nvidia (NVDA), Micron Technology, Inc. (MU), Advanced Micro Devices, Inc. (AMD), Oracle Corporation (ORCL) and Intel Corporation (INTC) in managed accounts. We do not own CoreWeave, Inc. Class A (CRWV). Ivan Martchev does not own Nvidia (NVDA), Micron Technology, Inc. (MU), Advanced Micro Devices, Inc. (AMD), Oracle Corporation (ORCL) or Intel Corporation (INTC) personally.
All content above represents the opinion of Ivan Martchev of Navellier & Associates, Inc.
Also In This Issue
A Look Ahead by Louis Navellier
Expect a Fractured G-20 Meeting in Florida Next Month
Income Mail by Bryan Perry
Using Energy Options to Take “Implied Market Volatility” to the Bank
Growth Mail by Gary Alexander
Today May Be the Best Day to Invest in the Post-Election Surge
Global Mail by Ivan Martchev
A Stock Market Bottom is Likely Within Reach
Sector Spotlight by Jason Bodner
Doubting the Future is Popular – But Not Very Profitable
Important Disclosures:
Although information in these reports has been obtained from and is based upon sources that Navellier believes to be reliable, Navellier does not guarantee its accuracy and it may be incomplete or condensed. All opinions and estimates constitute the authors opinions as of the date the report was created and are subject to change without notice. These reports are for informational purposes only and are not a solicitation for the purchase or sale of any securities or financial services. Any decision to purchase securities mentioned in these reports must take into account existing public information on such securities or any registered prospectus. To the extent permitted by law, neither Navellier & Associates, Inc., nor any of its affiliates, agents, or service providers are providing any investment advice herein and do not assume any liability or responsibility for the readers’ decisions if any. No reader should act or refrain from acting in reliance on the information contained in this communication or for any decision based on it.
None of the stock information, data, or company information presented herein constitutes investment advice or a recommendation by Navellier or a solicitation to buy or sell any securities. Any specific securities identified and described herein do not represent any investment advice.
Information presented is general information that does not take into account your individual circumstances, financial situation, or needs, nor does it present a personalized recommendation to you. Individual stocks presented may not be suitable for every investor. Investment in securities involves significant risk and has the potential for partial or complete loss of funds invested. Investment in fixed income securities has the potential for the investment return and principal value of an investment to fluctuate so that an investor’s holdings, when redeemed, may be worth less than their original cost.
- This report contains statements that are, or may be considered to be, forward-looking statements. All statements that are not historical facts, including statements about our beliefs or expectations, are “forward-looking statements” within the meaning of The U.S. Private Securities Litigation Reform Act of 1995. These statements may be identified by such forward-looking terminology as “expect,” “estimate,” “plan,” “intend,” “believe,” “anticipate,” “may,” “will,” “should,” “could,” “continue,” “project,” or similar statements or variations of such terms. Our forward-looking statements are based on a series of expectations, assumptions, and projections, are not investment advice. All of our forward-looking statements are as of the date of this report only.
- Federal Tax Advice Disclaimer: As required by U.S. Treasury Regulations, you are informed that, to the extent this presentation mentions any federal taxes, Navellier is not presenting any tax advice and should not be used or relied on as tax advice. Navellier does not advise on any income tax requirements or issues. Use of any information presented by Navellier is for general information only and does not represent tax advice either express or implied. You are encouraged to seek professional tax advice for income tax questions and assistance.
- FactSet Disclosure: Navellier does not independently calculate the statistical information included in the attached report. The calculation and the information are provided by FactSet, a company not related to Navellier. Although information contained in the report has been obtained from FactSet and is based on sources Navellier believes to be reliable, Navellier does not guarantee its accuracy, and it may be inaccurate, incomplete or condensed. The report and the related FactSet sourced information is for general information purposes only.