
by Gary Alexander
October 20, 2026
The best news I could cover today would be the 40th anniversary of the most dramatic tax cut bill in American history, signed into law on October 22, 1986. (See the 1987 book “Showdown at Gucci Gulch” for that story), but most investors will mark the 39th anniversary of the 1987 market crash, not a tax cut.
The Dow fell 22% in one day (a record by far), but the scariest moment came the next morning – a Tuesday, just like today, 39-years ago – so let’s start this amazing story of investing lemmings jumping off the cliff on Monday, by watching the last lemming leap came at about 10am, 39-years ago today.
On Tuesday morning, October 20, 1987, nobody was buying stocks in the opening hour. Despite the previous day’s record drop, there was no buying in the morning. The Dow fell another 100-points in early trading, but by the end of Tuesday, it was up over 100-points (+5.9%), the first-ever 100-point daily gain.
The next day, that record was shattered with a +187 day (+10.1%), the first 10% daily rise since 1933.
The Two Largest Daily Dow Point Increases in the Dow’s First Century (1896-1996)

Tuesday (October 20, 1987) also set a new volume record, for the third straight day, at 608,120,000 shares. Much of the volume came from negative panic selling in the morning hours. But at some magic mid-morning moment, traders looked at each other and said, “Enough of this,” and a buying panic began.
The suffering wasn’t over, however. On that same day, up in Canada, the Toronto gold stock market fell 22% on October 20, 1987, matching the -22% New York massacre on Bloody Monday, giving Canada a Bloody Tuesday. Nobody expected gold to fall that badly, but margin traders had to sell their winners.
On that same Tuesday, America was in the middle of a World Series between Minnesota and St. Louis. For that night’s game, the broker Merrill Lynch pulled their regular “bullish on America” ad (it would not be credible), replacing it with a sober message saying Merrill was “still bullish on America.” That turned out to be an eloquent tribute to that firm’s bullish founder, Charles Merrill, born on October 19, 1885.
In the last 10-trading days of October, the Dow rose 245-points (+15%), and 21 months later, on July 26, 1989, the S&P 500, NASDAQ and Dow Industrials each set new all-time highs. More importantly, they kept soaring in the 1990s, the strongest decade in market history. Now, 39-years later, the Dow and S&P 500 are up 30-fold (and NASDAQ is 80% higher) from Black Monday’s close, a stunning wealth explosion.
So, here’s how the 1987 crash looks (virtually invisible) in a long-term chart of 90-years of S&P growth:
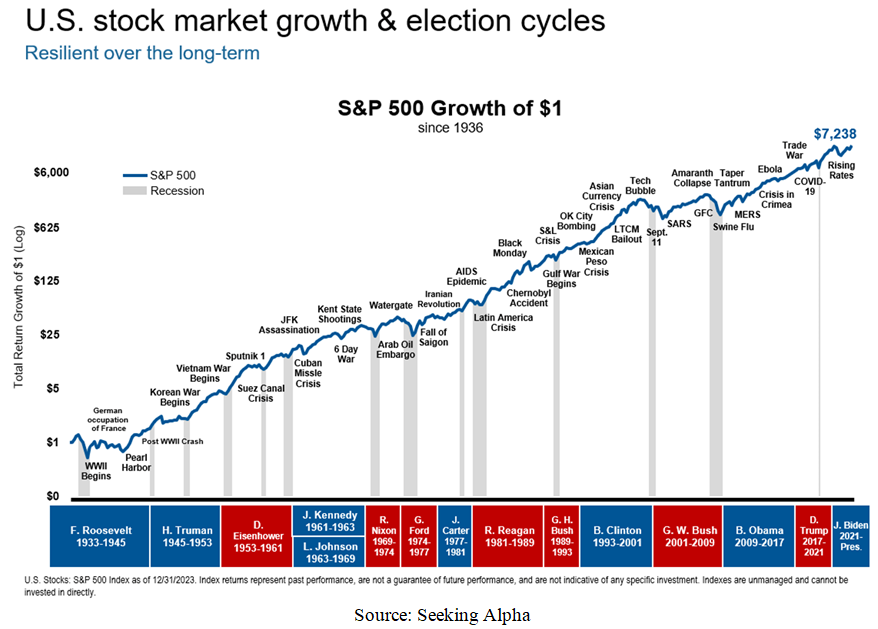
Graphs are for illustrative and discussion purposes only. Please read important disclosures at the end of this commentary.
What caused the 1987 crash? Theories abound, and there were plenty of short-term triggers, cited below, but the real reason is that stocks had risen too far, too fast, partly in response to the most dramatic tax cut ever passed in American history, signed into law a year earlier, October 22, 1986. The Dow basically rose 50% in 10-months, from 1,767 in October 1986 to 2,722 in August of 1987, then it fell back to 1,738 before closing the year strongly, delivering a net +5.25% gain the S&P 500 in 1987 (including dividends).
Tax cuts can supercharge GDP and capital growth, as companies and workers will labor harder and longer when they don’t fear a big tax drain. (To get more eggs, quit plucking the hens and breaking her eggs).
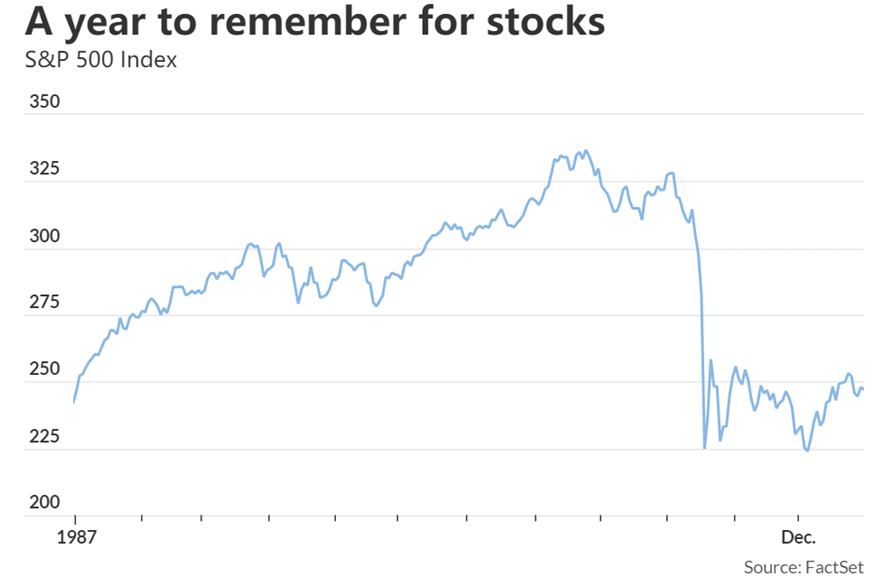
Graphs are for illustrative and discussion purposes only. Please read important disclosures at the end of this commentary.
Anatomy of the Meaningless (Crash of 1987)
After the crash, I made a deep dive into the crash of 1987, like Andrew Ross Sorkin did with the 1929 and 2008 crashes, and I found some fascinating stories – although the tax cut rally is the main untold story.
Here’s a summary of the proximate causes of the 1987 crash, in a day-by-day account I wrote then:
- October 14, 1987 (a Wednesday) marked the opening shot of the Crash. The Dow Jones index fell by a then-record 95.46-points (-3.8%), from 2508.16 to 2412.70. The Dow would set two much larger all-time drops the following Friday and Black Monday, but this was the start.
The Nightly Business Report of October 14 gave this long litany of causes of the first big drop (I don’t subscribe to these as causes. I only list them to show how short-term most reporting is):
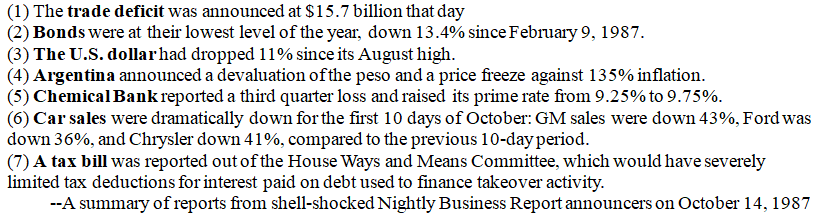
- On Thursday, October 15, the Dow fell by another 2.4%, but that was the smallest decline in four-straight trading sessions, delivering a total 30.7% decline, from 2,508 to 1738 on the Dow.
- Friday, October 16, 1987, opened on a positive note, with the Dow up nine points. By 1:00 pm, however, the Dow was down 31. By 2:00, it dropped another 54-points, then recovered 29-points from 2:00 to 3:00, but in the last half hour, the Dow dropped 50-more points, to close down a record 108.35 points (-4%), from 2355 to 2246, on record volume of 338,500,000 shares.
In Friday’s nightly news reports, NBR host Paul Kangas expressed the majority view, saying, “Prices cascaded down due to heavy program trading and portfolio insurance selling.” Neil Cavuto blamed Salomon Brothers’ decision to lay off 800, but most awaited reassurance from Wall Street Week host Louis Rukeyser, who dramatized the week’s losses like suspects in a crime thriller, ranging from “scary lay-offs at two major firms, to growing evidence that the mindless computer-driven program trading of institutions can turn worry into panic, and prudent selling into wholesale desertion.” But then, his guest panelist Marty Zweig said, “I haven’t been looking for a bear market, per se. I have been really in my own mind looking for a crash, but I didn’t want to talk about it publicly because it’s like shouting fire in a crowded theater; there are other ways to play it… just tilt your strategy negatively and shut your mouth.”
On that same Friday, October 16, 1987, a storm hit London, the worst storm in 300-years. TV reports said, “The storm took everyone by surprise, rolling into the British capital from the English Channel and plunging the City of London into darkness and chaos just before dawn.” The storm was so bad the Bank of England declared a bank holiday. This was an eerie repeat of Black Thursday, October 24, 1929, when a storm also hit London while Winston Churchill was touring the New York Stock Exchange, mid-crash.
- Over the weekend, political figures poured gasoline on Wall Street’s fire. On Saturday, October 17, 1987, U.S. Treasury Secretary James Baker III told the Germans to “either inflate your mark, or we’ll devalue the dollar.” Later, an unnamed Treasury official said America would “drive the dollar down” if necessary. Then, on Sunday, October 18, Baker went on the Sunday morning talk shows, where he said the U.S. “would not accept” the recent German interest rate increase.
Jacques Delors, president of the European Commission, compared Baker’s remarks to “a pyro-maniac fireman. When you’re living on the edge of the volcano, you don’t light matches.” Economist Pierre Rinfret also blamed Baker: “I think we have a Secretary of the Treasury that started one of the worst panics in the history of the stock market. I think he is a fool. I think he should resign immediately or be fired.” After cooling down, Rinfret added that Baker seemed to be fomenting economic warfare by “threatening to bomb his own currency.” Trader Jim Rogers, after seeing Baker on TV, said, “I went in on Monday, ready to short the market, but there were no buyers. The crash had nothing to do with program trading or arbitrage or investment insurance. Greenspan and Baker simply panicked and blew it.”
So, the proximate cause of Black Monday was two political appointees acting rashly. First, the rookie chairman of the Federal Reserve, Alan Greenspan, made his first order of business to raise the Discount Rate in early September. Then, Secretary of the Treasury James Baker talked tough to the Germans about their mark. As in 1929, we must look to government for the cause of the crash. Between Baker’s currency wars, Greenspan’s tight money and a new Congressional tax bill, which punished capital gains, and more threats of protectionist legislation, the problem was too much, not too little, federal government.
- On Monday, October 19, 1987, “Black Monday,” the market surrendered a then-record 508-points (a still-record 22.6%), on record volume (604,330,000 shares), almost twice the previous daily record, set the previous Friday. The market day began in Asia, where Monday opened with a 33% drop in Singapore, a 17% loss in Tokyo and 11% down in Hong Kong – which closed for the rest of the week. Europe fared no better, with a 22% drop in London, 14% in Zurich and 13% in Frankfurt. Hearing this news over their breakfast bagels, New York traders were bearish from the start and the market dropped 104 points in the first hour alone. Gold was up $10, to $481.70.
By the middle of the day, the New York market began to consolidate its losses, staying down between 100 and 200 Dow points. But after 2:00 p.m., the market began to lose 100-points every half hour, accelerating from a 376-point drop as of 3:30pm, to a 508-point drop at the closing bell. Most investors couldn’t get through to their brokers to sell. All circuits were busy, so concerned investors kept their eyes glued to FNN, where one ironic ad featured “Professor Gerald Gold” predicting Dow 2987 by year end.
In conclusion, this would be a good time to remind investors late October is a frequent time of Halloween spooks haunting Wall Street, but the following years generally bring superior profits for patient investors:
Some Major 20th Century Market Bottoms in late October (Since 1957) and What Happened Next
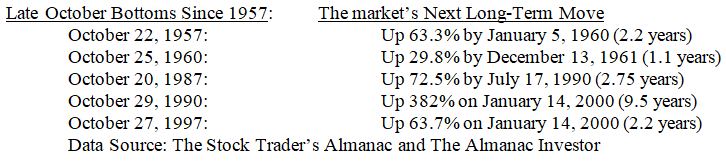
The lesson for long-term investors is to remain patient. Long-term gains will return, with a vengeance….
All content above represents the opinion of Gary Alexander of Navellier & Associates, Inc.
Also In This Issue
A Look Ahead by Louis Navellier
Earnings Highlights from Week #1 of Third-Quarter Results
Income Mail by Bryan Perry
It’s “Show Time” for The AI Trade
Growth Mail by Gary Alexander
Anatomy of a Scary (but Meaningless) Market Collapse 39-Years Ago Today
Global Mail by Ivan Martchev
When Junk Bonds Get Junkier
Sector Spotlight by Jason Bodner
This Market is Frozen, Not Dead
Important Disclosures:
Although information in these reports has been obtained from and is based upon sources that Navellier believes to be reliable, Navellier does not guarantee its accuracy and it may be incomplete or condensed. All opinions and estimates constitute the authors opinions as of the date the report was created and are subject to change without notice. These reports are for informational purposes only and are not a solicitation for the purchase or sale of any securities or financial services. Any decision to purchase securities mentioned in these reports must take into account existing public information on such securities or any registered prospectus. To the extent permitted by law, neither Navellier & Associates, Inc., nor any of its affiliates, agents, or service providers are providing any investment advice herein and do not assume any liability or responsibility for the readers’ decisions if any. No reader should act or refrain from acting in reliance on the information contained in this communication or for any decision based on it.
None of the stock information, data, or company information presented herein constitutes investment advice or a recommendation by Navellier or a solicitation to buy or sell any securities. Any specific securities identified and described herein do not represent any investment advice.
Information presented is general information that does not take into account your individual circumstances, financial situation, or needs, nor does it present a personalized recommendation to you. Individual stocks presented may not be suitable for every investor. Investment in securities involves significant risk and has the potential for partial or complete loss of funds invested. Investment in fixed income securities has the potential for the investment return and principal value of an investment to fluctuate so that an investor’s holdings, when redeemed, may be worth less than their original cost.
- This report contains statements that are, or may be considered to be, forward-looking statements. All statements that are not historical facts, including statements about our beliefs or expectations, are “forward-looking statements” within the meaning of The U.S. Private Securities Litigation Reform Act of 1995. These statements may be identified by such forward-looking terminology as “expect,” “estimate,” “plan,” “intend,” “believe,” “anticipate,” “may,” “will,” “should,” “could,” “continue,” “project,” or similar statements or variations of such terms. Our forward-looking statements are based on a series of expectations, assumptions, and projections, are not investment advice. All of our forward-looking statements are as of the date of this report only.
- Federal Tax Advice Disclaimer: As required by U.S. Treasury Regulations, you are informed that, to the extent this presentation mentions any federal taxes, Navellier is not presenting any tax advice and should not be used or relied on as tax advice. Navellier does not advise on any income tax requirements or issues. Use of any information presented by Navellier is for general information only and does not represent tax advice either express or implied. You are encouraged to seek professional tax advice for income tax questions and assistance.
- FactSet Disclosure: Navellier does not independently calculate the statistical information included in the attached report. The calculation and the information are provided by FactSet, a company not related to Navellier. Although information contained in the report has been obtained from FactSet and is based on sources Navellier believes to be reliable, Navellier does not guarantee its accuracy, and it may be inaccurate, incomplete or condensed. The report and the related FactSet sourced information is for general information purposes only.