
by Ivan Martchev
October 20, 2026
Just as the technology sector bailed out the S&P 500 in September, the technology sector led the market lower last week – after making an all-time high the week before. This could be the overdue September sell-off arriving in October, since we saw crude oil rise 10% to $99 last week, with no indication the Middle East situation is calming down. In hostilities reignite after the election, another oil spike is not a low probability event.
In addition to relentless selling in the technology sector, what stuck out like a sore thumb last week was the notable weakness in forgotten corners of the credit markets. It wasn’t Treasury yields pressuring stocks, as the benchmark 10-year rate dropped rather dramatically to a low of 5.04% Thursday. It was junk bonds.
Weakness in junk bonds tends to correlate with weakness in stocks as it is one of the most economically sensitive parts of the bond market. But the economic numbers have been good, so what gives?
The way bond indexes work, the minute a bond defaults, it gets kicked out of the index. CCC (and lower) rated bonds indicate a much higher probability of default, but they are not a big part of the junk bond market, and the CCC and lower bonds have rising yields – as market participants recognize the risk.
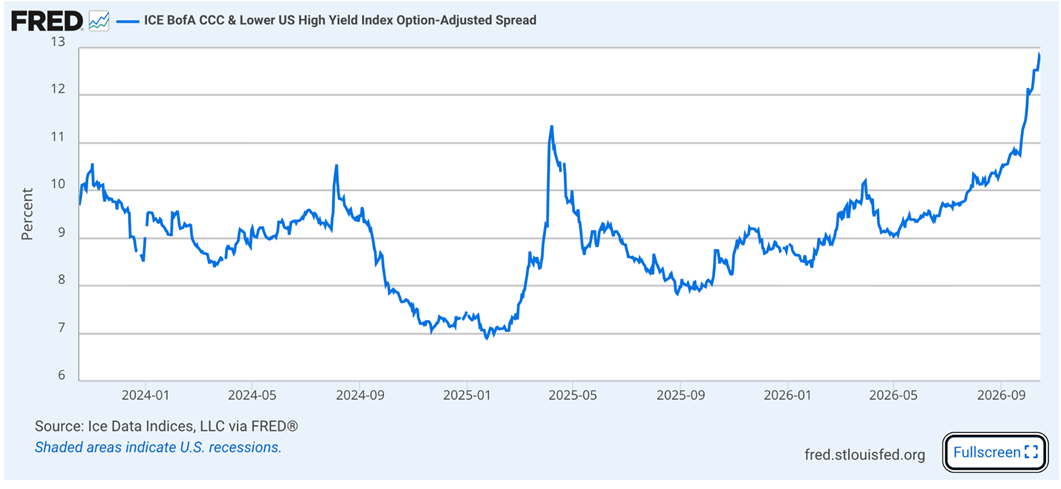
If we take a broad junk bond market index like ICE BofA US High Yield Constrained Index, BB-rated bonds are 58.8% (the best-grade junk), then B-rated bonds are 32.1%, while CCC and lower are only 9.1%. That is the junk bond territory many investors won’t touch. The composite high yield index has a spread to Treasuries of 3.23%, because of the predominance of higher-grade junk bonds. So why are CCC credits hitting 12.78% spread to Treasurys? (charted below) If Treasurys are a tad over 5%, and this is a spread index, many of those bonds have actual yields in the high teens, which is considered distressed.
Graphs are for illustrative and discussion purposes only. Please read important disclosures at the end of this commentary.
As this chart shows, during the worst of the tariff sell-off in 2025, the CCC junk bond market barely hit 11% and then normalized. Furthermore, the last time CCC credits were near a 12.8% spread to Treasuries we were at the bottom of the bear market in October 2022. At that time, the master high yield index (where CCC bonds are only 9.1% of the weighting) had a spread to Treasuries of 5.87%, now it is 3.23%.
Something is going on with the “junkiest” of junk bonds that is not reflected in other junk bonds.
What is the cause? What if it is the upcoming November election? AI and datacenters are issues in many political races and a moratorium on building new data centers has been mentioned by many politicians. If they put a pause on data center construction, though, they could push the U.S. economy into a recession, whether they understand it or not. Overall spending levels on AI are over 5% of the nominal GDP, and that level is higher compared to when they laid fiber in the ground for the Internet boom in 2000.
A Case in Point: CoreWeave
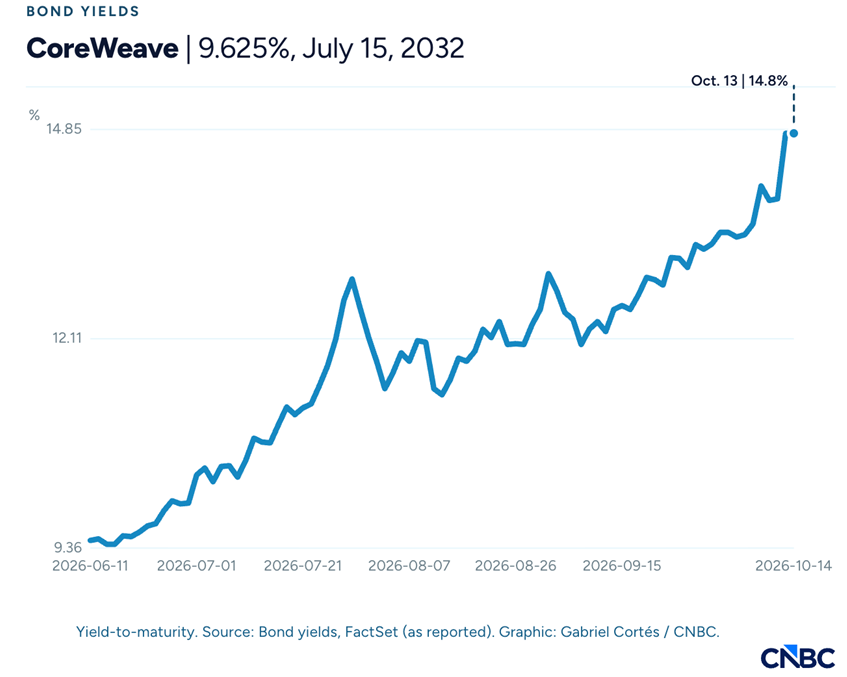
A case in point is CoreWeave (CRWV), a neocloud whose 9.625% bonds due 2032 last week touched 15%. The unsecured credit rating on CoreWeave is B+, so yields pushing 15% are definitely trading at a distressed level. CCC and lower credits have yields even higher than that, but this is not even a CCC credit. Bond investors are worried about CoreWeave, and the approaching election is definitely playing a part in those worries. There are similar issues with other companies’ datacenter bonds (see last week’s Financial Times article, “Investors dump data centre bonds as AI borrowers face ‘Darwin moment’”).
Graphs are for illustrative and discussion purposes only. Please read important disclosures at the end of this commentary.
If there is no pause in data-center buildouts and AI speeding continues unabated in 2027, this is definitely an opportunity. Still, it can get worse before the election – or at least until investors know for sure CoreWeave and many other CCC credits have no economic troubles ahead of them.
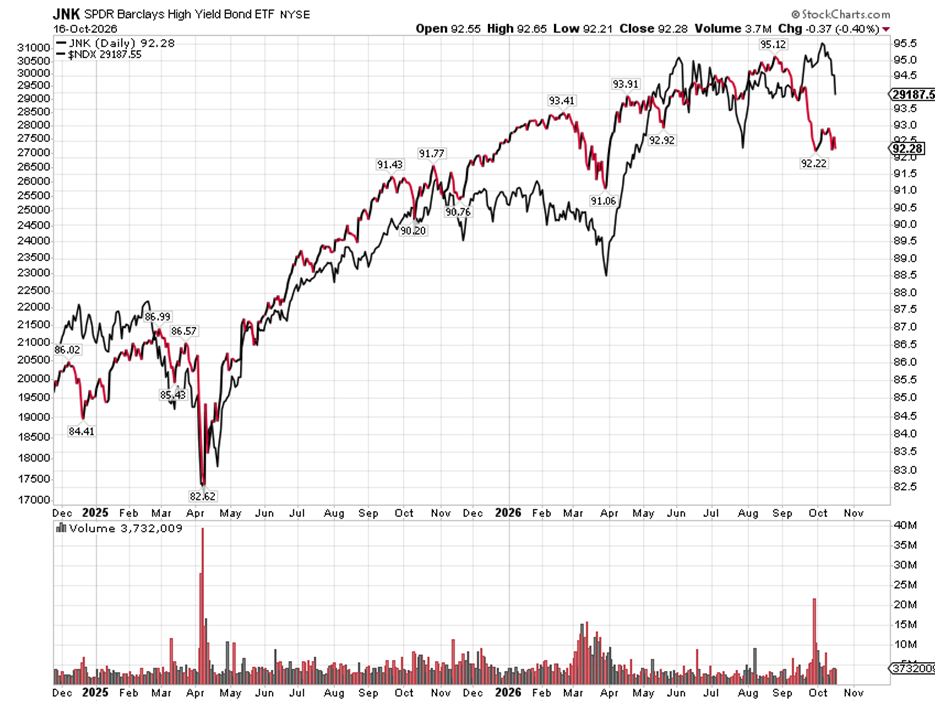
This is where the notorious stock correlation with the junk bond market comes again into play.
Graphs are for illustrative and discussion purposes only. Please read important disclosures at the end of this commentary.
I have shown this chart before, with different stock market indexes. Many retail investors are not aware the total return of junk bonds is heavily correlated to stock prices. In September, the broad market came down hard, as measured by the equal-weight S&P 500, but the market-cap-weight S&P 500 did not follow suit, helped by the technology sector. At that time, most of the decline in junk bond prices was coming from surging Treasury yields and not expanding junk bond spreads. Now, expanding spreads are starting to drive junk bonds, and that is hitting the NASDAQ 100 Index, as charted above.
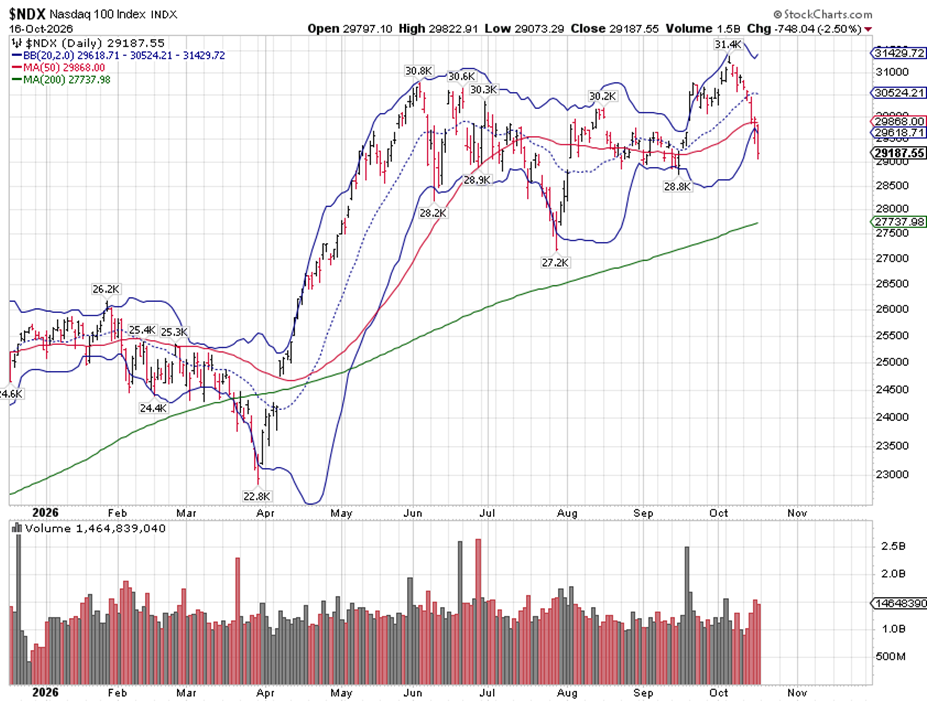
What happened Friday is statistically meaningful. Below is a chart of the NASDAQ 100 Index with Bollinger bands set at two standard deviations (above and below) from a 20-day moving average.
Graphs are for illustrative and discussion purposes only. Please read important disclosures at the end of this commentary.
We have seen a 5 standard deviation move in 2-weeks, from an all-time high (near the upper band) to well below the lower Bollinger band, which is rare. Every time we closed below the lower band, the index either rebounded into the 20-day average or delivered a fierce rally.
And now, big name tech earnings are beginning to get reported this week. If they are good and there is nothing to worry about, like cutting AI spending plans, the index will rebound, because it is short-term oversold and “on support,” as they say in trading lingo.
Before the election, in theory, we can get to the vicinity of the 200-day moving average, near 27,800. For that, we need further trouble in junk bonds, possibly more oil price spikes and a deteriorating geopolitical situation, all of which are possible but have not happened yet, even though they are not low probability.
Graphs are for illustrative and discussion purposes only. Please read important disclosures at the end of this commentary.
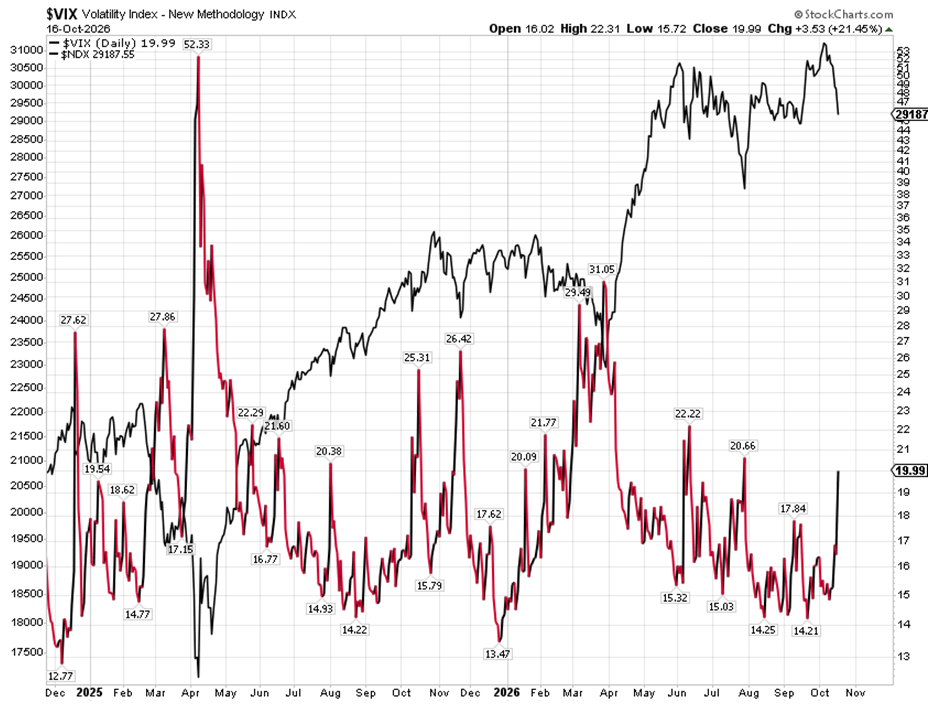
For the time being, I view this as an overdue sell-off before the election, which can get worse depending on the credit market situation and crude oil. The S&P 500 Volatility Index (VIX) rose to 22.3 on Friday and closed a tick below 20. A 22+ reading is near recent highs. When the VIX spikes and has a couple of double-digit percentage declines, it is a pretty good indication of a bottom, as options hedges come off. Still, it is possible the VIX gets to 30 between now and the election, if credit and oil refuse to play ball.
To close on a positive note, to interrupt the above-mentioned negative feedback loop in the markets, all we need is for President Trump to tweet something like this: “We have begun negotiations with Iran.”
Navellier and Associates do not own CoreWeave (CRWV) in managed accounts. Ivan Martchev does not own CoreWeave (CRWV) personally.
All content above represents the opinion of Ivan Martchev of Navellier & Associates, Inc.
Also In This Issue
A Look Ahead by Louis Navellier
Earnings Highlights from Week #1 of Third-Quarter Results
Income Mail by Bryan Perry
It’s “Show Time” for The AI Trade
Growth Mail by Gary Alexander
Anatomy of a Scary (but Meaningless) Market Collapse 39-Years Ago Today
Global Mail by Ivan Martchev
When Junk Bonds Get Junkier
Sector Spotlight by Jason Bodner
This Market is Frozen, Not Dead
Important Disclosures:
Although information in these reports has been obtained from and is based upon sources that Navellier believes to be reliable, Navellier does not guarantee its accuracy and it may be incomplete or condensed. All opinions and estimates constitute the authors opinions as of the date the report was created and are subject to change without notice. These reports are for informational purposes only and are not a solicitation for the purchase or sale of any securities or financial services. Any decision to purchase securities mentioned in these reports must take into account existing public information on such securities or any registered prospectus. To the extent permitted by law, neither Navellier & Associates, Inc., nor any of its affiliates, agents, or service providers are providing any investment advice herein and do not assume any liability or responsibility for the readers’ decisions if any. No reader should act or refrain from acting in reliance on the information contained in this communication or for any decision based on it.
None of the stock information, data, or company information presented herein constitutes investment advice or a recommendation by Navellier or a solicitation to buy or sell any securities. Any specific securities identified and described herein do not represent any investment advice.
Information presented is general information that does not take into account your individual circumstances, financial situation, or needs, nor does it present a personalized recommendation to you. Individual stocks presented may not be suitable for every investor. Investment in securities involves significant risk and has the potential for partial or complete loss of funds invested. Investment in fixed income securities has the potential for the investment return and principal value of an investment to fluctuate so that an investor’s holdings, when redeemed, may be worth less than their original cost.
- This report contains statements that are, or may be considered to be, forward-looking statements. All statements that are not historical facts, including statements about our beliefs or expectations, are “forward-looking statements” within the meaning of The U.S. Private Securities Litigation Reform Act of 1995. These statements may be identified by such forward-looking terminology as “expect,” “estimate,” “plan,” “intend,” “believe,” “anticipate,” “may,” “will,” “should,” “could,” “continue,” “project,” or similar statements or variations of such terms. Our forward-looking statements are based on a series of expectations, assumptions, and projections, are not investment advice. All of our forward-looking statements are as of the date of this report only.
- Federal Tax Advice Disclaimer: As required by U.S. Treasury Regulations, you are informed that, to the extent this presentation mentions any federal taxes, Navellier is not presenting any tax advice and should not be used or relied on as tax advice. Navellier does not advise on any income tax requirements or issues. Use of any information presented by Navellier is for general information only and does not represent tax advice either express or implied. You are encouraged to seek professional tax advice for income tax questions and assistance.
- FactSet Disclosure: Navellier does not independently calculate the statistical information included in the attached report. The calculation and the information are provided by FactSet, a company not related to Navellier. Although information contained in the report has been obtained from FactSet and is based on sources Navellier believes to be reliable, Navellier does not guarantee its accuracy, and it may be inaccurate, incomplete or condensed. The report and the related FactSet sourced information is for general information purposes only.