
by Jason Bodner
September 29, 2026
In the Luzon Strait, between Taiwan and the Philippines, tides push cold, heavy water over two seafloor ridges. That sets off huge waves deep inside the ocean that can grow up to 550 feet tall.
That’s higher than the Washington Monument.
Ships sailing overhead barely notice what’s going on beneath the surface, as these giant waves lift the water by less than an inch, but scientists learned to track them using years of satellite data.
The biggest waves never reach the surface and would escape our notice entirely if it weren’t for “deep research” into the subject. As one MIT researcher explained, with enough data you can filter out the noise.
That’s the stock market right now. The surface looks calm, but underneath, giant waves are rolling.
The Index Is Not the Market
In market terminology, the major indexes, like the S&P 500, are the waves we see, but the sectors and specific stocks surge in waves deep down in the trading “ocean.” The S&P 500 closed Friday at 7,743, less than 1% from its all-time high, and NADAQ set back-to-back records last Monday and Tuesday.
But of the 5,220 stocks we track, a bit over half of them (2,638) are 20% or more below their 52-week highs. If you turn to the tech stock universe, over two-thirds (69%) are down 20% or more off their highs.
There are indexes, and there are the real markets for stocks you own or follow. The index is led by a handful of mega-cap giants, but the market is thousands of stocks, and we follow those most closely.
We can read these underwater trends in the money flow data. Today, this shows us which stories the big institutional players are betting on and where they are moving their money.
Money Is Leaving Anything That Pays a Yield
This week, bond yields surged. The 10-year Treasury hit 5.2%, its highest level since 2007. The 30-year topped 5.5%, last seen in 2004. When the safest of all bonds pay that much, anything that pays a yield has to compete with 5%, so investors sold whatever looked like a bond.
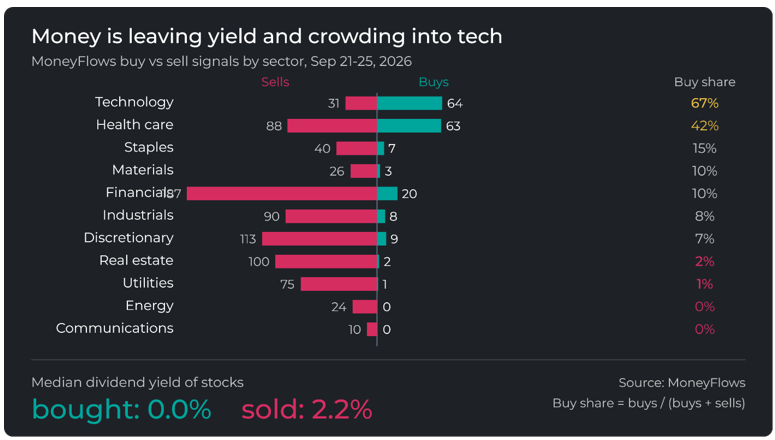
Bond ETFs saw 173 outflows and just 2 inflows. REITs saw 92 outflows and zero inflows. Utilities had 74 outflows and a single inflow. Banks had 73 outflows. Insurers had 46. One stat sums it up: The median stock bought last week paid no dividend. The median stock sold paid 2.2% in dividends.
So where did the money go? Technology was the only sector with more buying than selling last week: 64 inflows vs. 31 outflows. Most of the buying centered on AI chips and software. But dig deeper: Even within the tech sector, we see a split market. “Only” 34% of mega-cap tech stocks are in a bear market whereas for micro-cap tech, it’s 88%. The big money is picking winners, not buying the whole sector.
Health care shows a similar split. Diagnostics and lab tools drew 43 inflows and zero outflows. Drug developers took 68 outflows against just nine inflows. Financials are the strangest story. They have the healthiest breadth of any sector, with only 21% in a bear market, yet they took 187 outflows, more than any other sector. The market’s safest shelter is being sold, which could indicate broadening of outflows.
Hotels, restaurants and leisure stocks had 67 outflows and no inflows. The cost of a gallon of gas near $4.50 (nationwide average) and mortgage rates at 7.37%, those sort of fundamentals fuel these switches.
Energy got zero inflows, even with oil near $100. Big money seems to be betting on Hormuz reopening.
Graphs are for illustrative and discussion purposes only. Please read important disclosures at the end of this commentary.
Headlines Are Loud. Flows Are Clear.
Prediction markets currently give the Democrats a 90% to 96% chance to win the House and 66% odds to win the Senate. Iran offered to reopen Hormuz within a week, but with conditions. The U.S. and China extended their trade truce, but only to January 10. Traders now see a 64% chance the Fed raises rates in October. I would call these “loud” headlines, but the inner market flows tracked the bond market almost day by day. Selling spiked Wednesday and Thursday as yields jumped. It eased Friday when oil fell.
Friday broke a streak of nine straight sessions with 100 or more outflows, tied for the fifth-longest streak since 1990. In 10 prior streaks of eight sessions or more, the S&P 500 fell every time. This time it rose.
The BMI Reflects a Bias Toward Selling
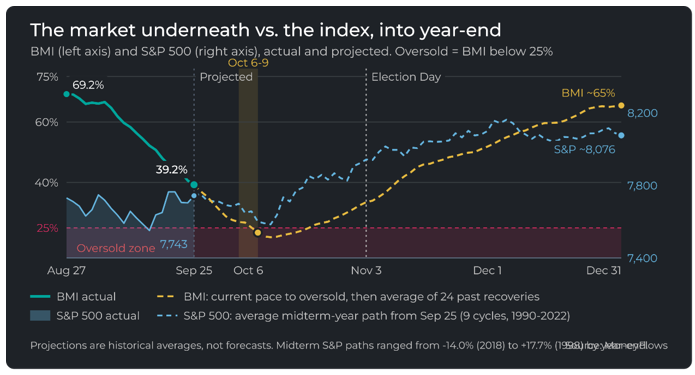
Our Big Money Index (BMI) tracks buying versus selling. Above 80% is overbought. Below 25% is oversold. We haven’t been above 80 or below 25 recently, but the BMI fell precisely 30 points, from 69.2% in late August to 39.2% on Friday. At this pace, it could reach oversold condition on October 9.
Some of that drop is baked into the index parameters. Strong buying days from late August are rolling out of the average. Even if buying and selling balance out this week, the BMI would still slip to about 35%.
There’s no guarantee the BMI will hit 25. If selling eases, it could bottom in the high 20s. In 24 oversold readings since 1990, the S&P 500 was never within 5% of its high. If it happens now, it would be a first.
Graphs are for illustrative and discussion purposes only. Please read important disclosures at the end of this commentary.
Midterm Election Years Point to an October Bottom
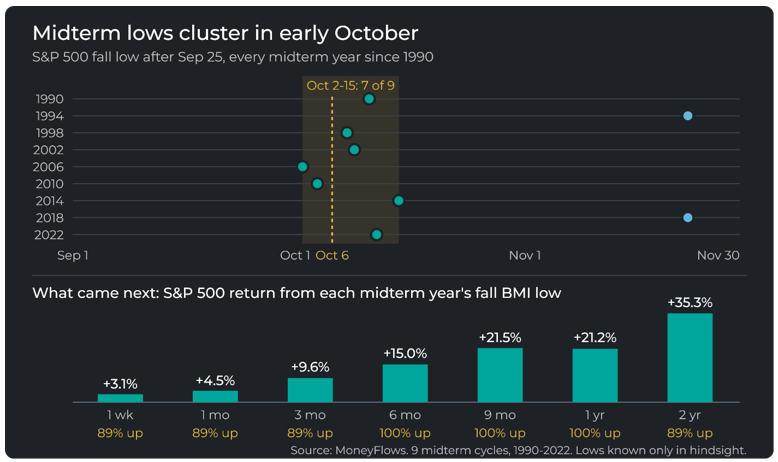
Early October in midterm-years are usually rough. Since 1990, seven of nine midterm market troughs landed between October 2 and October 15. That’s why I one reason I flagged October 6th last week was my projected low for the market underneath the indexes.
What came after was strong. From each midterm year’s BMI low, the S&P 500 averaged a rally of 15% six months later and 21.2% one year later. It rose every time. Four of nine years never reached oversold.
One year did deviate… in late September 2018, the S&P also sat near a record, but Powell’s Fed was hiking rates too far too fast, and a China trade fight was raging, so stocks fell 14% by year-end.
The difference is timing. Back then, the BMI was still 64.9%. The selling hadn’t started yet. Today the BMI is at 39.2%, and half of stocks are in a bear market. These waves have been rolling for weeks.
Graphs are for illustrative and discussion purposes only. Please read important disclosures at the end of this commentary.
Again, the index looks calm, but the market underneath the surface has taken real damage. The data says that damage is closer to its end than its beginning. When the market beneath the surface finishes washing out, history says the index and the market tend to rise together.
Indexes look great, even though your brokerage statement may not. History says: Hang in there.
“Who can make the muddy water clear? Let it be still, and it will gradually become clear.” — Lao Tzu.
All content above represents the opinion of Jason Bodner of Navellier & Associates, Inc.
Also In This Issue
A Look Ahead by Louis Navellier
Prepare For Some “October Surprises”
Income Mail by Bryan Perry
Trump And Iran: “The Illusion of the Deal”
Growth Mail by Gary Alexander
What’s Wrong with Growth? (Not Much)
Global Mail by Ivan Martchev
What Do Parabolic Treasury Yields Tell Us?
Sector Spotlight by Jason Bodner
There Are Indexes, and There Are Markets
View Full Archive
Read Past Issues Here

Jason Bodner
MARKETMAIL EDITOR FOR SECTOR SPOTLIGHT
Jason Bodner writes Sector Spotlight in the weekly Marketmail publication and has authored several white papers for the company. He is also Co-Founder of Macro Analytics for Professionals which produces proprietary equity accumulation and distribution research for its clients. Previously, Mr. Bodner served as Director of European Equity Derivatives for Cantor Fitzgerald Europe in London, then moved to the role of Head of Equity Derivatives North America for the same company in New York. He also served as S.V.P. Equity Derivatives for Jefferies, LLC. He received a B.S. in business administration in 1996, with honors, from Skidmore College as a member of the Periclean Honors Society. All content of “Sector Spotlight” represents the opinion of Jason Bodner
Important Disclosures:
Although information in these reports has been obtained from and is based upon sources that Navellier believes to be reliable, Navellier does not guarantee its accuracy and it may be incomplete or condensed. All opinions and estimates constitute the authors opinions as of the date the report was created and are subject to change without notice. These reports are for informational purposes only and are not a solicitation for the purchase or sale of any securities or financial services. Any decision to purchase securities mentioned in these reports must take into account existing public information on such securities or any registered prospectus. To the extent permitted by law, neither Navellier & Associates, Inc., nor any of its affiliates, agents, or service providers are providing any investment advice herein and do not assume any liability or responsibility for the readers’ decisions if any. No reader should act or refrain from acting in reliance on the information contained in this communication or for any decision based on it.
None of the stock information, data, or company information presented herein constitutes investment advice or a recommendation by Navellier or a solicitation to buy or sell any securities. Any specific securities identified and described herein do not represent any investment advice.
Information presented is general information that does not take into account your individual circumstances, financial situation, or needs, nor does it present a personalized recommendation to you. Individual stocks presented may not be suitable for every investor. Investment in securities involves significant risk and has the potential for partial or complete loss of funds invested. Investment in fixed income securities has the potential for the investment return and principal value of an investment to fluctuate so that an investor’s holdings, when redeemed, may be worth less than their original cost.
- This report contains statements that are, or may be considered to be, forward-looking statements. All statements that are not historical facts, including statements about our beliefs or expectations, are “forward-looking statements” within the meaning of The U.S. Private Securities Litigation Reform Act of 1995. These statements may be identified by such forward-looking terminology as “expect,” “estimate,” “plan,” “intend,” “believe,” “anticipate,” “may,” “will,” “should,” “could,” “continue,” “project,” or similar statements or variations of such terms. Our forward-looking statements are based on a series of expectations, assumptions, and projections, are not investment advice. All of our forward-looking statements are as of the date of this report only.
- Federal Tax Advice Disclaimer: As required by U.S. Treasury Regulations, you are informed that, to the extent this presentation mentions any federal taxes, Navellier is not presenting any tax advice and should not be used or relied on as tax advice. Navellier does not advise on any income tax requirements or issues. Use of any information presented by Navellier is for general information only and does not represent tax advice either express or implied. You are encouraged to seek professional tax advice for income tax questions and assistance.
- FactSet Disclosure: Navellier does not independently calculate the statistical information included in the attached report. The calculation and the information are provided by FactSet, a company not related to Navellier. Although information contained in the report has been obtained from FactSet and is based on sources Navellier believes to be reliable, Navellier does not guarantee its accuracy, and it may be inaccurate, incomplete or condensed. The report and the related FactSet sourced information is for general information purposes only.
- Mapsignals Disclosure: Jason Bodner is a co-founder and co-owner of Mapsignals.com, a Developed Factor Model for isolating outlier stocks using its proprietary quantitative equity selection methodology. Mapsignals was founded in 2014. Data used by Mapsignals, for periods prior to its founding in 2014, is data derived from Factset. Mr. Bodner is an independent contractor who is occasionally hired to write articles and provide his editorial comments and opinions. Mr. Bodner is not employed by Navellier & Associates, Inc., or any other Navellier owned entity. The opinions and statements made in this article are those of Mr. Bodner and not necessarily those of any other persons or entities. Jason Bodner is a co-founder and co-owner of Mapsignals. Mr. Bodner is an independent contractor who is occasionally hired by Navellier & Associates to write an article and or provide opinions for possible use in articles that appear in Navellier & Associates weekly Market Mail. Mr. Bodner is not employed or affiliated with Louis Navellier, Navellier & Associates, Inc., or any other Navellier owned entity. The opinions and statements made here are those of Mr. Bodner and not necessarily those of any other persons or entities. This is not an endorsement, or solicitation or testimonial or investment advice regarding the BMI Index or any statements or recommendations or analysis in the article or the BMI Index or Mapsignals or its products or strategies.