
by Gary Alexander
September 29, 2026
“Growth for the sake of growth is the ideology of the cancer cell.”
–Edward Abbey in his 1968 book Desert Solitaire.
The name of this column is obviously “growth mail,” but I like to cover all angles of growth here – the growth of global wealth, well-being, longevity, technology, communication, understanding and lots more.
These days, “growth” seems to have triggered an army of reactionaries. The word “growth” (like those other six-letter dirty words, like “profit’ or “wealth”) has been spit out in disdain by many Luddites and their legion of followers. “Growth causes pollution they say or, as Edward Abbey wrote, above, “Growth for growth’s sake” is a cancer, a form of toxic masculinity – testosterone running amok. To some critics, “growth” implies cancer spreading out of control until it destroys the whole body – or the whole planet.
Lighten up, Luddites. In personal terms, “growth” implies maturity and perspective, gaining wisdom. In household terms, wise heads of households can grow rich just by spending a lot less than they earn, while socking away most of those savings in a well-selected portfolio of growth stocks to fund their retirement.
What’s wrong with that?
Whether you want to focus on the economy or the ecology, growth comes from greater productivity, from creating cleaner methods to perform the necessary dirty work of mining resources to create a better life.
One clear example is tele-commuting from home offices to avoid the choking traffic to urban cubicles. Another example of clean growth is the miniaturization of the computing power we hold in our hands.
Growth Stocks Have Outpaced Value Stocks for Over a Decade Now
How about Wall Street’s ongoing civil war between growth and value stocks? For decades, mostly in the 1990s and up to the Great Financial Crisis of 2008, I focused on buying value stocks, thinking I was a sharp-eyed bargain hunter, just like buying day-old bread, or discounted meat products or the lowest price-per-unit packaging at the supermarket. Not having much money before the 1990s, I sought bargains.
But a lot of those “value stocks” (too many retail outlets, banks and other financial stocks) were value traps, taking my portfolio into a suicide spin in 2008, so I decided to pay more attention to Louis Navellier’s growth stocks, and that has made all the difference in my portfolio in the last 15 to 20 years.
In that time – since 2005 – growth stocks have run laps over value stocks. This tends to scare a lot of older investors, who like low-priced stocks in principle, but you have to look at the reasons why growth stocks are beating value. If the underlying fundamentals are sound, I wouldn’t abandon a winning plan.
Some want to mix the two strategies with a hybrid strategy, something called growth at a reasonable price (GARP). In the world according to GARP (a great novel, by the way), investors seek a growth stock fallen out of favor to the point of having one of those discounted price tags on it. This strategy has some merit in the current market, with about 69% of tech stocks now trading 20% or more off their peaks.
An ETF dedicated to this strategy has done quite well lately: The iShares MSCI USA Quality GARP ETF (GARP) rose 37.4% in 2024, 21.5% in 2025 and 26% so far this year for a doubling (of total return) in under three years. I’m not necessarily recommending this ETF, but its chart validates its strategy.
Whether you’re talking GARP, growth, or a growth and income hybrid, be sure to look for growth first:
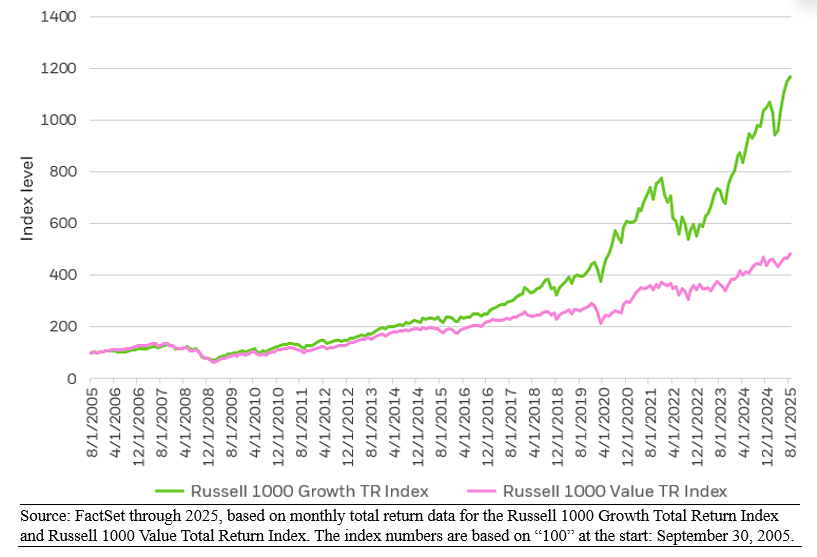
Graphs are for illustrative and discussion purposes only. Please read important disclosures at the end of this commentary.
Now, let’s prepare to turn the calendar page…
Welcome to the Fourth Quarter – When the Real “Action” Begins
In sports, you can be forgiven for sleeping through the first three quarters of a football or basketball game, since the fourth quarter provides the real action, and the dramatic breaks determining the game’s outcome.
So, let us look forward to the big event this week – turning the calendar over, from the end of September (and the third quarter) to October and the spectacular track record of the fourth quarter, especially in midterm election years. In the 16 cycles since I first began studying the economy, in the 1960s, midterm years delivered a significant decline during the third quarter and a rocketing up in the last quarter and next year.
Here’s the overall track record since 1962:
- Every midterm cycle since 1962 saw a market decline between mid-August and Election Day.
- On average, that drop was over 8%, with October marking the low point in 10 out of 16 cycles.
- Then, the market gained an average 12.4% in the 12-months after the midterm elections.
(Source: The Berkshire Edge)
Historic market drops in the late summer in midterm election years circulates around the “what ifs” about the election and the world in general, plus some very misleading, sometimes biased, polls of likely voters.
Election uncertainty does not mean the stock market will fall all through October, only to rise after the election is decided. In most past declines, the market turns around sometime in October, not November, as savvy investors like to make reasonable guesses as to the election’s outcome to beat the crowd to the bid.
If you go back further, to 1900, there have been 31 midterm election years. A study by U.S. Bank found the market returned an anemic average 2.9% in the 12 months before the election. This is a shocking level of underachievement, as the average for all 125 years in the study is an 8.9% cumulative gain. The blame doesn’t entirely fall on the elections. There was the Cuban missile crisis and U.S. Steel war of words in 1962, a deep recession and oil shock in 1974, another deep recession in 1982, Iraq’s invasion of Kuwait in 1990, steep rate increases by the Fed in 1994, the hedge fund crisis of 1998, a tech crash in 2002, etc.
Capital Group, using data since 1950, found an average 12-month return of 15.4% after midterms, about twice as much as all other years, and every one-year period after a midterm election was positive, as the post-midterm election year has been super-strong, with total S&P returns averaging 20% from 1947 to 2023. The median gain was 22.5%, vs. an average of roughly 12.6% for all the years in the same period.
Sure, there have been weak post-midterm years, but they have all risen, even in 1987. Despite the crash that year, the S&P 500 delivered a 5.8% total return in 1987. The 2007 post-midterm was also trying, at the start of a financial crisis, but stocks finished at 5.5% in 2007. There was a credit-rating crisis in 2011, another post-midterm year, but the S&P 500 eked out a 2.1% gain, while Europe went into a recession.
We’ve also seen a ton of bad news since the pandemic of 2020, but the market kept rising. In 2022, inflation topped 9%, the worst in 40 years, and Russia invaded Ukraine. In 2023, Hamas attacked Israel, but the S&P 500 rose 23.8% in 2023 (or 26.3% including dividends). And from the pandemic low of March 23, 2020, through August 21, 2026, the S&P 500 is up 243%, a new sort of “Roaring ‘20s.”
Bear in mind I’m not predicting a 20% market gain in 2027, as market levels are much higher now than a half-century ago, and the Law of Big Numbers makes super-sized market gains harder at these levels, but we can at least make those kinds of gains in wisely selected growth stocks, if not in the overall averages.
All content above represents the opinion of Gary Alexander of Navellier & Associates, Inc.
Also In This Issue
A Look Ahead by Louis Navellier
Prepare For Some “October Surprises”
Income Mail by Bryan Perry
Trump And Iran: “The Illusion of the Deal”
Growth Mail by Gary Alexander
What’s Wrong with Growth? (Not Much)
Global Mail by Ivan Martchev
What Do Parabolic Treasury Yields Tell Us?
Sector Spotlight by Jason Bodner
There Are Indexes, and There Are Markets
View Full Archive
Read Past Issues Here
About The Author

Gary Alexander
SENIOR EDITOR
Gary Alexander has been Senior Writer at Navellier since 2009. He edits Navellier’s weekly Marketmail and writes a weekly Growth Mail column, in which he uses market history to support the case for growth stocks. For the previous 20-years before joining Navellier, he was Senior Executive Editor at InvestorPlace Media (formerly Phillips Publishing), where he worked with several leading investment analysts, including Louis Navellier (since 1997), helping launch Louis Navellier’s Blue Chip Growth and Global Growth newsletters.
Prior to that, Gary edited Wealth Magazine and Gold Newsletter and wrote various investment research reports for Jefferson Financial in New Orleans in the 1980s. He began his financial newsletter career with KCI Communications in 1980, where he served as consulting editor for Personal Finance newsletter while serving as general manager of KCI’s Alexandria House book division. Before that, he covered the economics beat for news magazines. All content of “Growth Mail” represents the opinion of Gary Alexander
Important Disclosures:
Although information in these reports has been obtained from and is based upon sources that Navellier believes to be reliable, Navellier does not guarantee its accuracy and it may be incomplete or condensed. All opinions and estimates constitute the authors opinions as of the date the report was created and are subject to change without notice. These reports are for informational purposes only and are not a solicitation for the purchase or sale of any securities or financial services. Any decision to purchase securities mentioned in these reports must take into account existing public information on such securities or any registered prospectus. To the extent permitted by law, neither Navellier & Associates, Inc., nor any of its affiliates, agents, or service providers are providing any investment advice herein and do not assume any liability or responsibility for the readers’ decisions if any. No reader should act or refrain from acting in reliance on the information contained in this communication or for any decision based on it.
None of the stock information, data, or company information presented herein constitutes investment advice or a recommendation by Navellier or a solicitation to buy or sell any securities. Any specific securities identified and described herein do not represent any investment advice.
Information presented is general information that does not take into account your individual circumstances, financial situation, or needs, nor does it present a personalized recommendation to you. Individual stocks presented may not be suitable for every investor. Investment in securities involves significant risk and has the potential for partial or complete loss of funds invested. Investment in fixed income securities has the potential for the investment return and principal value of an investment to fluctuate so that an investor’s holdings, when redeemed, may be worth less than their original cost.
- This report contains statements that are, or may be considered to be, forward-looking statements. All statements that are not historical facts, including statements about our beliefs or expectations, are “forward-looking statements” within the meaning of The U.S. Private Securities Litigation Reform Act of 1995. These statements may be identified by such forward-looking terminology as “expect,” “estimate,” “plan,” “intend,” “believe,” “anticipate,” “may,” “will,” “should,” “could,” “continue,” “project,” or similar statements or variations of such terms. Our forward-looking statements are based on a series of expectations, assumptions, and projections, are not investment advice. All of our forward-looking statements are as of the date of this report only.
- Federal Tax Advice Disclaimer: As required by U.S. Treasury Regulations, you are informed that, to the extent this presentation mentions any federal taxes, Navellier is not presenting any tax advice and should not be used or relied on as tax advice. Navellier does not advise on any income tax requirements or issues. Use of any information presented by Navellier is for general information only and does not represent tax advice either express or implied. You are encouraged to seek professional tax advice for income tax questions and assistance.
- FactSet Disclosure: Navellier does not independently calculate the statistical information included in the attached report. The calculation and the information are provided by FactSet, a company not related to Navellier. Although information contained in the report has been obtained from FactSet and is based on sources Navellier believes to be reliable, Navellier does not guarantee its accuracy, and it may be inaccurate, incomplete or condensed. The report and the related FactSet sourced information is for general information purposes only.