
by Ivan Martchev
September 29, 2026
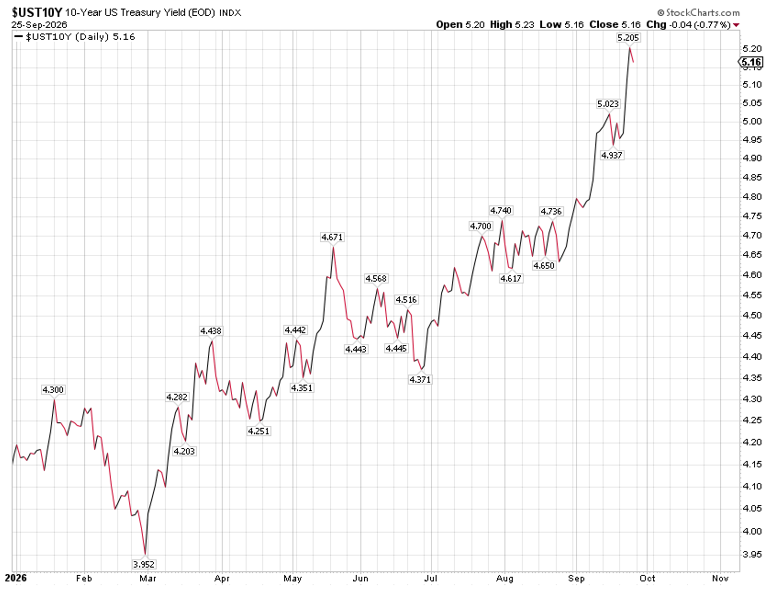
Stock investors keep hoping the Iran situation is coming to a close – and that hope is what caused a new marginal high in the Nasdaq 100 Index on Tuesday last week – but you can safely say bond investors are an entirely different species. You can almost say they come from a different planet. They kept on selling Treasury bond futures, causing yields to reach a multi-year intraday high on the 10-year note of 5.23%.
Stocks are about a return on capital, and bonds are a return of capital, changing the calculus entirely.
Graphs are for illustrative and discussion purposes only. Please read important disclosures at the end of this commentary.
The situation with the Iran war upended global government bond markets, as diesel and other distillates reached all-time highs. An interruption in spot LNG from Qatar caused EU natural gas to reach 10 times the U.S. level. Elevated supply shock inflation and an entrenched deficit are pressuring the U.S. Treasury market, while stock investors are excited about possible 30+% EPS growth for the S&P 500 in 2026.
Graphs are for illustrative and discussion purposes only. Please read important disclosures at the end of this commentary.
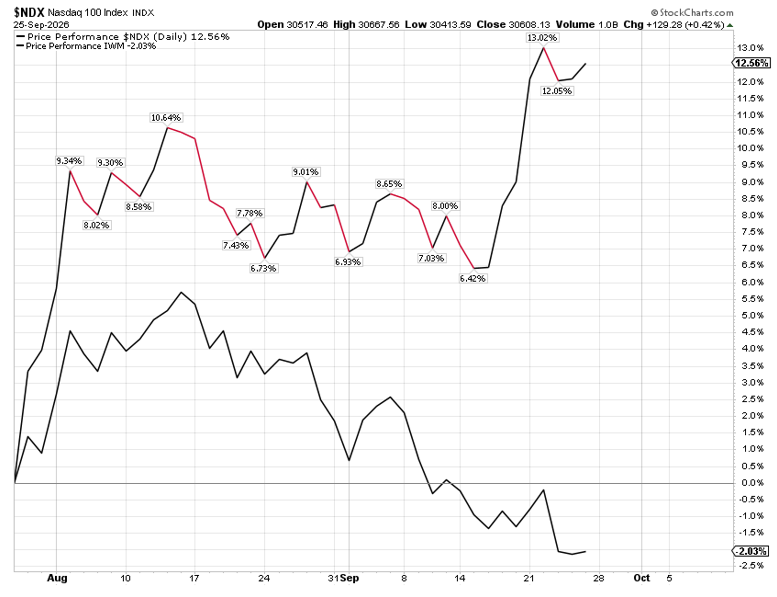
I did not think we could make all-time highs in the Nasdaq 100 with interest rates this high, but when you dig under the surface the situation changes quite a bit. The broad market is under pressure because of surging yields, and if you look at the Russell 2000, a former top performer before yields spiked, the performance differential since July 30 this year between the small cap sector and the Nasdaq 100 has widened to 14.6%. Small caps are down 2.03% while mega-cap tech stocks are up 12.56% in 8 weeks.
I have seen this situation before, where large-cap tech runs up while the broad market is under pressure. It can last for a while, but it doesn’t tend to end well. Further rises in Treasury yields are likely to pressure the tech sector, which will not be able to lift the whole market higher, rather than the other way round.
The main question now is: Could Treasury yields rise further?
Last week, after several substantial stock rally attempts, driven by Iran optimism, The Wall Street Journal poured cold water on those simmering truce hopes (see “Trump Rejects Iran Ceasefire, Expects Renewed Bombing After Midterms”). I realize the Trump administration is negotiating on live TV and all that can change on a dime, but if that headline is accurate, further rises in yields cannot be ruled out.
Furthermore, the yield spike has picked up speed, as indicated in my first chart, above.
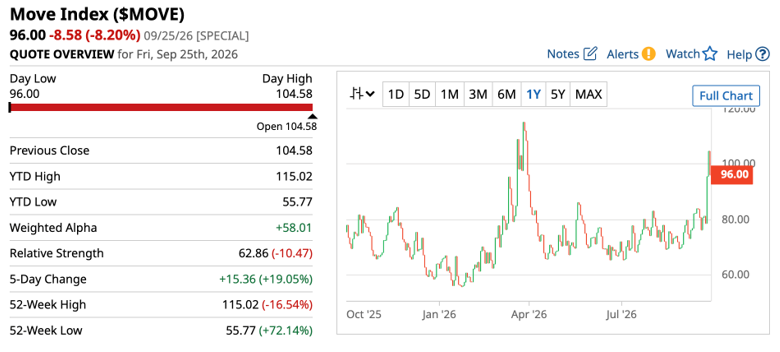
Also, the MOVE Index (below), a measure of volatility for Treasuries, traded all the way to 105, which is not far away from its 2026 high of 115 (below). That tells me Treasury yields are extended to the upside and they can mean-revert violently lower if we get good news that sticks, like a real truce, but under bad war news scenarios, they may rise further – and that mean reversion can come for higher levels.
Graphs are for illustrative and discussion purposes only. Please read important disclosures at the end of this commentary.
The MOVE Index can roughly be called “the VIX for bonds,” as it measures fixed income volatility. The 14.87 VIX close from Friday indicates a roughly 15% annualized expected S&P 500 volatility, which would be acting fairly “calm”, but a MOVE index near 100 expects a roughly 100 basis point expected annualized Treasury yield volatility, indicating the Treasury market being “not so calm.”
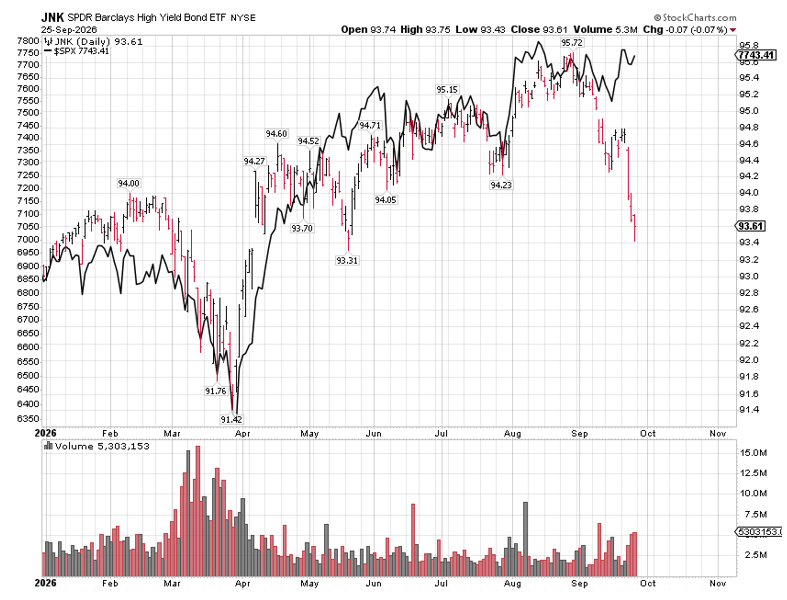
Rising troubles in the Treasury market tend to mean rising troubles in the stock market, although right now this is happening with a notable delay. The situation in the Treasury market is beginning to spill into junk bonds. Although their spread to Treasuries is approaching its lowest point over the past two years, they are widening somewhat. Many retail investors do not know there is strong correlation between the total return of junk bonds and the S&P 500 (pictured below), which now suggests a leg lower for equities.
Graphs are for illustrative and discussion purposes only. Please read important disclosures at the end of this commentary.
A veteran of the bond market told me many years that non-investment grade credit “reads like a bond but trades like a stock,” indicating bigger volatility than regular investment-grade debt. Now, we not only see investment grade debt volatility picking up as evident by the MOVE index, but also junk bond volatility.
Furthermore, in many cases junk bonds tend to lead the stock market. They tend to weaken before it tops out, and then they tend to lead to the upside when the stock market has bottomed out is about to bottom. The only reason why the S&P has not adhered to its strong correlation to junk bonds is the tech sector, which is huge but not immune to the selling pressure in the bond market.
September ends this week, and that increases the probability investors will buy into any semblance of positive news, as the fourth quarter is usually strong. Be that as it may, we still need to monitor the Iran situation, which has very big consequences for financial markets. Sharp deterioration on war news flow, particularly after September 30, will likely produce a bigger correction before the November election.
A move to 7,200 or so on the S&P 500 remains a clear possibility in any negative war scenario before the election. After the election, if the Iran negotiations resume, 8,500 is a good target for the end of 2026.
All content above represents the opinion of Ivan Martchev of Navellier & Associates, Inc.
Also In This Issue
A Look Ahead by Louis Navellier
Prepare For Some “October Surprises”
Income Mail by Bryan Perry
Trump And Iran: “The Illusion of the Deal”
Growth Mail by Gary Alexander
What’s Wrong with Growth? (Not Much)
Global Mail by Ivan Martchev
What Do Parabolic Treasury Yields Tell Us?
Sector Spotlight by Jason Bodner
There Are Indexes, and There Are Markets
View Full Archive
Read Past Issues Here

Ivan Martchev
INVESTMENT STRATEGIST
Ivan Martchev is an investment strategist with Navellier. Previously, Ivan served as editorial director at InvestorPlace Media. Ivan was editor of Louis Rukeyser’s Mutual Funds and associate editor of Personal Finance. Ivan is also co-author of The Silk Road to Riches (Financial Times Press). The book provided analysis of geopolitical issues and investment strategy in natural resources and emerging markets with an emphasis on Asia. The book also correctly predicted the collapse in the U.S. real estate market, the rise of precious metals, and the resulting increased investor interest in emerging markets. Ivan’s commentaries have been published by MSNBC, The Motley Fool, MarketWatch, and others. All content of “Global Mail” represents the opinion of Ivan Martchev
Important Disclosures:
Although information in these reports has been obtained from and is based upon sources that Navellier believes to be reliable, Navellier does not guarantee its accuracy and it may be incomplete or condensed. All opinions and estimates constitute the authors opinions as of the date the report was created and are subject to change without notice. These reports are for informational purposes only and are not a solicitation for the purchase or sale of any securities or financial services. Any decision to purchase securities mentioned in these reports must take into account existing public information on such securities or any registered prospectus. To the extent permitted by law, neither Navellier & Associates, Inc., nor any of its affiliates, agents, or service providers are providing any investment advice herein and do not assume any liability or responsibility for the readers’ decisions if any. No reader should act or refrain from acting in reliance on the information contained in this communication or for any decision based on it.
None of the stock information, data, or company information presented herein constitutes investment advice or a recommendation by Navellier or a solicitation to buy or sell any securities. Any specific securities identified and described herein do not represent any investment advice.
Information presented is general information that does not take into account your individual circumstances, financial situation, or needs, nor does it present a personalized recommendation to you. Individual stocks presented may not be suitable for every investor. Investment in securities involves significant risk and has the potential for partial or complete loss of funds invested. Investment in fixed income securities has the potential for the investment return and principal value of an investment to fluctuate so that an investor’s holdings, when redeemed, may be worth less than their original cost.
- This report contains statements that are, or may be considered to be, forward-looking statements. All statements that are not historical facts, including statements about our beliefs or expectations, are “forward-looking statements” within the meaning of The U.S. Private Securities Litigation Reform Act of 1995. These statements may be identified by such forward-looking terminology as “expect,” “estimate,” “plan,” “intend,” “believe,” “anticipate,” “may,” “will,” “should,” “could,” “continue,” “project,” or similar statements or variations of such terms. Our forward-looking statements are based on a series of expectations, assumptions, and projections, are not investment advice. All of our forward-looking statements are as of the date of this report only.
- Federal Tax Advice Disclaimer: As required by U.S. Treasury Regulations, you are informed that, to the extent this presentation mentions any federal taxes, Navellier is not presenting any tax advice and should not be used or relied on as tax advice. Navellier does not advise on any income tax requirements or issues. Use of any information presented by Navellier is for general information only and does not represent tax advice either express or implied. You are encouraged to seek professional tax advice for income tax questions and assistance.
- FactSet Disclosure: Navellier does not independently calculate the statistical information included in the attached report. The calculation and the information are provided by FactSet, a company not related to Navellier. Although information contained in the report has been obtained from FactSet and is based on sources Navellier believes to be reliable, Navellier does not guarantee its accuracy, and it may be inaccurate, incomplete or condensed. The report and the related FactSet sourced information is for general information purposes only.