
by Ivan Martchev
July 21, 2026
It looks like the Iranian situation is going from bad to worse.
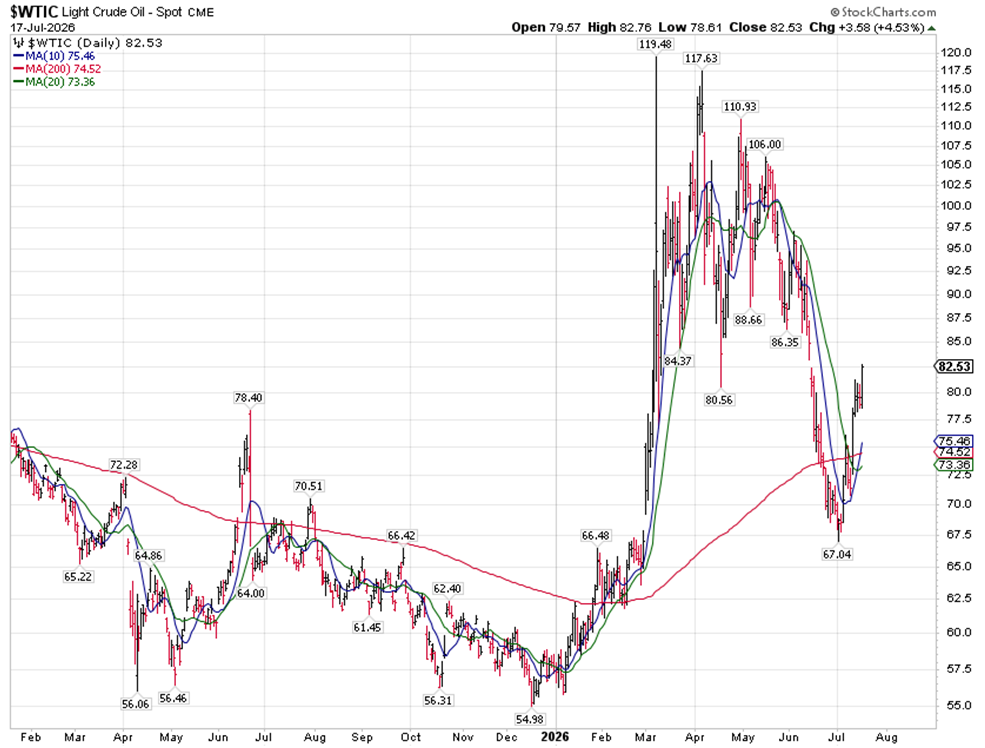
As of the time of this writing (Sunday), military strikes are intensifying on all sides. The more this escalates, the higher oil prices will go and the more damage Iran does to any U.S. allies in the Persian Gulf.
“You hit my infrastructure and I’ll hit yours” is not a good deal for either side, because infrastructure by definition is not easy to put back online – be it oil, LNG, power plants or water desalination facilities.
Military situations are always hard to forecast. In a best-case situation, negotiations can restart at any time, putting worries on hold. In such a case, we could see new market highs, as the stock market has gone sideways and rotated away from technology in what is expected to be a very good earnings season.
Graphs are for illustrative and discussion purposes only. Please read important disclosures at the end of this commentary.
If the firing of missiles continues to intensify over the next two-weeks and the flow of oil is reduced for that long, oil reaching $100 again is likely. Keep in mind the world is operating on lower inventories compared to the start of the conflict, so disruptions this time may be more pronounced than last March.
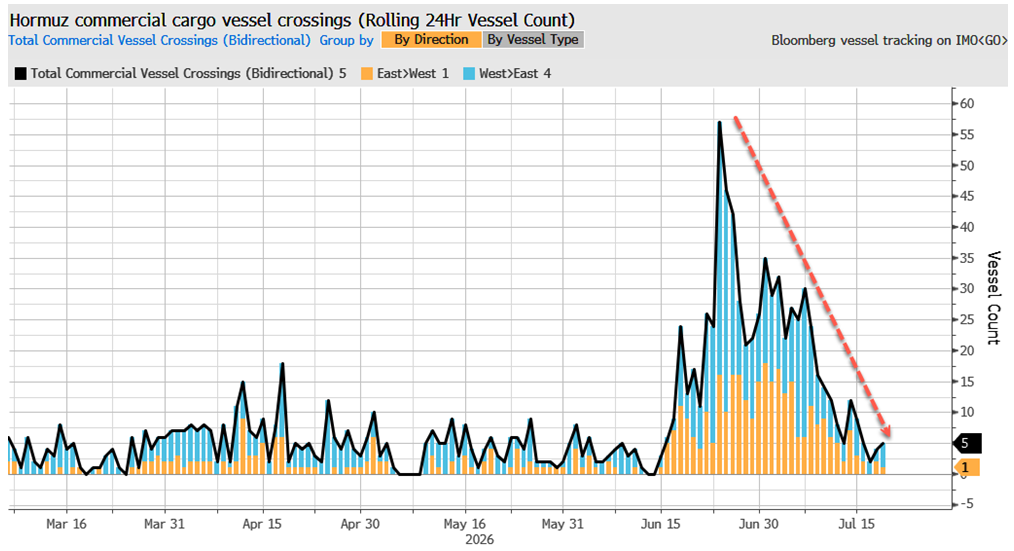
The more the Iran conflict intensifies, the worse the scenario gets. The official crossings of the Strait of Hormuz have declined to a level not seen since the most acute stages of the war (see chart below).
Graphs are for illustrative and discussion purposes only. Please read important disclosures at the end of this commentary.
I cannot be sure which way the war may be going by August 1st, but right now it does not look good.
A New Market Barometer is the Price of SpaceX Stock
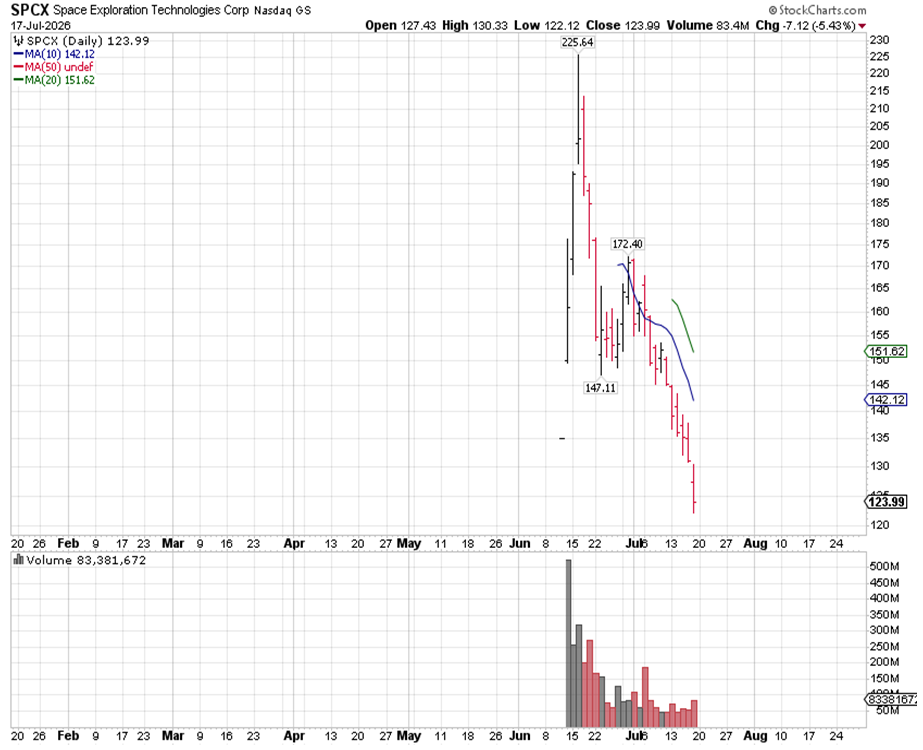
A good sentiment indicator for the stock market is the price of SpaceX, which broke below its IPO price of $135 last week. Some of its rocket engines did not start during a high-profile launch – which had to be scrubbed. I suppose this is better than the rocket blowing up, which has happened to SpaceX many times.
Graphs are for illustrative and discussion purposes only. Please read important disclosures at the end of this commentary.
After a successful launch, SpaceX should rebound. It’s possible about a third of the tiny float has been sold short, which opens possibility of a short squeeze, as only 4.3% of the shares are available for trading. The fact so many shares are short may be just a function of the level of options trading and hedging in the stock, not necessarily huge investor bearishness, although the shares were clearly overpriced at the IPO.
Elon Musk was a master manager of the Tesla share price for many years before it entered the S&P 500. I think he will try to do the same on a much larger scale with SpaceX. That means big deals announced at a time when share lockups begin to expire next month. There will likely be a fierce rebound if he delivers on any of his big deal headlines, but if he waits until the earnings release on August 6 and messes up another rocket launch, that rebound is likely to start from much lower levels – likely closer to $100.
Graphs are for illustrative and discussion purposes only. Please read important disclosures at the end of this commentary.
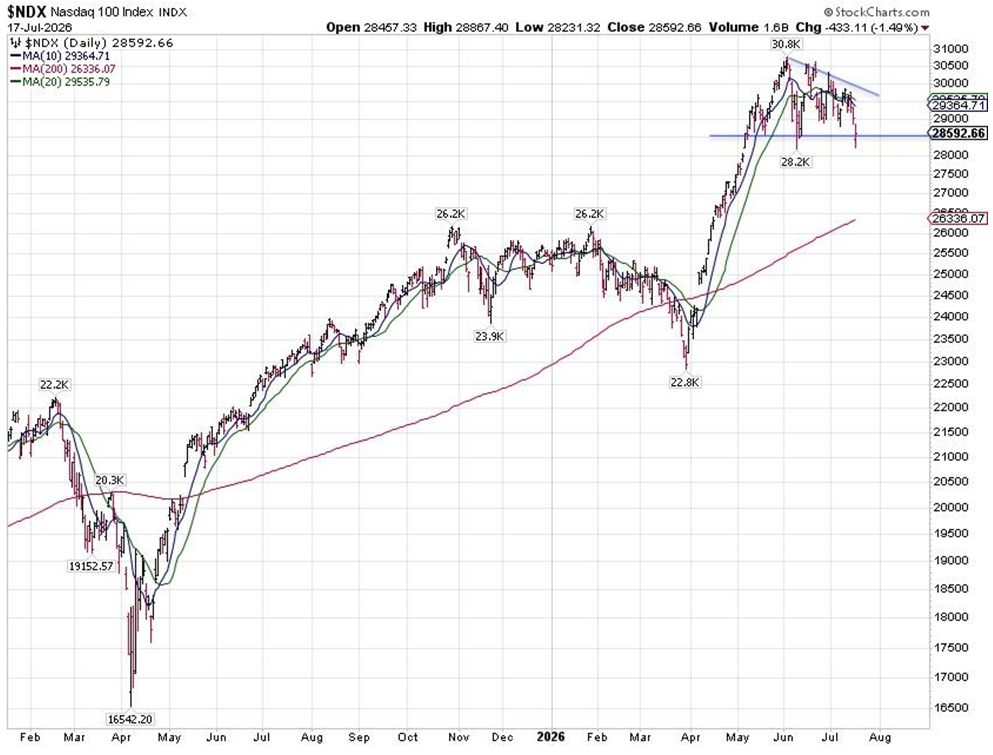
If the price of oil surpasses $100, the 200-day moving average on the NDX (NASDAQ 100) comes into play. I do not believe it is feasible for this situation to continue for months. President Trump said we have no more than four weeks in oil inventories the first time hostilities died down. Provided Iran was paying attention, they may have figured out they have 3-4 weeks of bombardment before the U.S. has to stop.
Are the Iranian Leaders Reading the Writings of Sun-Tzu?
It looks to me like the Iranians are taking a page out of Sun Tzu’s “Art of War,” on leveraging power:
“The art of using troops is this: When ten to the enemy’s one, surround him;
When five times his strength, attack him (if my force is five times that of the enemy I alarm him to the front, surprise him to the rear, create an uproar in the east and strike in the west);
If double his strength, divide him (if a two-to-one superiority is insufficient to manipulate the situation, we use a distracting force to divide his army);
If equally matched, you may engage him (in these circumstances only the able general can win);
If weaker numerically, be capable of withdrawing (if I am in good order and the enemy in disarray, if I am energetic and he careless, then, even if he be numerically stronger, I can give battle);
And if in all respects unequal, be capable of eluding him, for a small force is but booty for one more powerful (the small certainly cannot equal the large, nor can the weak match the strong, nor the few the many).”
Iranians know they are outgunned and outmanned, so they basically are using America’s regional allies as firing targets – and the rising price of oil as a weapon. In effect, a smaller force is doing more damage than what most would have predicted at the onset of the war. If there is a good example of Sun Tzu’s analysis of asymmetric warfare in the last 50-years, this has to be it.
To recap, if negotiations resume, the stock market likely delivers a fierce rebound. The longer the fighting goes on, the higher oil prices rise, given the stoppage of flow in the Strait of Hormuz and low global oil inventories. Whatever happens, The Trump administration likely has no more than 3 to 4-weeks to figure out a way out of this mess, as past that point there may be long-term damage to oil and civilian infrastructure in the region. That would be hard to reverse, with longer-term implications that the world hopes to avoid.
Navellier & Associates; do not own Space Exploration Technology Corp (SPCX) in managed accounts. A few accounts own Tesla (TSLA) per client request. Ivan Marchev does not own Space Exploration Technology Corp (SPCX) or Tesla (TSLA) personally.
All content above represents the opinion of Ivan Martchev of Navellier & Associates, Inc.
Also In This Issue
A Look Ahead by Louis Navellier
Lower Inflation Should Postpone Fears of Rising Interest Rates
Income Mail by Bryan Perry
The Great Rotation into AI-Proof Healthcare
Growth Mail by Gary Alexander
Is it Possible for a Nation to Be Recession-Proof – for 50 Years?
Global Mail by Ivan Martchev
The Stock Market is Not Ready for $100 Oil
Sector Spotlight by Jason Bodner
What “Fractal Motion” in Markets Looks Like
View Full Archive
Read Past Issues Here

Ivan Martchev
INVESTMENT STRATEGIST
Ivan Martchev is an investment strategist with Navellier. Previously, Ivan served as editorial director at InvestorPlace Media. Ivan was editor of Louis Rukeyser’s Mutual Funds and associate editor of Personal Finance. Ivan is also co-author of The Silk Road to Riches (Financial Times Press). The book provided analysis of geopolitical issues and investment strategy in natural resources and emerging markets with an emphasis on Asia. The book also correctly predicted the collapse in the U.S. real estate market, the rise of precious metals, and the resulting increased investor interest in emerging markets. Ivan’s commentaries have been published by MSNBC, The Motley Fool, MarketWatch, and others. All content of “Global Mail” represents the opinion of Ivan Martchev
Important Disclosures:
Although information in these reports has been obtained from and is based upon sources that Navellier believes to be reliable, Navellier does not guarantee its accuracy and it may be incomplete or condensed. All opinions and estimates constitute Navellier’s judgment as of the date the report was created and are subject to change without notice. These reports are for informational purposes only and are not a solicitation for the purchase or sale of a security. Any decision to purchase securities mentioned in these reports must take into account existing public information on such securities or any registered prospectus.To the extent permitted by law, neither Navellier & Associates, Inc., nor any of its affiliates, agents, or service providers assumes any liability or responsibility nor owes any duty of care for any consequences of any person acting or refraining to act in reliance on the information contained in this communication or for any decision based on it.
Past performance is no indication of future results. Investment in securities involves significant risk and has the potential for partial or complete loss of funds invested. It should not be assumed that any securities recommendations made by Navellier. in the future will be profitable or equal the performance of securities made in this report. Dividend payments are not guaranteed. The amount of a dividend payment, if any, can vary over time and issuers may reduce dividends paid on securities in the event of a recession or adverse event affecting a specific industry or issuer.
None of the stock information, data, and company information presented herein constitutes a recommendation by Navellier or a solicitation to buy or sell any securities. Any specific securities identified and described do not represent all of the securities purchased, sold, or recommended for advisory clients. The holdings identified do not represent all of the securities purchased, sold, or recommended for advisory clients and the reader should not assume that investments in the securities identified and discussed were or will be profitable.
Information presented is general information that does not take into account your individual circumstances, financial situation, or needs, nor does it present a personalized recommendation to you. Individual stocks presented may not be suitable for every investor. Investment in securities involves significant risk and has the potential for partial or complete loss of funds invested. Investment in fixed income securities has the potential for the investment return and principal value of an investment to fluctuate so that an investor’s holdings, when redeemed, may be worth less than their original cost.
One cannot invest directly in an index. Index is unmanaged and index performance does not reflect deduction of fees, expenses, or taxes. Presentation of Index data does not reflect a belief by Navellier that any stock index constitutes an investment alternative to any Navellier equity strategy or is necessarily comparable to such strategies. Among the most important differences between the Indices and Navellier strategies are that the Navellier equity strategies may (1) incur material management fees, (2) concentrate its investments in relatively few stocks, industries, or sectors, (3) have significantly greater trading activity and related costs, and (4) be significantly more or less volatile than the Indices.
ETF Risk: We may invest in exchange traded funds (“ETFs”) and some of our investment strategies are generally fully invested in ETFs. Like traditional mutual funds, ETFs charge asset-based fees, but they generally do not charge initial sales charges or redemption fees and investors typically pay only customary brokerage fees to buy and sell ETF shares. The fees and costs charged by ETFs held in client accounts will not be deducted from the compensation the client pays Navellier. ETF prices can fluctuate up or down, and a client account could lose money investing in an ETF if the prices of the securities owned by the ETF go down. ETFs are subject to additional risks:
- ETF shares may trade above or below their net asset value;
- An active trading market for an ETF’s shares may not develop or be maintained;
- The value of an ETF may be more volatile than the underlying portfolio of securities the ETF is designed to track;
- The cost of owning shares of the ETF may exceed those a client would incur by directly investing in the underlying securities; and
- Trading of an ETF’s shares may be halted if the listing exchange’s officials deem it appropriate, the shares are delisted from the exchange, or the activation of market-wide “circuit breakers” (which are tied to large decreases in stock prices) halts stock trading generally.
Grader Disclosures: Investment in equity strategies involves substantial risk and has the potential for partial or complete loss of funds invested. The sample portfolio and any accompanying charts are for informational purposes only and are not to be construed as a solicitation to buy or sell any financial instrument and should not be relied upon as the sole factor in an investment making decision. As a matter of normal and important disclosures to you, as a potential investor, please consider the following: The performance presented is not based on any actual securities trading, portfolio, or accounts, and the reported performance of the A, B, C, D, and F portfolios (collectively the “model portfolios”) should be considered mere “paper” or pro forma performance results based on Navellier’s research.
Investors evaluating any of Navellier & Associates, Inc.’s, (or its affiliates’) Investment Products must not use any information presented here, including the performance figures of the model portfolios, in their evaluation of any Navellier Investment Products. Navellier Investment Products include the firm’s mutual funds and managed accounts. The model portfolios, charts, and other information presented do not represent actual funded trades and are not actual funded portfolios. There are material differences between Navellier Investment Products’ portfolios and the model portfolios, research, and performance figures presented here. The model portfolios and the research results (1) may contain stocks or ETFs that are illiquid and difficult to trade; (2) may contain stock or ETF holdings materially different from actual funded Navellier Investment Product portfolios; (3) include the reinvestment of all dividends and other earnings, estimated trading costs, commissions, or management fees; and, (4) may not reflect prices obtained in an actual funded Navellier Investment Product portfolio. For these and other reasons, the reported performances of model portfolios do not reflect the performance results of Navellier’s actually funded and traded Investment Products. In most cases, Navellier’s Investment Products have materially lower performance results than the performances of the model portfolios presented.
This report contains statements that are, or may be considered to be, forward-looking statements. All statements that are not historical facts, including statements about our beliefs or expectations, are “forward-looking statements” within the meaning of The U.S. Private Securities Litigation Reform Act of 1995. These statements may be identified by such forward-looking terminology as “expect,” “estimate,” “plan,” “intend,” “believe,” “anticipate,” “may,” “will,” “should,” “could,” “continue,” “project,” or similar statements or variations of such terms. Our forward-looking statements are based on a series of expectations, assumptions, and projections, are not guarantees of future results or performance, and involve substantial risks and uncertainty as described in Form ADV Part 2A of our filing with the Securities and Exchange Commission (SEC), which is available at www.adviserinfo.sec.gov or by requesting a copy by emailing info@navellier.com. All of our forward-looking statements are as of the date of this report only. We can give no assurance that such expectations or forward-looking statements will prove to be correct. Actual results may differ materially. You are urged to carefully consider all such factors.
FEDERAL TAX ADVICE DISCLAIMER: As required by U.S. Treasury Regulations, you are informed that, to the extent this presentation includes any federal tax advice, the presentation is not written by Navellier to be used, and cannot be used, for the purpose of avoiding federal tax penalties. Navellier does not advise on any income tax requirements or issues. Use of any information presented by Navellier is for general information only and does not represent tax advice either express or implied. You are encouraged to seek professional tax advice for income tax questions and assistance.
IMPORTANT NEWSLETTER DISCLOSURE:The hypothetical performance results for investment newsletters that are authored or edited by Louis Navellier, including Louis Navellier’s Growth Investor, Louis Navellier’s Breakthrough Stocks, Louis Navellier’s Accelerated Profits, and Louis Navellier’s Platinum Club, are not based on any actual securities trading, portfolio, or accounts, and the newsletters’ reported hypothetical performances should be considered mere “paper” or proforma hypothetical performance results and are not actual performance of real world trades. Navellier & Associates, Inc. does not have any relation to or affiliation with the owner of these newsletters. There are material differences between Navellier Investment Products’ portfolios and the InvestorPlace Media, LLC newsletter portfolios authored by Louis Navellier. The InvestorPlace Media, LLC newsletters contain hypothetical performance that do not include transaction costs, advisory fees, or other fees a client might incur if actual investments and trades were being made by an investor. As a result, newsletter performance should not be used to evaluate Navellier Investment services which are separate and different from the newsletters. The owner of the newsletters is InvestorPlace Media, LLC and any questions concerning the newsletters, including any newsletter advertising or hypothetical Newsletter performance claims, (which are calculated solely by Investor Place Media and not Navellier) should be referred to InvestorPlace Media, LLC at (800) 718-8289.
Please note that Navellier & Associates and the Navellier Private Client Group are managed completely independent of the newsletters owned and published by InvestorPlace Media, LLC and written and edited by Louis Navellier, and investment performance of the newsletters should in no way be considered indicative of potential future investment performance for any Navellier & Associates separately managed account portfolio. Potential investors should consult with their financial advisor before investing in any Navellier Investment Product.
Navellier claims compliance with Global Investment Performance Standards (GIPS). To receive a complete list and descriptions of Navellier’s composites and/or a presentation that adheres to the GIPS standards, please contact Navellier or click here. It should not be assumed that any securities recommendations made by Navellier & Associates, Inc. in the future will be profitable or equal the performance of securities made in this report.
FactSet Disclosure: Navellier does not independently calculate the statistical information included in the attached report. The calculation and the information are provided by FactSet, a company not related to Navellier. Although information contained in the report has been obtained from FactSet and is based on sources Navellier believes to be reliable, Navellier does not guarantee its accuracy, and it may be incomplete or condensed. The report and the related FactSet sourced information are provided on an “as is” basis. The user assumes the entire risk of any use made of this information. Investors should consider the report as only a single factor in making their investment decision. The report is for informational purposes only and is not intended as an offer or solicitation for the purchase or sale of a security. FactSet sourced information is the exclusive property of FactSet. Without prior written permission of FactSet, this information may not be reproduced, disseminated or used to create any financial products. All indices are unmanaged and performance of the indices include reinvestment of dividends and interest income, unless otherwise noted, are not illustrative of any particular investment and an investment cannot be made in any index. Past performance is no guarantee of future results.