
by Gary Alexander
July 21, 2026
Two months ago, on May 19, after President Trump met Xi Jinping, China’s dictator-for-life (“Xi who must be obeyed), I asked “Is China’s Growth Dynamo Now Running on Empty?” I tentatively answered, “yes,” but now I can say it with more evidence: China has not repealed the business cycle, even though they have not seen a recession in 50 years, since Mao-Tse Tung died and the Cultural Revolution ended.
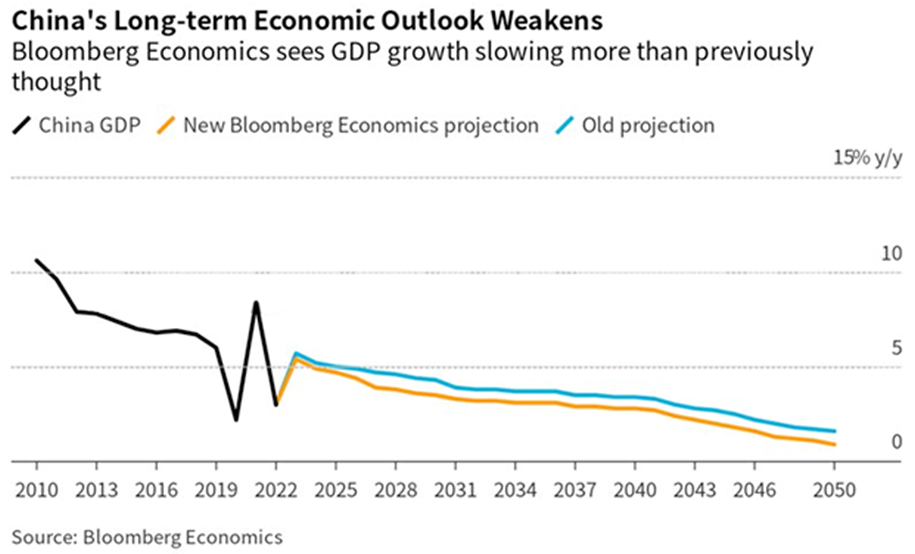
Amazingly, China has not admitted having a recession (two consecutive quarters of negative growth) since 1976. For most of those years – especially from 1983 to 2010 – China grew by at least 9% a year each of those 28 years, and at least 7% each year from 1991 to 2012 – or so they tell us – but when Xi took over in 2012, China’s growth rates were soon cut in half, enduring a slow-motion decline since then.
And now, last week, China reported its growth rate dipping to the lowest level since late 2022, when China was hip-deep in lockdowns due to a second wave of severe COVID cases. This recent decline is due in large part to slower consumer spending, which in turn is due to a deflationary real estate market and youth unemployment of around 16%, in a nation which suffers a shortage of new, younger workers.
The day after this new Chinese economic shocker came out, economist Joe Sternberg wrote a Wall Street Journal op-ed, titled: “China’s Economy is in Worse Shape Than You Think.” He began like this:
“You know something is awry in China’s economy when not even the Communist Party can claim things are going according to plan. Witness this week’s economic-growth data for the most recent quarter, which on closer inspection are shockingly bad: Beijing’s statisticians on Wednesday said the gross domestic product grew 4.3% year-over-year in inflation-adjusted terms in the April through June quarter. China’s economic data are notoriously prone to fiddling for political purposes. And this March, the Communist Party set a GDP growth target range of 4.5% to 5% for the year, its most pessimistic since the 1990s.” – WSJ, July 16, 2026.
Sternberg pointed to “accumulating evidence that the country’s true GDP growth rate may be zero, or that the economy is in outright recession….Measures of investment are in free fall: Fixed-asset investment has declined 5.7% year-to-date and real-estate investment is down 18%….If none of the components that go into GDP calculation are increasing to any great degree and China isn’t consuming energy as a growing economy would, it’s fair to wonder if even the anemic GDP figure announced this week is confected.”
One reason domestic consumption is dipping so far is the Chinese put the bulk of their savings into real estate, aka “empty buildings in ghost towns,” in hopes of future expansion. Xi also issued “consumption subsidies” (similar to the Obama-era “cash for clunkers” or Biden’s subsidies on EVs), so Sternberg says, “domestic consumption is unlikely to revive until the real estate market has found its bottom. Until that point, households will continue to experience declines in net worth,” which will dampen retail spending.
And now, China’s demographic doomsday clock makes these economic problems more explosive.
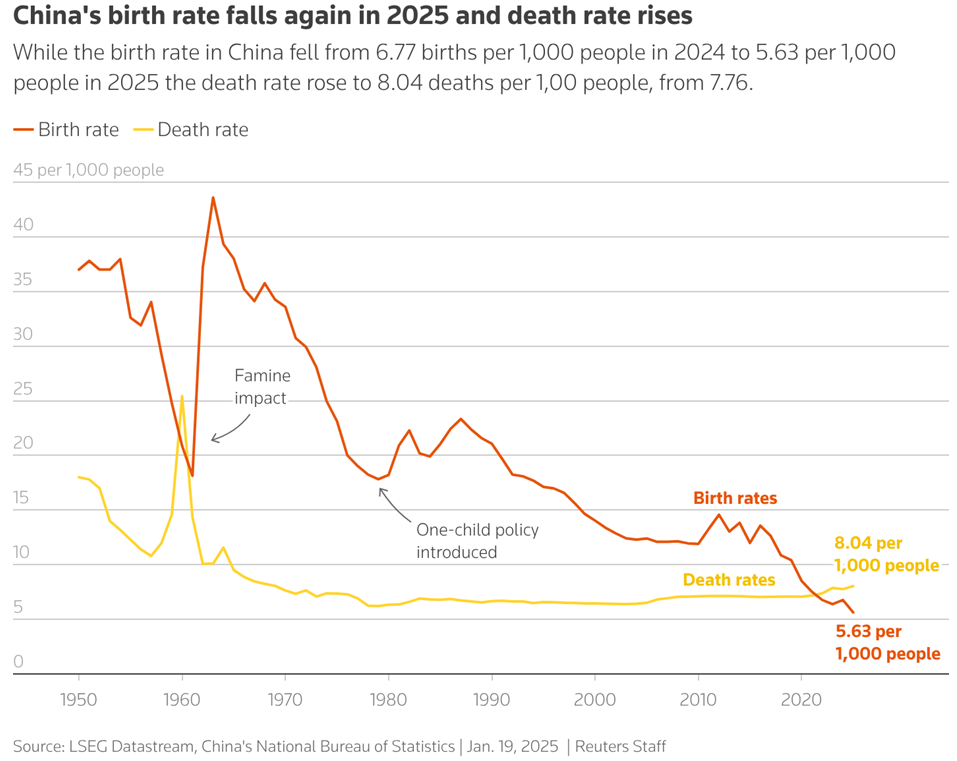
In 2024, Chinese deaths outnumbered births for the first time, signaling a peak population point, after which China is expected to decline for at least the next generation, until 2050 at the earliest, even if they start mass-producing babies now, which newly spoiled urbanized Chinese workers are not likely to do.
Graphs are for illustrative and discussion purposes only. Please read important disclosures at the end of this commentary.
Did China’s 1976 “Mandate of Heaven” Abolish Recessions – for 50 Years (So far)?
What happened to create this alleged miracle of recession-free super-growth for 50 years – if indeed the numbers are reliable? A lot is due to cheating – product piracy, floods of counterfeits, technological spying, huge deficit spending on roads to nowhere towns, and more. But the Chinese also believe their 50-year growth surge could be due to a heavenly mandate. The Chinese firmly believe a 1976 “Mandate of Heaven” led to the end of the Cultural Revolution, the death of their leaders, and heavenly eruptions.
What happened in 1976? First, the acting “vice president” of China, Chou Enlai, died in January. Mao died in September of that year. In between, Heaven spoke more loudly: On March 8, 1976, the largest meteor shower ever recorded fell on Jirin Province in Northeast China. In the summer, three earthquakes hit Northern China, destroying parts of Beijing and Tangshan, killing 665,000 and injuring 775,000. On July 28 (50 years ago next week), a magnitude 7.8 earthquake struck Tangshan in, Hebei Province, at 3:42 am, killing over 240,000 people and injuring more than 160,000, while making up to a million homeless.
After Mao died, the “Gang of Four” (including Mao’s widow) tried to take over, but they failed to gain traction, since they were largely blamed for the Cultural Revolution, the brainchild of Mrs. Mao. By late 1978, Deng Xiaoping emerged as leader. He was a champion of local capitalism under central Communist control, beginning with privatized farms and Special Economic Zones. The result of his reforms created the greatest economic growth and escape from poverty the world has ever seen, starting in 1979.
China’s phenomenal growth is now beginning to slow under the Iron Heel of its new Dictator for Life, Xi Jinping. Part of this is due to China’s old “one child policy,” from which the nation never recovered and is now paying the price, with massive armies of elderly and retired Chinese who can’t be supported by a shrinking number of young laborers. (This also puts limits on the future of “Made in China” products).
China’s 50-year growth surge raises a key question – implied in my title: Can a Communist-run economy fine-tune a half century of massive economic growth using “command and control” techniques, flying in the face of the proven historical dominance of capitalism in major Western nations in the last 250 years?
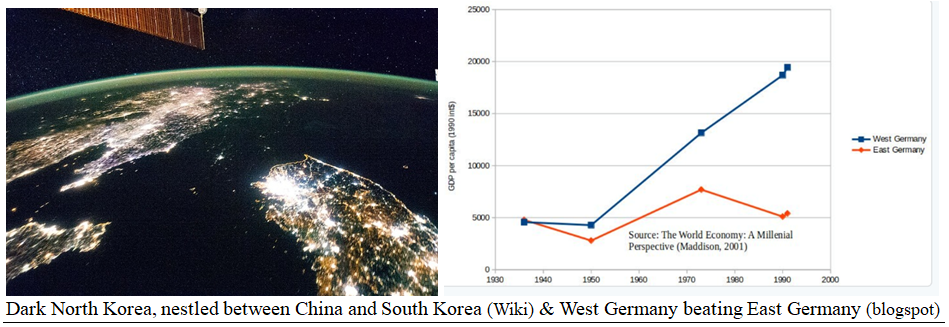
No Communist nation has ever grown this fast. Look at Cuba or side-by-side comparisons in two nations, each split in half, one side Communist, the other Capitalist – East and West Germany (1945-1990) then North and South Korea (since 1950). The nations are composed of the same people and same language, but two systems, in which capitalists (West Germany and South Korea) whipped their collectivist twins.
Graphs are for illustrative and discussion purposes only. Please read important disclosures at the end of this commentary.
Unlike the U.S., China is surrounded by 14 (mostly unfriendly) neighbors, but it has no real “twin.” The closest comparison would be Japan – a nation which treated China brutally from 1931 to 1945 – and the major superpower of the last century – the United States. Japan soared economically until 1990, but then that nation’s economic dominance collapsed, while the U.S. gained greater dominance since 1990.
Which way will China go this century? – toward collapse, like Japan, or to greater dominance, like the U.S.? Demographics and the unavoidable laws of economics point to a long-term decline, projected here:
Graphs are for illustrative and discussion purposes only. Please read important disclosures at the end of this commentary.
Can China’s economy weave magic and grow forever? Did Japan pull it off, in the past? Did Russia? No.
All content above represents the opinion of Gary Alexander of Navellier & Associates, Inc.
Also In This Issue
A Look Ahead by Louis Navellier
Lower Inflation Should Postpone Fears of Rising Interest Rates
Income Mail by Bryan Perry
The Great Rotation into AI-Proof Healthcare
Growth Mail by Gary Alexander
Is it Possible for a Nation to Be Recession-Proof – for 50 Years?
Global Mail by Ivan Martchev
The Stock Market is Not Ready for $100 Oil
Sector Spotlight by Jason Bodner
What “Fractal Motion” in Markets Looks Like
View Full Archive
Read Past Issues Here
About The Author

Gary Alexander
SENIOR EDITOR
Gary Alexander has been Senior Writer at Navellier since 2009. He edits Navellier’s weekly Marketmail and writes a weekly Growth Mail column, in which he uses market history to support the case for growth stocks. For the previous 20-years before joining Navellier, he was Senior Executive Editor at InvestorPlace Media (formerly Phillips Publishing), where he worked with several leading investment analysts, including Louis Navellier (since 1997), helping launch Louis Navellier’s Blue Chip Growth and Global Growth newsletters.
Prior to that, Gary edited Wealth Magazine and Gold Newsletter and wrote various investment research reports for Jefferson Financial in New Orleans in the 1980s. He began his financial newsletter career with KCI Communications in 1980, where he served as consulting editor for Personal Finance newsletter while serving as general manager of KCI’s Alexandria House book division. Before that, he covered the economics beat for news magazines. All content of “Growth Mail” represents the opinion of Gary Alexander
Important Disclosures:
Although information in these reports has been obtained from and is based upon sources that Navellier believes to be reliable, Navellier does not guarantee its accuracy and it may be incomplete or condensed. All opinions and estimates constitute Navellier’s judgment as of the date the report was created and are subject to change without notice. These reports are for informational purposes only and are not a solicitation for the purchase or sale of a security. Any decision to purchase securities mentioned in these reports must take into account existing public information on such securities or any registered prospectus.To the extent permitted by law, neither Navellier & Associates, Inc., nor any of its affiliates, agents, or service providers assumes any liability or responsibility nor owes any duty of care for any consequences of any person acting or refraining to act in reliance on the information contained in this communication or for any decision based on it.
Past performance is no indication of future results. Investment in securities involves significant risk and has the potential for partial or complete loss of funds invested. It should not be assumed that any securities recommendations made by Navellier. in the future will be profitable or equal the performance of securities made in this report. Dividend payments are not guaranteed. The amount of a dividend payment, if any, can vary over time and issuers may reduce dividends paid on securities in the event of a recession or adverse event affecting a specific industry or issuer.
None of the stock information, data, and company information presented herein constitutes a recommendation by Navellier or a solicitation to buy or sell any securities. Any specific securities identified and described do not represent all of the securities purchased, sold, or recommended for advisory clients. The holdings identified do not represent all of the securities purchased, sold, or recommended for advisory clients and the reader should not assume that investments in the securities identified and discussed were or will be profitable.
Information presented is general information that does not take into account your individual circumstances, financial situation, or needs, nor does it present a personalized recommendation to you. Individual stocks presented may not be suitable for every investor. Investment in securities involves significant risk and has the potential for partial or complete loss of funds invested. Investment in fixed income securities has the potential for the investment return and principal value of an investment to fluctuate so that an investor’s holdings, when redeemed, may be worth less than their original cost.
One cannot invest directly in an index. Index is unmanaged and index performance does not reflect deduction of fees, expenses, or taxes. Presentation of Index data does not reflect a belief by Navellier that any stock index constitutes an investment alternative to any Navellier equity strategy or is necessarily comparable to such strategies. Among the most important differences between the Indices and Navellier strategies are that the Navellier equity strategies may (1) incur material management fees, (2) concentrate its investments in relatively few stocks, industries, or sectors, (3) have significantly greater trading activity and related costs, and (4) be significantly more or less volatile than the Indices.
ETF Risk: We may invest in exchange traded funds (“ETFs”) and some of our investment strategies are generally fully invested in ETFs. Like traditional mutual funds, ETFs charge asset-based fees, but they generally do not charge initial sales charges or redemption fees and investors typically pay only customary brokerage fees to buy and sell ETF shares. The fees and costs charged by ETFs held in client accounts will not be deducted from the compensation the client pays Navellier. ETF prices can fluctuate up or down, and a client account could lose money investing in an ETF if the prices of the securities owned by the ETF go down. ETFs are subject to additional risks:
- ETF shares may trade above or below their net asset value;
- An active trading market for an ETF’s shares may not develop or be maintained;
- The value of an ETF may be more volatile than the underlying portfolio of securities the ETF is designed to track;
- The cost of owning shares of the ETF may exceed those a client would incur by directly investing in the underlying securities; and
- Trading of an ETF’s shares may be halted if the listing exchange’s officials deem it appropriate, the shares are delisted from the exchange, or the activation of market-wide “circuit breakers” (which are tied to large decreases in stock prices) halts stock trading generally.
Grader Disclosures: Investment in equity strategies involves substantial risk and has the potential for partial or complete loss of funds invested. The sample portfolio and any accompanying charts are for informational purposes only and are not to be construed as a solicitation to buy or sell any financial instrument and should not be relied upon as the sole factor in an investment making decision. As a matter of normal and important disclosures to you, as a potential investor, please consider the following: The performance presented is not based on any actual securities trading, portfolio, or accounts, and the reported performance of the A, B, C, D, and F portfolios (collectively the “model portfolios”) should be considered mere “paper” or pro forma performance results based on Navellier’s research.
Investors evaluating any of Navellier & Associates, Inc.’s, (or its affiliates’) Investment Products must not use any information presented here, including the performance figures of the model portfolios, in their evaluation of any Navellier Investment Products. Navellier Investment Products include the firm’s mutual funds and managed accounts. The model portfolios, charts, and other information presented do not represent actual funded trades and are not actual funded portfolios. There are material differences between Navellier Investment Products’ portfolios and the model portfolios, research, and performance figures presented here. The model portfolios and the research results (1) may contain stocks or ETFs that are illiquid and difficult to trade; (2) may contain stock or ETF holdings materially different from actual funded Navellier Investment Product portfolios; (3) include the reinvestment of all dividends and other earnings, estimated trading costs, commissions, or management fees; and, (4) may not reflect prices obtained in an actual funded Navellier Investment Product portfolio. For these and other reasons, the reported performances of model portfolios do not reflect the performance results of Navellier’s actually funded and traded Investment Products. In most cases, Navellier’s Investment Products have materially lower performance results than the performances of the model portfolios presented.
This report contains statements that are, or may be considered to be, forward-looking statements. All statements that are not historical facts, including statements about our beliefs or expectations, are “forward-looking statements” within the meaning of The U.S. Private Securities Litigation Reform Act of 1995. These statements may be identified by such forward-looking terminology as “expect,” “estimate,” “plan,” “intend,” “believe,” “anticipate,” “may,” “will,” “should,” “could,” “continue,” “project,” or similar statements or variations of such terms. Our forward-looking statements are based on a series of expectations, assumptions, and projections, are not guarantees of future results or performance, and involve substantial risks and uncertainty as described in Form ADV Part 2A of our filing with the Securities and Exchange Commission (SEC), which is available at www.adviserinfo.sec.gov or by requesting a copy by emailing info@navellier.com. All of our forward-looking statements are as of the date of this report only. We can give no assurance that such expectations or forward-looking statements will prove to be correct. Actual results may differ materially. You are urged to carefully consider all such factors.
FEDERAL TAX ADVICE DISCLAIMER: As required by U.S. Treasury Regulations, you are informed that, to the extent this presentation includes any federal tax advice, the presentation is not written by Navellier to be used, and cannot be used, for the purpose of avoiding federal tax penalties. Navellier does not advise on any income tax requirements or issues. Use of any information presented by Navellier is for general information only and does not represent tax advice either express or implied. You are encouraged to seek professional tax advice for income tax questions and assistance.
IMPORTANT NEWSLETTER DISCLOSURE:The hypothetical performance results for investment newsletters that are authored or edited by Louis Navellier, including Louis Navellier’s Growth Investor, Louis Navellier’s Breakthrough Stocks, Louis Navellier’s Accelerated Profits, and Louis Navellier’s Platinum Club, are not based on any actual securities trading, portfolio, or accounts, and the newsletters’ reported hypothetical performances should be considered mere “paper” or proforma hypothetical performance results and are not actual performance of real world trades. Navellier & Associates, Inc. does not have any relation to or affiliation with the owner of these newsletters. There are material differences between Navellier Investment Products’ portfolios and the InvestorPlace Media, LLC newsletter portfolios authored by Louis Navellier. The InvestorPlace Media, LLC newsletters contain hypothetical performance that do not include transaction costs, advisory fees, or other fees a client might incur if actual investments and trades were being made by an investor. As a result, newsletter performance should not be used to evaluate Navellier Investment services which are separate and different from the newsletters. The owner of the newsletters is InvestorPlace Media, LLC and any questions concerning the newsletters, including any newsletter advertising or hypothetical Newsletter performance claims, (which are calculated solely by Investor Place Media and not Navellier) should be referred to InvestorPlace Media, LLC at (800) 718-8289.
Please note that Navellier & Associates and the Navellier Private Client Group are managed completely independent of the newsletters owned and published by InvestorPlace Media, LLC and written and edited by Louis Navellier, and investment performance of the newsletters should in no way be considered indicative of potential future investment performance for any Navellier & Associates separately managed account portfolio. Potential investors should consult with their financial advisor before investing in any Navellier Investment Product.
Navellier claims compliance with Global Investment Performance Standards (GIPS). To receive a complete list and descriptions of Navellier’s composites and/or a presentation that adheres to the GIPS standards, please contact Navellier or click here. It should not be assumed that any securities recommendations made by Navellier & Associates, Inc. in the future will be profitable or equal the performance of securities made in this report.
FactSet Disclosure: Navellier does not independently calculate the statistical information included in the attached report. The calculation and the information are provided by FactSet, a company not related to Navellier. Although information contained in the report has been obtained from FactSet and is based on sources Navellier believes to be reliable, Navellier does not guarantee its accuracy, and it may be incomplete or condensed. The report and the related FactSet sourced information are provided on an “as is” basis. The user assumes the entire risk of any use made of this information. Investors should consider the report as only a single factor in making their investment decision. The report is for informational purposes only and is not intended as an offer or solicitation for the purchase or sale of a security. FactSet sourced information is the exclusive property of FactSet. Without prior written permission of FactSet, this information may not be reproduced, disseminated or used to create any financial products. All indices are unmanaged and performance of the indices include reinvestment of dividends and interest income, unless otherwise noted, are not illustrative of any particular investment and an investment cannot be made in any index. Past performance is no guarantee of future results.