by Gary Alexander
May 19, 2026
The press is awash with differing views of the results of last week’s Beijing summit between President Trump, with his business-oriented entourage, and China’s Xi Jinping, who seemed welcoming – except on his hot button called Taiwan. In the end, the language seemed stilted, as Xi and Trump agreed to build a “constructive China-U.S. relationship of strategic stability,” with Xi saying China’s door is “opening up and will only open wider.” They also seemed to agree on current Iran War strategies, and China expressed interest in buying more U.S. oil to wean itself from its over-reliance on Middle Eastern crude-oil.
This all reminded me of our own businessman’s tour of the emerging China colossus in May of 1996:
When our China tour concluded 30-years ago this weekend, on May 16, 1996, our 32 U.S. investors were treated to a farewell dinner at Shanghai’s Jinjiang Hotel – the same hotel where Chinese Premier Zhou Enlai and President Nixon signed their historic Shanghai Communique in February 1972, opening China.
The next morning, Friday, May 17, we awoke to a CNN news story about average Chinese noting the previous day being the 30th anniversary of the start of China’s Cultural Revolution, which began with the “May 16th Directive” that year – a diabolical second-murderous social experiment by Mao Tsetung, after his “Great Leap Forward” of 1959, which led to the starvation of over 30-million Chinese by 1962.
All over China, survivors of the labor camps during the decade-long Cultural Revolution (1966-1976) met in reunions to recall the privations they shared in that decade, yet our group seldom heard any survivors claiming some sort of reparations for these grievous wrongs. In fact, Chinese in their 40s then felt bonded by their shared suffering. At the time, I wrote, “These Chinese, now in their 40s, may be the largest group ever put into a position to change a country for the better…. Since these Chinese were forced to endure the worst their nation had to offer, in poverty and deprivation, they will surely never let it happen again.”
Our China guide, Keren Su, was typical of these Chinese Baby Boomers. Born in 1951, less than two years after Mao’s October (1949) Revolution, Keren Su survived the 1959-62 starvation only to be thrust into slave labor in his teens. On May 16, 1966 (when he was 14, almost 15), the May 16th Directive called for the arrest of the “intelligentsia.” His parents were teacher-scholars, so they were arrested and jailed. His father spent seven-years in jail, and his mother was sent to a re-education camp far away from home.
Keren Su was barred from serving in the teen-dominated Red Guards because of his family’s education, so he was sentenced to a labor camp in Harbin, in the far north of China, where he suffered bitter winters (averaging 10-degrees Fahrenheit) without heat. He suffered a lifetime of pains from those years. Yet he emerged with a positive spirit, seeking fame (and escape) by bicycling around China and taking pictures. Today, he leads tours and shoots gorgeous photography around the globe for China Span, based in Seattle.
A stunning “Mandate of Heaven” in 1976 led to the end of the Cultural Revolution. First, Chou Enlai died in January, and Mao died in September of that year. In between, Heaven spoke loudly: On March 8, 1976, the largest meteorite shower ever recorded fell on Jirin Province in Northeast China. In July and August, three-earthquakes hit Northern China, destroying parts of Beijing, and the industrial center of Tangshan, killing 665,000 and injuring 775,000. After Mao died, the “Gang of Four” (including Mao’s widow) tried to take over but failed due to outrage over the Cultural Revolution, largely launched by the evil Mrs. Mao.
By late 1978, Deng Xiaoping emerged as the next leader. He was a champion of local capitalism under central Communist control, beginning with privatized farms and Special Economic Zones, and the result of that gradual change created the greatest economic growth and escape from poverty in world history.
History’s Cycles – Civil War, to Industrial Revolution, Dominance and Decline
If I may generalize somewhat, the 20th Century’s most powerful economies emerged from a major Civil War, then recovered with an Industrial Revolution, creating a strong economy, which peaked – or fell.
• Great Britain’s Civil War was with the American colonies in 1775-83, followed by the world’s first Industrial Revolution in British factories, leading to their dominance in the 19th Century.
• America’s Civil War (1861-65) caused a devastating loss of life and destruction of our southern economy, followed by a Northern Industrial Revolution and dominance in the 20th Century
• Germany’s emergence from a gaggle of city states into a new nation in 1871 led to their own Industrial Revolution in heavy metal and armaments, leading to two devastating World Wars.*
• Russia’s Civil War between the Red Bolsheviks and White Russians, and others (1917-24) led to an Industrial Revolution under Mr. Steel (Stalin), emerging as a Superpower by his death in 1953.
• Japan lost a major World War in the 1940s and was reduced to rubble, after which (with U.S. aid) Japan became the leading new economic superpower by the 1980s, before collapsing after 1989.
• China’s Civil War (the Cultural Revolution, 1966-76) crippled that nation’s economy and people, but they revived under Deng Xiaoping’s industrial revolution to become a factory for the world.
*I covered Germany here, last week, but in this historical context, Germany’s 1866-70 Austro-Prussian conflict was their “civil war,” lasting until the end of the Franco-Prussian war of 1870. Germany was born on January 18, 1871.
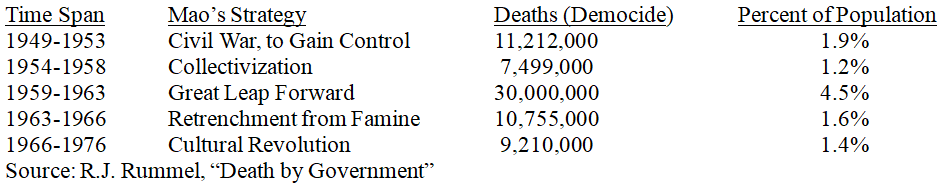
Each of these Civil Wars was very costly in human and economic terms. According to R.J. Rummel’s “Death by Government” (democide) studies, China killed over 65-million of its own people under Mao:
Graphs are for illustrative and discussion purposes only. Please read important disclosures at the end of this commentary.
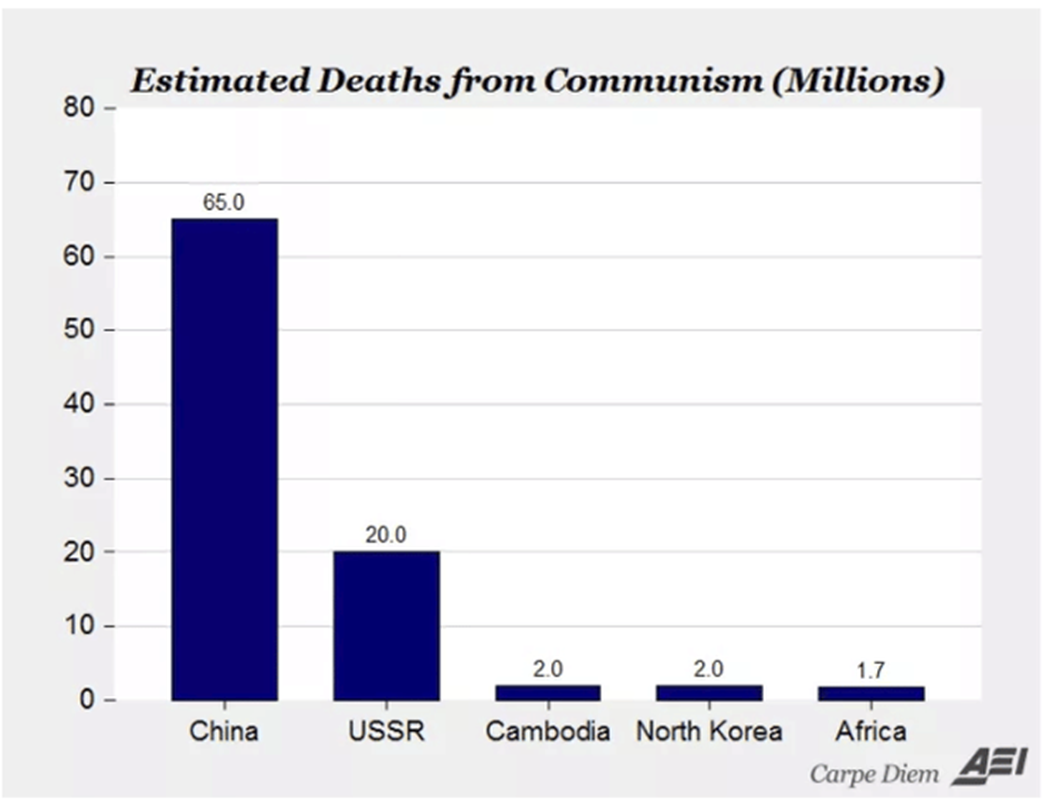
This makes Mao’s the world’s worst killer, murdering the most number of his citizens: 65+ million:
Graphs are for illustrative and discussion purposes only. Please read important disclosures at the end of this commentary.
By comparison, our own Civil War resulted in just over 600,000-deaths, about 2% of our population. But it’s useful to compare our rapid growth in the 50-years after our Civil War to China’s growth since 1976. It’s almost like China is following America’s recovery – a century later – in its recent high growth rates.
Past empires over-extended themselves and began to fail: Japan incurred too much debt and hit a speed bump in 1989, from which they never fully recovered. The Soviet Union was outspent in armaments, the only market in which they excelled, while starving their people to gin up a nuclear rivalry with the U.S.
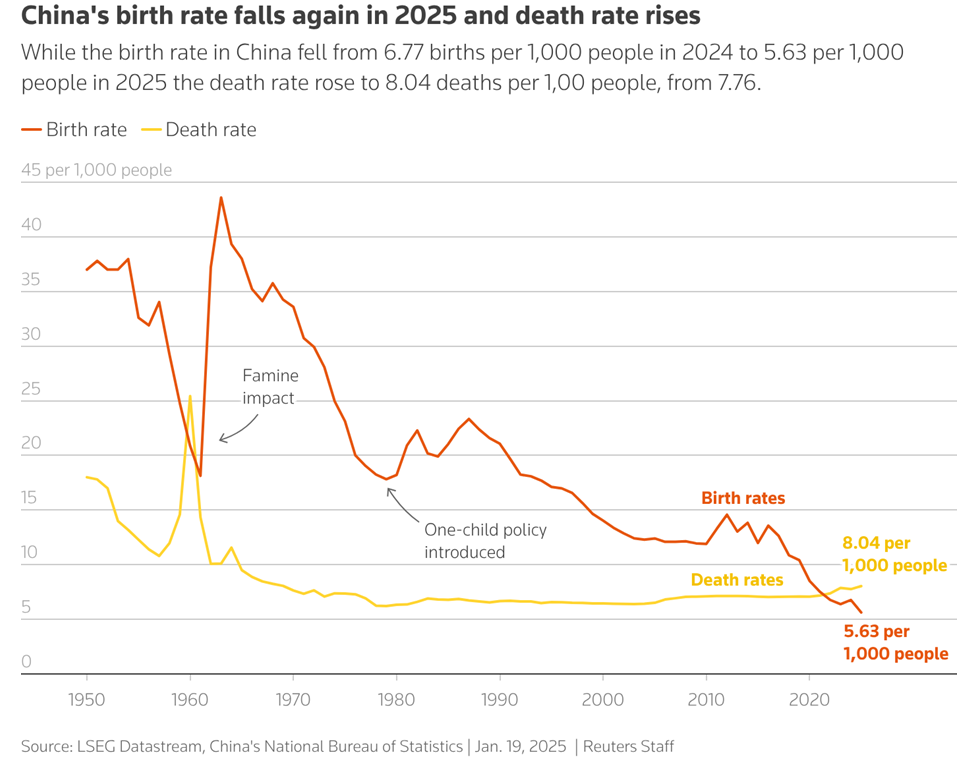
China’s phenomenal growth is now beginning to slow under the wings of its new Dictator for Life, Xi Jinping. Part of this is due to their “one child policy,” from which the nation never recovered and is now paying the price, with massive armies of elderly and retired Chinese who can’t be supported by a shrinking number of young laborers. This also puts pressure on the ubiquitous “Made in China” label.
Graphs are for illustrative and discussion purposes only. Please read important disclosures at the end of this commentary.
In 2024, Chinese deaths out-numbered births for the first time, signaling a peak population point, after which China is expected to decline for at least the next generation, until 2050 at the earliest, even if they start mass-producing babies now, which the newly spoiled urbanized Chinese are not likely to do.
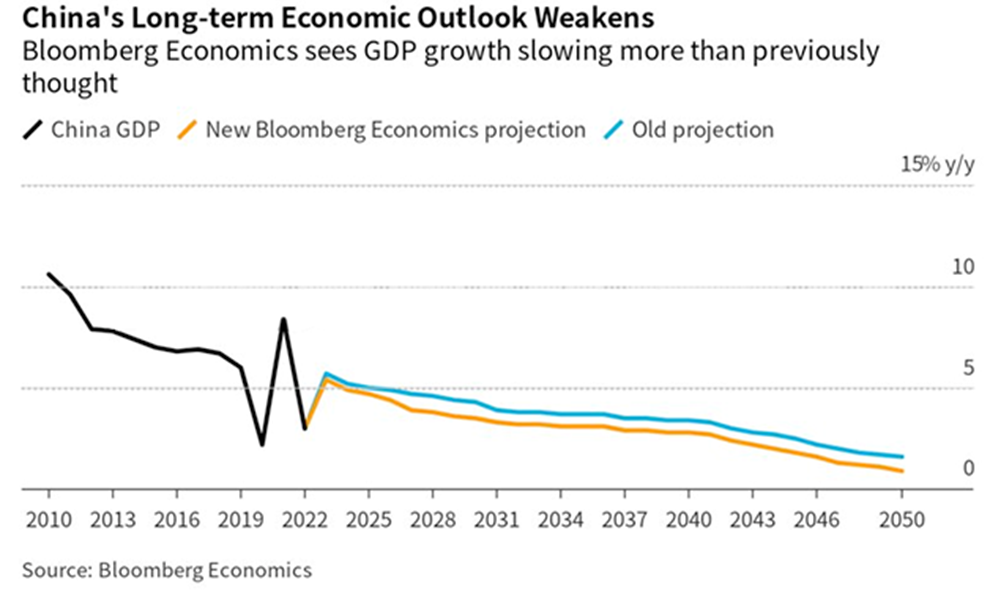
The result will be an inevitable decline from current 5% (nominal, reported) levels to near zero in 2050.
Graphs are for illustrative and discussion purposes only. Please read important disclosures at the end of this commentary.
Our job in the U.S. is to learn from the past failures of Britain, Russia, Germany, Japan, and now China.
One brief Postscript on stocks. Semiconductors are doing very well, which makes no sense if the world expects China to invade Taiwan any time soon, since Taiwan accounts for 60% to 70% of the world’s semiconductor manufacturing and up to 95% of the most advanced chips, so I watch the semiconductor sector (as in the SOXX ETF) for a clue as to whether the world now expects China to invade Taiwan. Semi-conductors are up 150% in the last 12-months, and the PHLX semi-index (^SOX) is also up 150%.
All content above represents the opinion of Gary Alexander of Navellier & Associates, Inc.
Also In This Issue
A Look Ahead by Louis Navellier
Inflation (and GDP) Soared in April
Income Mail by Bryan Perry
Trump Trip Triggers a Rare Pullback in the Super AI Tech Sector
Growth Mail by Gary Alexander
Is China’s Growth Dynamo Now Running on Empty?
Global Mail by Ivan Martchev
Quantifying a “Normal” Correction
Sector Spotlight by Jason Bodner
Headlines Scream, While Money Flows Whisper
View Full Archive
Read Past Issues Here
About The Author

Gary Alexander
SENIOR EDITOR
Gary Alexander has been Senior Writer at Navellier since 2009. He edits Navellier’s weekly Marketmail and writes a weekly Growth Mail column, in which he uses market history to support the case for growth stocks. For the previous 20-years before joining Navellier, he was Senior Executive Editor at InvestorPlace Media (formerly Phillips Publishing), where he worked with several leading investment analysts, including Louis Navellier (since 1997), helping launch Louis Navellier’s Blue Chip Growth and Global Growth newsletters.
Prior to that, Gary edited Wealth Magazine and Gold Newsletter and wrote various investment research reports for Jefferson Financial in New Orleans in the 1980s. He began his financial newsletter career with KCI Communications in 1980, where he served as consulting editor for Personal Finance newsletter while serving as general manager of KCI’s Alexandria House book division. Before that, he covered the economics beat for news magazines. All content of “Growth Mail” represents the opinion of Gary Alexander
Important Disclosures:
Although information in these reports has been obtained from and is based upon sources that Navellier believes to be reliable, Navellier does not guarantee its accuracy and it may be incomplete or condensed. All opinions and estimates constitute Navellier’s judgment as of the date the report was created and are subject to change without notice. These reports are for informational purposes only and are not a solicitation for the purchase or sale of a security. Any decision to purchase securities mentioned in these reports must take into account existing public information on such securities or any registered prospectus.To the extent permitted by law, neither Navellier & Associates, Inc., nor any of its affiliates, agents, or service providers assumes any liability or responsibility nor owes any duty of care for any consequences of any person acting or refraining to act in reliance on the information contained in this communication or for any decision based on it.
Past performance is no indication of future results. Investment in securities involves significant risk and has the potential for partial or complete loss of funds invested. It should not be assumed that any securities recommendations made by Navellier. in the future will be profitable or equal the performance of securities made in this report. Dividend payments are not guaranteed. The amount of a dividend payment, if any, can vary over time and issuers may reduce dividends paid on securities in the event of a recession or adverse event affecting a specific industry or issuer.
None of the stock information, data, and company information presented herein constitutes a recommendation by Navellier or a solicitation to buy or sell any securities. Any specific securities identified and described do not represent all of the securities purchased, sold, or recommended for advisory clients. The holdings identified do not represent all of the securities purchased, sold, or recommended for advisory clients and the reader should not assume that investments in the securities identified and discussed were or will be profitable.
Information presented is general information that does not take into account your individual circumstances, financial situation, or needs, nor does it present a personalized recommendation to you. Individual stocks presented may not be suitable for every investor. Investment in securities involves significant risk and has the potential for partial or complete loss of funds invested. Investment in fixed income securities has the potential for the investment return and principal value of an investment to fluctuate so that an investor’s holdings, when redeemed, may be worth less than their original cost.
One cannot invest directly in an index. Index is unmanaged and index performance does not reflect deduction of fees, expenses, or taxes. Presentation of Index data does not reflect a belief by Navellier that any stock index constitutes an investment alternative to any Navellier equity strategy or is necessarily comparable to such strategies. Among the most important differences between the Indices and Navellier strategies are that the Navellier equity strategies may (1) incur material management fees, (2) concentrate its investments in relatively few stocks, industries, or sectors, (3) have significantly greater trading activity and related costs, and (4) be significantly more or less volatile than the Indices.
ETF Risk: We may invest in exchange traded funds (“ETFs”) and some of our investment strategies are generally fully invested in ETFs. Like traditional mutual funds, ETFs charge asset-based fees, but they generally do not charge initial sales charges or redemption fees and investors typically pay only customary brokerage fees to buy and sell ETF shares. The fees and costs charged by ETFs held in client accounts will not be deducted from the compensation the client pays Navellier. ETF prices can fluctuate up or down, and a client account could lose money investing in an ETF if the prices of the securities owned by the ETF go down. ETFs are subject to additional risks:
- ETF shares may trade above or below their net asset value;
- An active trading market for an ETF’s shares may not develop or be maintained;
- The value of an ETF may be more volatile than the underlying portfolio of securities the ETF is designed to track;
- The cost of owning shares of the ETF may exceed those a client would incur by directly investing in the underlying securities; and
- Trading of an ETF’s shares may be halted if the listing exchange’s officials deem it appropriate, the shares are delisted from the exchange, or the activation of market-wide “circuit breakers” (which are tied to large decreases in stock prices) halts stock trading generally.
Grader Disclosures: Investment in equity strategies involves substantial risk and has the potential for partial or complete loss of funds invested. The sample portfolio and any accompanying charts are for informational purposes only and are not to be construed as a solicitation to buy or sell any financial instrument and should not be relied upon as the sole factor in an investment making decision. As a matter of normal and important disclosures to you, as a potential investor, please consider the following: The performance presented is not based on any actual securities trading, portfolio, or accounts, and the reported performance of the A, B, C, D, and F portfolios (collectively the “model portfolios”) should be considered mere “paper” or pro forma performance results based on Navellier’s research.
Investors evaluating any of Navellier & Associates, Inc.’s, (or its affiliates’) Investment Products must not use any information presented here, including the performance figures of the model portfolios, in their evaluation of any Navellier Investment Products. Navellier Investment Products include the firm’s mutual funds and managed accounts. The model portfolios, charts, and other information presented do not represent actual funded trades and are not actual funded portfolios. There are material differences between Navellier Investment Products’ portfolios and the model portfolios, research, and performance figures presented here. The model portfolios and the research results (1) may contain stocks or ETFs that are illiquid and difficult to trade; (2) may contain stock or ETF holdings materially different from actual funded Navellier Investment Product portfolios; (3) include the reinvestment of all dividends and other earnings, estimated trading costs, commissions, or management fees; and, (4) may not reflect prices obtained in an actual funded Navellier Investment Product portfolio. For these and other reasons, the reported performances of model portfolios do not reflect the performance results of Navellier’s actually funded and traded Investment Products. In most cases, Navellier’s Investment Products have materially lower performance results than the performances of the model portfolios presented.
This report contains statements that are, or may be considered to be, forward-looking statements. All statements that are not historical facts, including statements about our beliefs or expectations, are “forward-looking statements” within the meaning of The U.S. Private Securities Litigation Reform Act of 1995. These statements may be identified by such forward-looking terminology as “expect,” “estimate,” “plan,” “intend,” “believe,” “anticipate,” “may,” “will,” “should,” “could,” “continue,” “project,” or similar statements or variations of such terms. Our forward-looking statements are based on a series of expectations, assumptions, and projections, are not guarantees of future results or performance, and involve substantial risks and uncertainty as described in Form ADV Part 2A of our filing with the Securities and Exchange Commission (SEC), which is available at www.adviserinfo.sec.gov or by requesting a copy by emailing info@navellier.com. All of our forward-looking statements are as of the date of this report only. We can give no assurance that such expectations or forward-looking statements will prove to be correct. Actual results may differ materially. You are urged to carefully consider all such factors.
FEDERAL TAX ADVICE DISCLAIMER: As required by U.S. Treasury Regulations, you are informed that, to the extent this presentation includes any federal tax advice, the presentation is not written by Navellier to be used, and cannot be used, for the purpose of avoiding federal tax penalties. Navellier does not advise on any income tax requirements or issues. Use of any information presented by Navellier is for general information only and does not represent tax advice either express or implied. You are encouraged to seek professional tax advice for income tax questions and assistance.
IMPORTANT NEWSLETTER DISCLOSURE:The hypothetical performance results for investment newsletters that are authored or edited by Louis Navellier, including Louis Navellier’s Growth Investor, Louis Navellier’s Breakthrough Stocks, Louis Navellier’s Accelerated Profits, and Louis Navellier’s Platinum Club, are not based on any actual securities trading, portfolio, or accounts, and the newsletters’ reported hypothetical performances should be considered mere “paper” or proforma hypothetical performance results and are not actual performance of real world trades. Navellier & Associates, Inc. does not have any relation to or affiliation with the owner of these newsletters. There are material differences between Navellier Investment Products’ portfolios and the InvestorPlace Media, LLC newsletter portfolios authored by Louis Navellier. The InvestorPlace Media, LLC newsletters contain hypothetical performance that do not include transaction costs, advisory fees, or other fees a client might incur if actual investments and trades were being made by an investor. As a result, newsletter performance should not be used to evaluate Navellier Investment services which are separate and different from the newsletters. The owner of the newsletters is InvestorPlace Media, LLC and any questions concerning the newsletters, including any newsletter advertising or hypothetical Newsletter performance claims, (which are calculated solely by Investor Place Media and not Navellier) should be referred to InvestorPlace Media, LLC at (800) 718-8289.
Please note that Navellier & Associates and the Navellier Private Client Group are managed completely independent of the newsletters owned and published by InvestorPlace Media, LLC and written and edited by Louis Navellier, and investment performance of the newsletters should in no way be considered indicative of potential future investment performance for any Navellier & Associates separately managed account portfolio. Potential investors should consult with their financial advisor before investing in any Navellier Investment Product.
Navellier claims compliance with Global Investment Performance Standards (GIPS). To receive a complete list and descriptions of Navellier’s composites and/or a presentation that adheres to the GIPS standards, please contact Navellier or click here. It should not be assumed that any securities recommendations made by Navellier & Associates, Inc. in the future will be profitable or equal the performance of securities made in this report.
FactSet Disclosure: Navellier does not independently calculate the statistical information included in the attached report. The calculation and the information are provided by FactSet, a company not related to Navellier. Although information contained in the report has been obtained from FactSet and is based on sources Navellier believes to be reliable, Navellier does not guarantee its accuracy, and it may be incomplete or condensed. The report and the related FactSet sourced information are provided on an “as is” basis. The user assumes the entire risk of any use made of this information. Investors should consider the report as only a single factor in making their investment decision. The report is for informational purposes only and is not intended as an offer or solicitation for the purchase or sale of a security. FactSet sourced information is the exclusive property of FactSet. Without prior written permission of FactSet, this information may not be reproduced, disseminated or used to create any financial products. All indices are unmanaged and performance of the indices include reinvestment of dividends and interest income, unless otherwise noted, are not illustrative of any particular investment and an investment cannot be made in any index. Past performance is no guarantee of future results.