by Gary Alexander
May 12, 2026
As we passed the 81st anniversary of Victory in Europe (V-E Day, May 8, 1945) last week, it brought to mind how well that continent recovered from major wars and conflicts over the last century, but it also brought to mind the sad fact Europe is once again facing serious challenges to its growth and security.
After massive bombing raids, Germany was almost totally destroyed, but this primary adversary in that global conflict recovered more rapidly than anyone then thought possible, due in large part to Marshall Plan aid and finance minister Ludwig Erhard’s Economic Miracle (“Wirtschaftswunder”). Soon, quality German cars, cameras, machinery and other sectors rose the ashes faster than anyone expected, as we learned the painful lesson from World War I not to cripple our former adversary but help them recover.

After the Berlin Wall fell in 1989, Europe grew in parallel with the U.S. as an economic power. After the 2008 crisis, however, Europe was slow to recover. Since 2010, the U.S. economy significantly outperformed the European Union (EU), with America’s nominal GDP more than doubling, from $14.8-trillion in 2008 to $31.3-trillion now, compared with the EU’s tepid total of just 13% growth ($16.4-trillion to $18.6-trillion) since 2008, with virtually no growth in the recession-ridden years 2023 to 2026. (The United Kingdom didn’t do much better, growing by a total of only 15% in the 17 years since 2008).
In The Wall Street Journal last May Day (Friday, May 1), economist Joseph C. Sternberg penned an op-ed titled, “What Happens When Europeans Find Out How Poor They Are?” He cited some of the numbers I’ll quote here, plus this: “Politically, bliss is ignorance. European welfare states, by creating relatively comfortable lives for voters, conceal the full extent of Europe’s prosperity gap.” Yes, it’s nice to live a “comfortable” life, but only after you struggle and fight to create progress, reaping “comfort” later on.
Sternberg closed with this warning: “The bliss will run out when the funding for welfare does. Voters will then have to confront their failure to generate enough growth to pay for social benefits….”
According to World Bank data, shown in the chart below, the EU’s total output in 2007 exceeded that of the U.S., but then Europe quickly sank behind the U.S. and continues to lag farther behind in the 2020s.
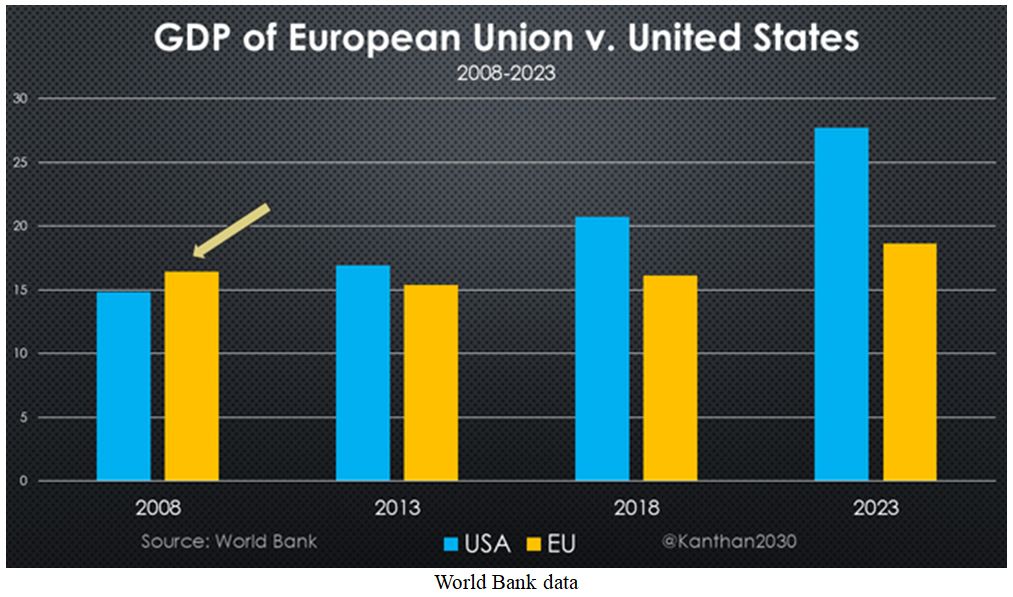
Graphs are for illustrative and discussion purposes only. Please read important disclosures at the end of this commentary.
As it turns out, the U.S. suffered no recession between 2009 and the COVID attack in 2020, while Europe suffered an immediate second deep recession in 2010-12, tied to the sovereign debt crisis emerging in the EU’s Mediterranean region – the so called “PIGS” – an acronym for Portugal, Italy, Greece and Spain.
In 2008, EU and U.S. GDPs were roughly equal, but now U.S. GDP is roughly 50% above the EU’s GDP.
Accounting for population, per capita income comparisons are even more dismal. According to the IMF, per capita GDP is currently $94,400 in the U.S. compared with $65,300 in Germany, $61,000 in the UK and $52,000 in France – the three biggest economies in Europe. Overall, EU per capita GDP has fallen from 76% of U.S. levels in 2008 to barely half that today, due to weak members hobbling their growth.
In 2024, according to Greg Ip, writing (“U.S. Economy Reigns…” in the Wall Street Journal, 2024), the U.S. accounted for “26.3% of the global gross domestic product, the highest in almost two decades.” As this two-year-old chart shows, the EU/UK out-produced the U.S. until their lines crossed in 2014:
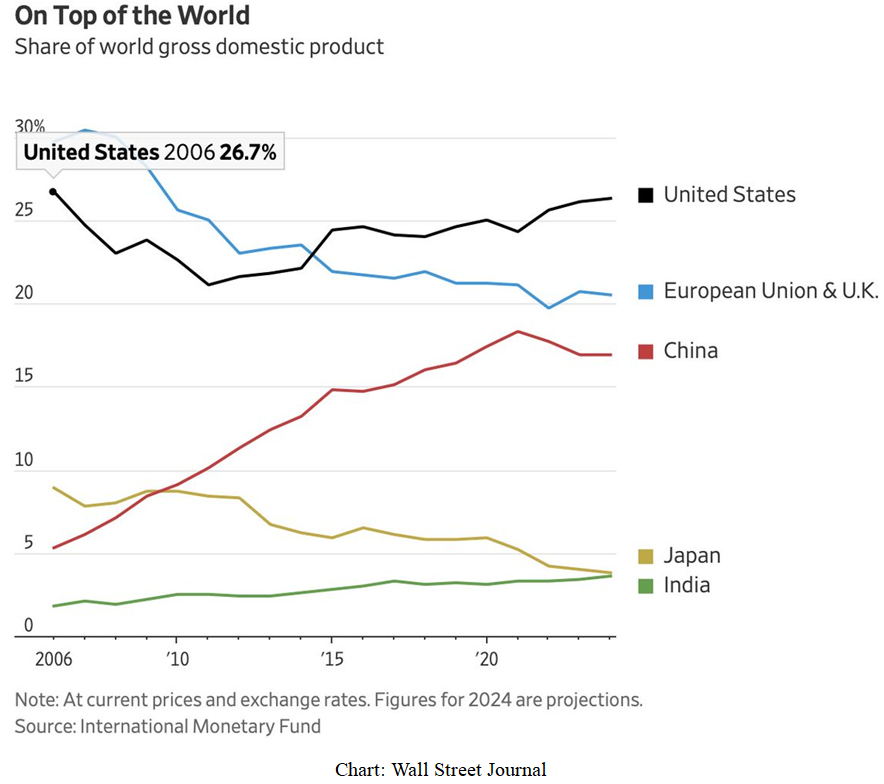
Graphs are for illustrative and discussion purposes only. Please read important disclosures at the end of this commentary.
China has ascended, until recently, but China has started to sag due to its new demographic realities.
U.S. dominance is even more pronounced in terms of stock market profits. Since 2010, U.S. market capitalization (as a percent of the world), has grown from barely 40% to over 60%, according to MSCI.
Limiting the data to the U.S vs. Europe, these two major market blocs rose or fell in tandem for two decades after the fall of the Berlin Wall, 1989 to 2009, but then the U.S. market lead took over, big time:
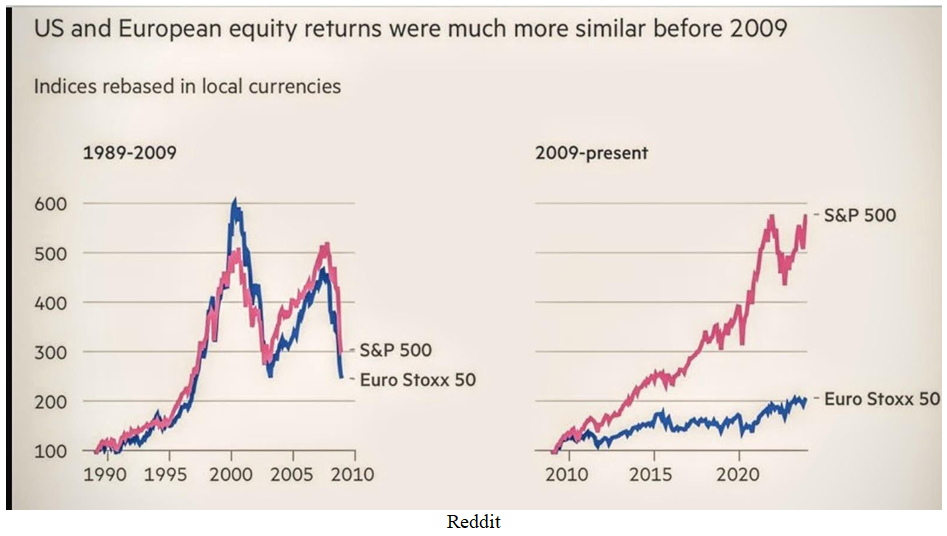
Graphs are for illustrative and discussion purposes only. Please read important disclosures at the end of this commentary.
Some Reasons Why the U.S. Will Likely Remain No. 1
One major reason the U.S. is running laps around Europe is that we encourage technological advances, and we welcome immigrants more so than any other nation or region. Those two forces combine when we see about half the founders of our Magnificent 7 companies are immigrants – like South Africa-born Elon Musk; Nelsen Huang, a Taiwan native; Sergey Brin, Russian-born co-founder of the major search engine, plus Polish American Steve Wozniak and Syrian American Steve Jobs forming Apple 50-years ago. We have two current CEOs of Mag-7 companies who were born in India – Sundar Pichai and Satya Nadella.
I’ll bet most of my readers here cannot name any major technology innovator domiciled in Europe (without tapping into AI or a search engine), or any European technology giant founded or led by immigrants there.
Sure, other nations can copy or steal our technology, but do these other nations innovate or create big new ideas? Not very often, due to strong central controls over private productivity and output there, robbing their creative geniuses of the fruits of their creativity – so their most creative citizens migrate to the U.S.
The U.S. assimilates immigrants better than most other countries, especially those among our major competitors in Europe and Asia. This is fairly evident when you walk the streets of Tokyo or Beijing.
Why do we assimilate others so well? As he often did, Ronald Reagan put it best, here in a 1988 speech:
“America represents something universal in the human spirit. I received a letter not long ago from a man who said, ‘You can go to Japan to live, but you cannot become Japanese. You can go to France to live and not become a Frenchman. You can go to live in Germany or Turkey, and you won’t become a German or a Turk.’ But then he added, ‘Anybody from any corner of the world can come to America to live and become an American.’ A person becomes an American by adopting America’s principles, especially those … in the Declaration of Independence.”
That’s something to bear in mind as we approach the Declaration’s 250th birthday this July 4th.
Also, American states had their Civil War but now live in peace, creating a fertile laboratory of growth, with 50-states competing to attract businesses and population (i.e., taxpayers) luring better ideas to their state by offering more freedom, while those states intent on punishing businesses and people (with high taxes and regulations) generally lose population. By contrast, Europe remains fractured, not united.
The world keeps saying America is a “young” nation – not as mature as Europe – but we have the world’s oldest and longest lasting Constitutional republic, while the fractured EU is barely 30-years old, a newbie.
To the world, we say, “Come to America, or copy us, your choice,” but don’t let old ideas cripple you.
Navellier & Associates; own Apple Inc. (AAPL) in managed accounts. Gary Alexander does not personally own Apple Inc. (AAPL).
All content above represents the opinion of Gary Alexander of Navellier & Associates, Inc.
Also In This Issue
A Look Ahead by Louis Navellier
Job Growth Exceeds Analyst Expectations
Income Mail by Bryan Perry
The Bullish Outlook for U.S. Energy Infrastructure Strengthens
Growth Mail by Gary Alexander
America is Running Economic Laps Around Europe
Global Mail by Ivan Martchev
Political Considerations Before the Trump-Xi Summit
Sector Spotlight by Jason Bodner
When the Tide Turns This Fast, Pay Attention
View Full Archive
Read Past Issues Here
About The Author

Gary Alexander
SENIOR EDITOR
Gary Alexander has been Senior Writer at Navellier since 2009. He edits Navellier’s weekly Marketmail and writes a weekly Growth Mail column, in which he uses market history to support the case for growth stocks. For the previous 20-years before joining Navellier, he was Senior Executive Editor at InvestorPlace Media (formerly Phillips Publishing), where he worked with several leading investment analysts, including Louis Navellier (since 1997), helping launch Louis Navellier’s Blue Chip Growth and Global Growth newsletters.
Prior to that, Gary edited Wealth Magazine and Gold Newsletter and wrote various investment research reports for Jefferson Financial in New Orleans in the 1980s. He began his financial newsletter career with KCI Communications in 1980, where he served as consulting editor for Personal Finance newsletter while serving as general manager of KCI’s Alexandria House book division. Before that, he covered the economics beat for news magazines. All content of “Growth Mail” represents the opinion of Gary Alexander
Important Disclosures:
Although information in these reports has been obtained from and is based upon sources that Navellier believes to be reliable, Navellier does not guarantee its accuracy and it may be incomplete or condensed. All opinions and estimates constitute Navellier’s judgment as of the date the report was created and are subject to change without notice. These reports are for informational purposes only and are not a solicitation for the purchase or sale of a security. Any decision to purchase securities mentioned in these reports must take into account existing public information on such securities or any registered prospectus.To the extent permitted by law, neither Navellier & Associates, Inc., nor any of its affiliates, agents, or service providers assumes any liability or responsibility nor owes any duty of care for any consequences of any person acting or refraining to act in reliance on the information contained in this communication or for any decision based on it.
Past performance is no indication of future results. Investment in securities involves significant risk and has the potential for partial or complete loss of funds invested. It should not be assumed that any securities recommendations made by Navellier. in the future will be profitable or equal the performance of securities made in this report. Dividend payments are not guaranteed. The amount of a dividend payment, if any, can vary over time and issuers may reduce dividends paid on securities in the event of a recession or adverse event affecting a specific industry or issuer.
None of the stock information, data, and company information presented herein constitutes a recommendation by Navellier or a solicitation to buy or sell any securities. Any specific securities identified and described do not represent all of the securities purchased, sold, or recommended for advisory clients. The holdings identified do not represent all of the securities purchased, sold, or recommended for advisory clients and the reader should not assume that investments in the securities identified and discussed were or will be profitable.
Information presented is general information that does not take into account your individual circumstances, financial situation, or needs, nor does it present a personalized recommendation to you. Individual stocks presented may not be suitable for every investor. Investment in securities involves significant risk and has the potential for partial or complete loss of funds invested. Investment in fixed income securities has the potential for the investment return and principal value of an investment to fluctuate so that an investor’s holdings, when redeemed, may be worth less than their original cost.
One cannot invest directly in an index. Index is unmanaged and index performance does not reflect deduction of fees, expenses, or taxes. Presentation of Index data does not reflect a belief by Navellier that any stock index constitutes an investment alternative to any Navellier equity strategy or is necessarily comparable to such strategies. Among the most important differences between the Indices and Navellier strategies are that the Navellier equity strategies may (1) incur material management fees, (2) concentrate its investments in relatively few stocks, industries, or sectors, (3) have significantly greater trading activity and related costs, and (4) be significantly more or less volatile than the Indices.
ETF Risk: We may invest in exchange traded funds (“ETFs”) and some of our investment strategies are generally fully invested in ETFs. Like traditional mutual funds, ETFs charge asset-based fees, but they generally do not charge initial sales charges or redemption fees and investors typically pay only customary brokerage fees to buy and sell ETF shares. The fees and costs charged by ETFs held in client accounts will not be deducted from the compensation the client pays Navellier. ETF prices can fluctuate up or down, and a client account could lose money investing in an ETF if the prices of the securities owned by the ETF go down. ETFs are subject to additional risks:
- ETF shares may trade above or below their net asset value;
- An active trading market for an ETF’s shares may not develop or be maintained;
- The value of an ETF may be more volatile than the underlying portfolio of securities the ETF is designed to track;
- The cost of owning shares of the ETF may exceed those a client would incur by directly investing in the underlying securities; and
- Trading of an ETF’s shares may be halted if the listing exchange’s officials deem it appropriate, the shares are delisted from the exchange, or the activation of market-wide “circuit breakers” (which are tied to large decreases in stock prices) halts stock trading generally.
Grader Disclosures: Investment in equity strategies involves substantial risk and has the potential for partial or complete loss of funds invested. The sample portfolio and any accompanying charts are for informational purposes only and are not to be construed as a solicitation to buy or sell any financial instrument and should not be relied upon as the sole factor in an investment making decision. As a matter of normal and important disclosures to you, as a potential investor, please consider the following: The performance presented is not based on any actual securities trading, portfolio, or accounts, and the reported performance of the A, B, C, D, and F portfolios (collectively the “model portfolios”) should be considered mere “paper” or pro forma performance results based on Navellier’s research.
Investors evaluating any of Navellier & Associates, Inc.’s, (or its affiliates’) Investment Products must not use any information presented here, including the performance figures of the model portfolios, in their evaluation of any Navellier Investment Products. Navellier Investment Products include the firm’s mutual funds and managed accounts. The model portfolios, charts, and other information presented do not represent actual funded trades and are not actual funded portfolios. There are material differences between Navellier Investment Products’ portfolios and the model portfolios, research, and performance figures presented here. The model portfolios and the research results (1) may contain stocks or ETFs that are illiquid and difficult to trade; (2) may contain stock or ETF holdings materially different from actual funded Navellier Investment Product portfolios; (3) include the reinvestment of all dividends and other earnings, estimated trading costs, commissions, or management fees; and, (4) may not reflect prices obtained in an actual funded Navellier Investment Product portfolio. For these and other reasons, the reported performances of model portfolios do not reflect the performance results of Navellier’s actually funded and traded Investment Products. In most cases, Navellier’s Investment Products have materially lower performance results than the performances of the model portfolios presented.
This report contains statements that are, or may be considered to be, forward-looking statements. All statements that are not historical facts, including statements about our beliefs or expectations, are “forward-looking statements” within the meaning of The U.S. Private Securities Litigation Reform Act of 1995. These statements may be identified by such forward-looking terminology as “expect,” “estimate,” “plan,” “intend,” “believe,” “anticipate,” “may,” “will,” “should,” “could,” “continue,” “project,” or similar statements or variations of such terms. Our forward-looking statements are based on a series of expectations, assumptions, and projections, are not guarantees of future results or performance, and involve substantial risks and uncertainty as described in Form ADV Part 2A of our filing with the Securities and Exchange Commission (SEC), which is available at www.adviserinfo.sec.gov or by requesting a copy by emailing info@navellier.com. All of our forward-looking statements are as of the date of this report only. We can give no assurance that such expectations or forward-looking statements will prove to be correct. Actual results may differ materially. You are urged to carefully consider all such factors.
FEDERAL TAX ADVICE DISCLAIMER: As required by U.S. Treasury Regulations, you are informed that, to the extent this presentation includes any federal tax advice, the presentation is not written by Navellier to be used, and cannot be used, for the purpose of avoiding federal tax penalties. Navellier does not advise on any income tax requirements or issues. Use of any information presented by Navellier is for general information only and does not represent tax advice either express or implied. You are encouraged to seek professional tax advice for income tax questions and assistance.
IMPORTANT NEWSLETTER DISCLOSURE:The hypothetical performance results for investment newsletters that are authored or edited by Louis Navellier, including Louis Navellier’s Growth Investor, Louis Navellier’s Breakthrough Stocks, Louis Navellier’s Accelerated Profits, and Louis Navellier’s Platinum Club, are not based on any actual securities trading, portfolio, or accounts, and the newsletters’ reported hypothetical performances should be considered mere “paper” or proforma hypothetical performance results and are not actual performance of real world trades. Navellier & Associates, Inc. does not have any relation to or affiliation with the owner of these newsletters. There are material differences between Navellier Investment Products’ portfolios and the InvestorPlace Media, LLC newsletter portfolios authored by Louis Navellier. The InvestorPlace Media, LLC newsletters contain hypothetical performance that do not include transaction costs, advisory fees, or other fees a client might incur if actual investments and trades were being made by an investor. As a result, newsletter performance should not be used to evaluate Navellier Investment services which are separate and different from the newsletters. The owner of the newsletters is InvestorPlace Media, LLC and any questions concerning the newsletters, including any newsletter advertising or hypothetical Newsletter performance claims, (which are calculated solely by Investor Place Media and not Navellier) should be referred to InvestorPlace Media, LLC at (800) 718-8289.
Please note that Navellier & Associates and the Navellier Private Client Group are managed completely independent of the newsletters owned and published by InvestorPlace Media, LLC and written and edited by Louis Navellier, and investment performance of the newsletters should in no way be considered indicative of potential future investment performance for any Navellier & Associates separately managed account portfolio. Potential investors should consult with their financial advisor before investing in any Navellier Investment Product.
Navellier claims compliance with Global Investment Performance Standards (GIPS). To receive a complete list and descriptions of Navellier’s composites and/or a presentation that adheres to the GIPS standards, please contact Navellier or click here. It should not be assumed that any securities recommendations made by Navellier & Associates, Inc. in the future will be profitable or equal the performance of securities made in this report.
FactSet Disclosure: Navellier does not independently calculate the statistical information included in the attached report. The calculation and the information are provided by FactSet, a company not related to Navellier. Although information contained in the report has been obtained from FactSet and is based on sources Navellier believes to be reliable, Navellier does not guarantee its accuracy, and it may be incomplete or condensed. The report and the related FactSet sourced information are provided on an “as is” basis. The user assumes the entire risk of any use made of this information. Investors should consider the report as only a single factor in making their investment decision. The report is for informational purposes only and is not intended as an offer or solicitation for the purchase or sale of a security. FactSet sourced information is the exclusive property of FactSet. Without prior written permission of FactSet, this information may not be reproduced, disseminated or used to create any financial products. All indices are unmanaged and performance of the indices include reinvestment of dividends and interest income, unless otherwise noted, are not illustrative of any particular investment and an investment cannot be made in any index. Past performance is no guarantee of future results.