by Jason Bodner
Mat 12, 2026
Sunlight takes 8-minutes and 20-seconds to reach Earth, as photons cross 93-million miles of vacuum, smash into the atmosphere and create a new morning. Most of us haven’t even had our coffee by then.
Capital in the stock market can move that fast, too. And it just did.
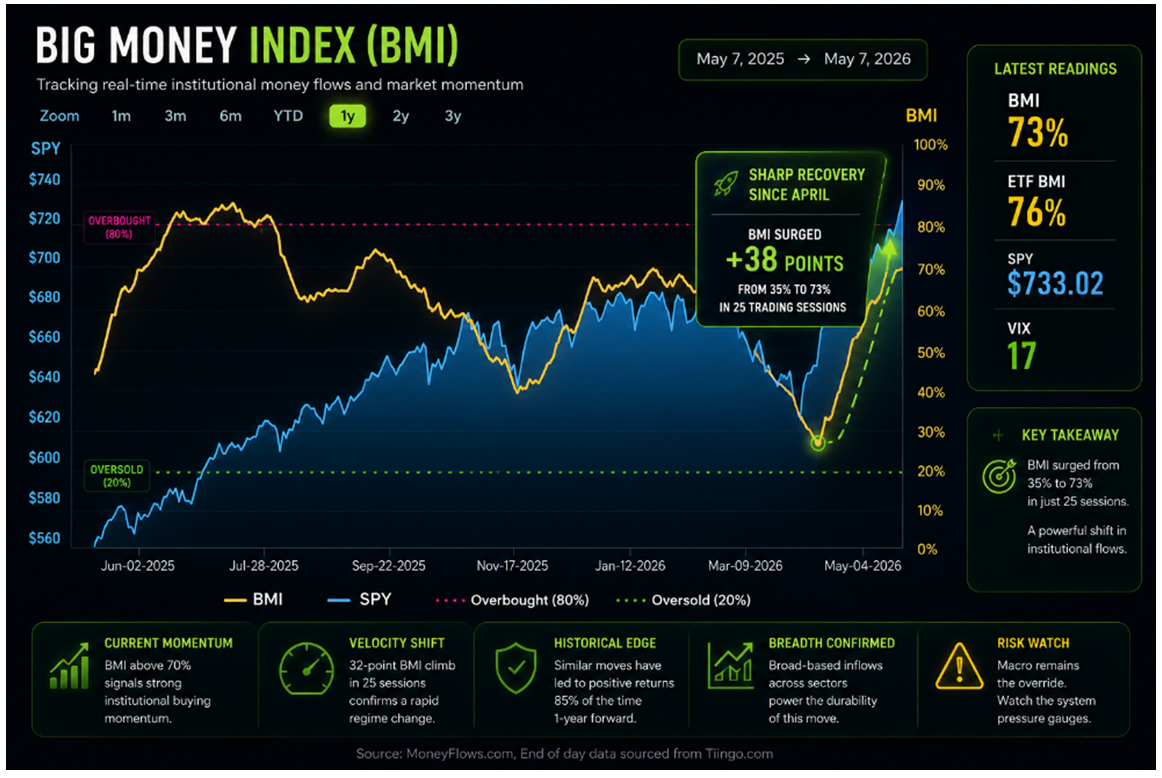
Five weeks ago, the 25-day moving average we call the Big Money Index (BMI) sagged to 41%. The market’s mood was sour, sellers were dominant, outflows were everywhere, and the tape felt like it was bracing for something even worse. Today, the BMI reads 73%. SPY is at all-time highs. The VIX is at 17.
That’s a 32-point climb in the BMI in 25-trading sessions… it feels like a regime change:
Graphs are for illustrative and discussion purposes only. Please read important disclosures at the end of this commentary.
Graphs are for illustrative and discussion purposes only. Please read important disclosures at the end of this commentary.
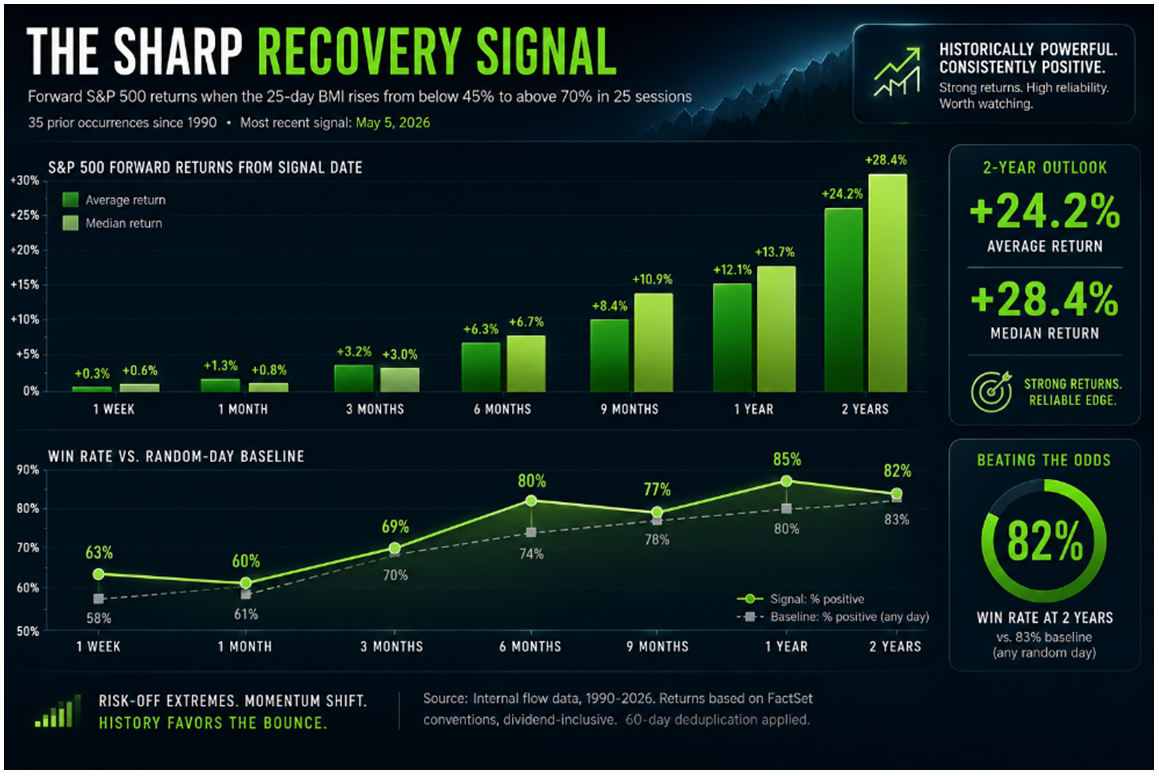
This sudden change made me study what happens when the BMI rises from below 45% to above 70% in a 25-session span. Going back to 1990, this has happened 35-prior times. Here’s what the S&P 500 did next:
- 6-months later, the S&P was positive 80% of the time with a median return of +6.7%
- 1-year later, it was positive 85% of the time, with a median return of +13.7%
- 2-years later, it was positive 82% of the time, with a stunning median return of +28.4%
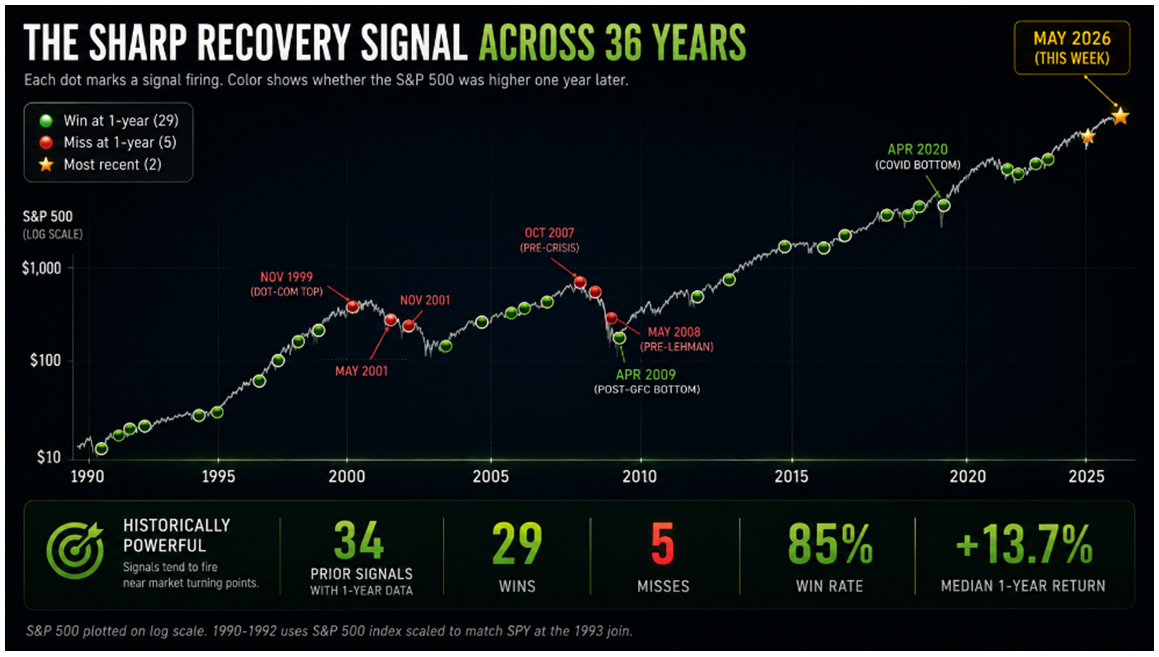
In the 34-prior signals, after one full year, 29 (85%) were higher a year later. Here’s the full data:
Graphs are for illustrative and discussion purposes only. Please read important disclosures at the end of this commentary.
There is no guarantee of a rise this time around, but the five misses make this history interesting. Plotted against three and a half-decades of market history, they cluster in two obvious places:
Graphs are for illustrative and discussion purposes only. Please read important disclosures at the end of this commentary.
Here the previous non-performing periods following the “Sharp Recovery Signal,” all quite long ago;
- November 1999 created a rally during the late dot-com euphoria.
- May and November 2001 fired into a recession that was already underway.
- October 2007 and May 2008 fired in the months before Lehman.
Each miss turned out to be a macro shock, overriding the recovery signal. Meanwhile, the same signal fired at the post-GFC bottom in April 2009 and the COVID bottom in April 2020, and the market recovered quickly. When the macro held, the signal worked. When the macro broke, nothing worked.
Translation: the signal is reliable when the macro is stable. Macro is the override. As long as nothing breaks at the system level, the flow data has historically been right roughly 80% of the time.
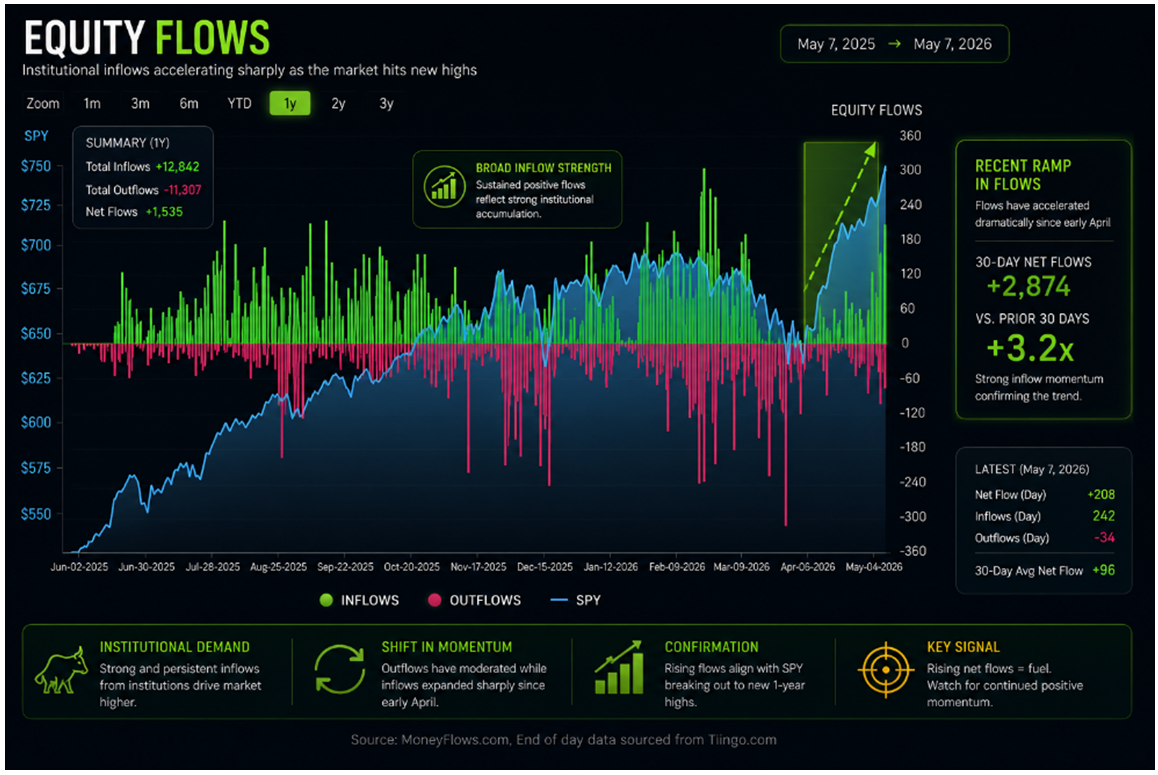
The headline number is one thing. What’s being bought tells you whether this move has staying power, so let’s look at last week’s action. It turns out Wednesday, May 6 was the broadest day of the entire advance, as 221-stocks saw fresh inflows against just 59-outflows. That kind of breadth usually doesn’t come from panic buying. It shows up when institutions reposition entire portfolios.
Real Estate posted the clearest sector dominance last week, with 39-inflows against just two-outflows. Data-center landlords, hotels, apartments and the like all participated. When REITs lead, it’s classic risk-on behavior. Investors want yield and are willing to lean into cyclical exposure to get it.
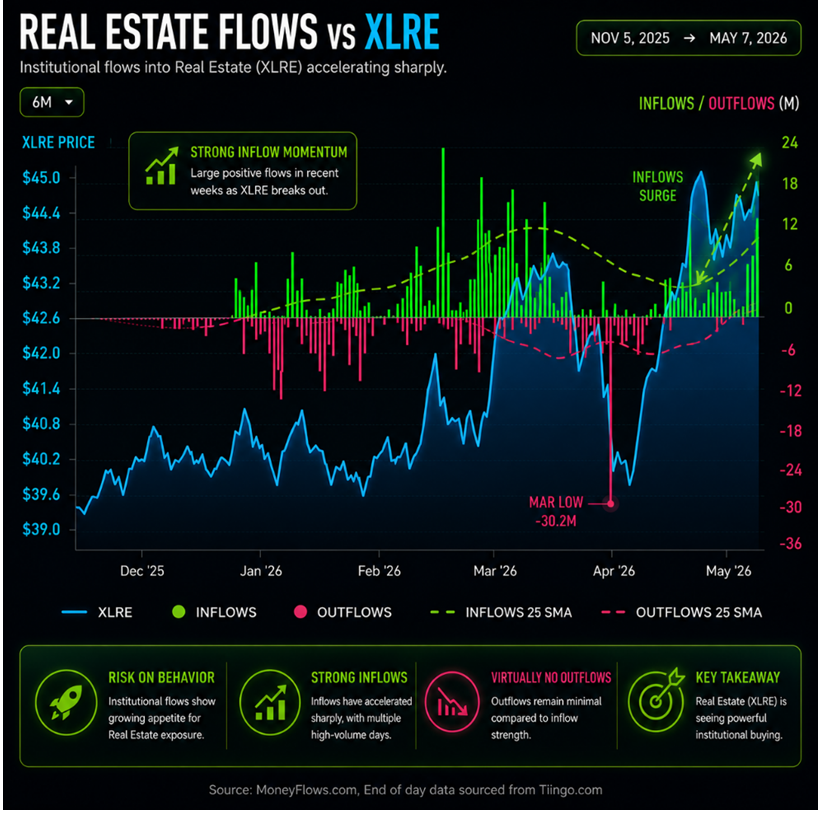
Graphs are for illustrative and discussion purposes only. Please read important disclosures at the end of this commentary.
Financials were the second-cleanest sector with 67-inflows against 14-outflows. Inside that group, a quiet but important rotation took shape. Bitcoin miners were bought, not because crypto suddenly became cool again, but because their power-heavy infrastructure is being repriced as AI compute capacity. The same megawatts that mine digital coins can train models. Markets figured that out before most headlines did.
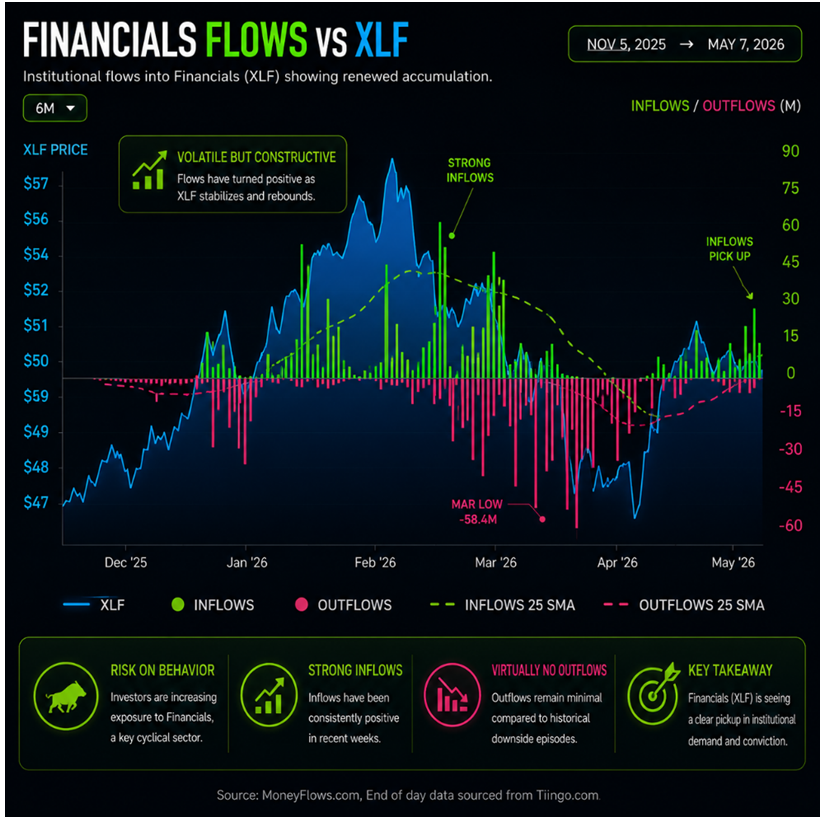
Graphs are for illustrative and discussion purposes only. Please read important disclosures at the end of this commentary.
Technology delivered the deepest signal, with the most inflows: 205-inflows against just 18-outflows.
Memory and storage names appeared repeatedly. Semiconductor packaging equipment quietly led the persistence table. Optical networking confirmed itself as a major flow theme, with one core-photonics name posting inflows every trading day last week.
The bandwidth bottleneck inside AI data-centers is now very real. This is no longer just a GPU story.
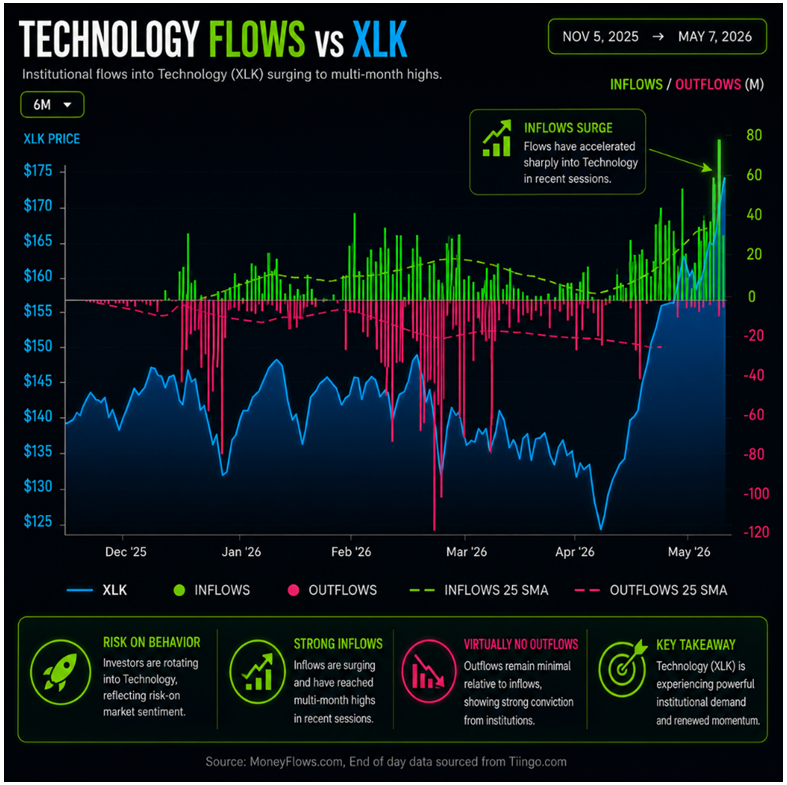
Graphs are for illustrative and discussion purposes only. Please read important disclosures at the end of this commentary.
The most interesting nuance last week came inside the utilities. At first glance, the sector looks weak overall: 15-outflows against five-inflows. But look closer. Names being sold are rate-regulated utilities, while the names being bought are merchant power companies. These are businesses able to strike data-center deals at market rates and directly monetize the surging AI demand.
In short, the market is selling fixed-return power and buying flexible power.
That isn’t just sector rotation. It’s capital anticipating an entirely different demand environment.
OK, What’s Being Sold?
Three patterns dominate the sell list, for the third-straight week.
- IT services and consulting names continue appearing on the outflow list. EPAM Systems posted outflows all four-days. Accenture joined this week as well. The market increasingly views AI as an infrastructure build-out story while implementation services drift toward the disruption bucket.
- Medical devices and diagnostics are also leaking capital. Investors are rotating out of stable health care and into specialty pharma and biotech. That’s a classic risk-on tell even within defensive sectors.
- Consumer staples continue getting sold as well, so money is leaving the safest corners of the market.
In summary, the Sharp Recovery Signal has fired 36-times since 1990. The first year following the event produced an 85% one-year win rate and a median gain of 13.7%. The 36th just arrived. Which direction will we move next? My answer: What’s underneath this move matters as much as the signal itself.
Capital is not buying indiscriminately. It’s choosing merchant power over regulated power, semiconductor equipment over consulting services, AI infrastructure over enterprise software implementation, biotech over defensive healthcare. That discrimination is usually what separates durable advances from reflexes.
The risk remains the same as in every prior Sharp Recovery Signal: Macro is still the ultimate override. If the system breaks at the macro level, the signal breaks with it. Watch the credit spreads. Watch the dollar. Watch oil – three main pressure gauges. Until those start to crack, history says the tape deserves respect.
“The stock market is a device for transferring money from the impatient to the patient.” – Warren Buffett
Buffett was talking about discipline, not speed, but patience cuts both ways. Fighting one of the strongest momentum thrusts in 36-years because it ‘feels’ over-extended has historically been an expensive exercise.
When the market speaks, history says we should listen.
Navellier & Associates; do not own Accenture Plc Class A. (ACN), or EPAM Systems (EPAM), in managed accounts. Jason Bodner does not own positions in Accenture Plc Class A. (ACN), or EPAM Systems (EPAM).
All content above represents the opinion of Jason Bodner of Navellier & Associates, Inc.
Also In This Issue
A Look Ahead by Louis Navellier
Job Growth Exceeds Analyst Expectations
Income Mail by Bryan Perry
The Bullish Outlook for U.S. Energy Infrastructure Strengthens
Growth Mail by Gary Alexander
America is Running Economic Laps Around Europe
Global Mail by Ivan Martchev
Political Considerations Before the Trump-Xi Summit
Sector Spotlight by Jason Bodner
When the Tide Turns This Fast, Pay Attention
View Full Archive
Read Past Issues Here

Jason Bodner
MARKETMAIL EDITOR FOR SECTOR SPOTLIGHT
Jason Bodner writes Sector Spotlight in the weekly Marketmail publication and has authored several white papers for the company. He is also Co-Founder of Macro Analytics for Professionals which produces proprietary equity accumulation and distribution research for its clients. Previously, Mr. Bodner served as Director of European Equity Derivatives for Cantor Fitzgerald Europe in London, then moved to the role of Head of Equity Derivatives North America for the same company in New York. He also served as S.V.P. Equity Derivatives for Jefferies, LLC. He received a B.S. in business administration in 1996, with honors, from Skidmore College as a member of the Periclean Honors Society. All content of “Sector Spotlight” represents the opinion of Jason Bodner
Important Disclosures:
Jason Bodner is a co-founder and co-owner of Mapsignals. Mr. Bodner is an independent contractor who is occasionally hired by Navellier & Associates to write an article and or provide opinions for possible use in articles that appear in Navellier & Associates weekly Market Mail. Mr. Bodner is not employed or affiliated with Louis Navellier, Navellier & Associates, Inc., or any other Navellier owned entity. The opinions and statements made here are those of Mr. Bodner and not necessarily those of any other persons or entities. This is not an endorsement, or solicitation or testimonial or investment advice regarding the BMI Index or any statements or recommendations or analysis in the article or the BMI Index or Mapsignals or its products or strategies.
Although information in these reports has been obtained from and is based upon sources that Navellier believes to be reliable, Navellier does not guarantee its accuracy and it may be incomplete or condensed. All opinions and estimates constitute Navellier’s judgment as of the date the report was created and are subject to change without notice. These reports are for informational purposes only and are not a solicitation for the purchase or sale of a security. Any decision to purchase securities mentioned in these reports must take into account existing public information on such securities or any registered prospectus.To the extent permitted by law, neither Navellier & Associates, Inc., nor any of its affiliates, agents, or service providers assumes any liability or responsibility nor owes any duty of care for any consequences of any person acting or refraining to act in reliance on the information contained in this communication or for any decision based on it.
Past performance is no indication of future results. Investment in securities involves significant risk and has the potential for partial or complete loss of funds invested. It should not be assumed that any securities recommendations made by Navellier. in the future will be profitable or equal the performance of securities made in this report. Dividend payments are not guaranteed. The amount of a dividend payment, if any, can vary over time and issuers may reduce dividends paid on securities in the event of a recession or adverse event affecting a specific industry or issuer.
None of the stock information, data, and company information presented herein constitutes a recommendation by Navellier or a solicitation to buy or sell any securities. Any specific securities identified and described do not represent all of the securities purchased, sold, or recommended for advisory clients. The holdings identified do not represent all of the securities purchased, sold, or recommended for advisory clients and the reader should not assume that investments in the securities identified and discussed were or will be profitable.
Information presented is general information that does not take into account your individual circumstances, financial situation, or needs, nor does it present a personalized recommendation to you. Individual stocks presented may not be suitable for every investor. Investment in securities involves significant risk and has the potential for partial or complete loss of funds invested. Investment in fixed income securities has the potential for the investment return and principal value of an investment to fluctuate so that an investor’s holdings, when redeemed, may be worth less than their original cost.
One cannot invest directly in an index. Index is unmanaged and index performance does not reflect deduction of fees, expenses, or taxes. Presentation of Index data does not reflect a belief by Navellier that any stock index constitutes an investment alternative to any Navellier equity strategy or is necessarily comparable to such strategies. Among the most important differences between the Indices and Navellier strategies are that the Navellier equity strategies may (1) incur material management fees, (2) concentrate its investments in relatively few stocks, industries, or sectors, (3) have significantly greater trading activity and related costs, and (4) be significantly more or less volatile than the Indices.
ETF Risk: We may invest in exchange traded funds (“ETFs”) and some of our investment strategies are generally fully invested in ETFs. Like traditional mutual funds, ETFs charge asset-based fees, but they generally do not charge initial sales charges or redemption fees and investors typically pay only customary brokerage fees to buy and sell ETF shares. The fees and costs charged by ETFs held in client accounts will not be deducted from the compensation the client pays Navellier. ETF prices can fluctuate up or down, and a client account could lose money investing in an ETF if the prices of the securities owned by the ETF go down. ETFs are subject to additional risks:
- ETF shares may trade above or below their net asset value;
- An active trading market for an ETF’s shares may not develop or be maintained;
- The value of an ETF may be more volatile than the underlying portfolio of securities the ETF is designed to track;
- The cost of owning shares of the ETF may exceed those a client would incur by directly investing in the underlying securities and;
- Trading of an ETF’s shares may be halted if the listing exchange’s officials deem it appropriate, the shares are delisted from the exchange, or the activation of market-wide “circuit breakers” (which are tied to large decreases in stock prices) halts stock trading generally.
Grader Disclosures: Investment in equity strategies involves substantial risk and has the potential for partial or complete loss of funds invested. The sample portfolio and any accompanying charts are for informational purposes only and are not to be construed as a solicitation to buy or sell any financial instrument and should not be relied upon as the sole factor in an investment making decision. As a matter of normal and important disclosures to you, as a potential investor, please consider the following: The performance presented is not based on any actual securities trading, portfolio, or accounts, and the reported performance of the A, B, C, D, and F portfolios (collectively the “model portfolios”) should be considered mere “paper” or pro forma performance results based on Navellier’s research.
Investors evaluating any of Navellier & Associates, Inc.’s, (or its affiliates’) Investment Products must not use any information presented here, including the performance figures of the model portfolios, in their evaluation of any Navellier Investment Products. Navellier Investment Products include the firm’s mutual funds and managed accounts. The model portfolios, charts, and other information presented do not represent actual funded trades and are not actual funded portfolios. There are material differences between Navellier Investment Products’ portfolios and the model portfolios, research, and performance figures presented here. The model portfolios and the research results (1) may contain stocks or ETFs that are illiquid and difficult to trade; (2) may contain stock or ETF holdings materially different from actual funded Navellier Investment Product portfolios; (3) include the reinvestment of all dividends and other earnings, estimated trading costs, commissions, or management fees; and, (4) may not reflect prices obtained in an actual funded Navellier Investment Product portfolio. For these and other reasons, the reported performances of model portfolios do not reflect the performance results of Navellier’s actually funded and traded Investment Products. In most cases, Navellier’s Investment Products have materially lower performance results than the performances of the model portfolios presented.
This report contains statements that are, or may be considered to be, forward-looking statements. All statements that are not historical facts, including statements about our beliefs or expectations, are “forward-looking statements” within the meaning of The U.S. Private Securities Litigation Reform Act of 1995. These statements may be identified by such forward-looking terminology as “expect,” “estimate,” “plan,” “intend,” “believe,” “anticipate,” “may,” “will,” “should,” “could,” “continue,” “project,” or similar statements or variations of such terms. Our forward-looking statements are based on a series of expectations, assumptions, and projections, are not guarantees of future results or performance, and involve substantial risks and uncertainty as described in Form ADV Part 2A of our filing with the Securities and Exchange Commission (SEC), which is available at www.adviserinfo.sec.gov or by requesting a copy by emailing info@navellier.com. All of our forward-looking statements are as of the date of this report only. We can give no assurance that such expectations or forward-looking statements will prove to be correct. Actual results may differ materially. You are urged to carefully consider all such factors.
FEDERAL TAX ADVICE DISCLAIMER: As required by U.S. Treasury Regulations, you are informed that, to the extent this presentation includes any federal tax advice, the presentation is not written by Navellier to be used, and cannot be used, for the purpose of avoiding federal tax penalties. Navellier does not advise on any income tax requirements or issues. Use of any information presented by Navellier is for general information only and does not represent tax advice either express or implied. You are encouraged to seek professional tax advice for income tax questions and assistance.
IMPORTANT NEWSLETTER DISCLOSURE:The hypothetical performance results for investment newsletters that are authored or edited by Louis Navellier, including Louis Navellier’s Growth Investor, Louis Navellier’s Breakthrough Stocks, Louis Navellier’s Accelerated Profits, and Louis Navellier’s Platinum Club, are not based on any actual securities trading, portfolio, or accounts, and the newsletters’ reported hypothetical performances should be considered mere “paper” or proforma hypothetical performance results and are not actual performance of real world trades. Navellier & Associates, Inc. does not have any relation to or affiliation with the owner of these newsletters. There are material differences between Navellier Investment Products’ portfolios and the InvestorPlace Media, LLC newsletter portfolios authored by Louis Navellier. The InvestorPlace Media, LLC newsletters contain hypothetical performance that do not include transaction costs, advisory fees, or other fees a client might incur if actual investments and trades were being made by an investor. As a result, newsletter performance should not be used to evaluate Navellier Investment services which are separate and different from the newsletters. The owner of the newsletters is InvestorPlace Media, LLC and any questions concerning the newsletters, including any newsletter advertising or hypothetical Newsletter performance claims, (which are calculated solely by Investor Place Media and not Navellier) should be referred to InvestorPlace Media, LLC at (800) 718-8289.
Please note that Navellier & Associates and the Navellier Private Client Group are managed completely independent of the newsletters owned and published by InvestorPlace Media, LLC and written and edited by Louis Navellier, and investment performance of the newsletters should in no way be considered indicative of potential future investment performance for any Navellier & Associates separately managed account portfolio. Potential investors should consult with their financial advisor before investing in any Navellier Investment Product.
Navellier claims compliance with Global Investment Performance Standards (GIPS). To receive a complete list and descriptions of Navellier’s composites and/or a presentation that adheres to the GIPS standards, please contact Navellier or click here. It should not be assumed that any securities recommendations made by Navellier & Associates, Inc. in the future will be profitable or equal the performance of securities made in this report.
FactSet Disclosure: Navellier does not independently calculate the statistical information included in the attached report. The calculation and the information are provided by FactSet, a company not related to Navellier. Although information contained in the report has been obtained from FactSet and is based on sources Navellier believes to be reliable, Navellier does not guarantee its accuracy, and it may be incomplete or condensed. The report and the related FactSet sourced information are provided on an “as is” basis. The user assumes the entire risk of any use made of this information. Investors should consider the report as only a single factor in making their investment decision. The report is for informational purposes only and is not intended as an offer or solicitation for the purchase or sale of a security. FactSet sourced information is the exclusive property of FactSet. Without prior written permission of FactSet, this information may not be reproduced, disseminated or used to create any financial products. All indices are unmanaged and performance of the indices include reinvestment of dividends and interest income, unless otherwise noted, are not illustrative of any particular investment and an investment cannot be made in any index. Past performance is no guarantee of future results.