by Jason Bodner
June 4, 2024
It’s June. Summer is here, or at least very near. It’s time for a little Beach Boys’ “Good Vibrations.”
A very close friend, “Jerry,” changed my life. Meeting him, I was struck by his happiness and focus. He had control of his life: he worked out, was successful, and was completely balanced. Knowing several people in common, one day someone’s name came up and I innocently said: “He’s a good dude.”
Jerry said: “Interesting… I think he’s a total zero.”
I was shocked at how cold that sounded, but Jerry explained that this person exhibited negative energy and offered little towards Jerry’s personal growth. Then he dropped the bomb on me: “I only associate with people who demonstrate qualities that are positive in my life. All others – I have no time for.”
That sounded arrogant at first, but suddenly it was obvious, and practical: Surround yourself with the best people and positive people, and your life will be better. Jerry’s concept was that trying to be everyone’s friend was a fool’s errand. Instead, I should only focus on surrounding myself with positive influences.
Scientifically, Jerry was right. You’ve heard that laughter is contagious. Well, so are negative emotions. Various studies validate this. The National Institute of Health says: Social interactions can trigger emotional contagion between individuals resulting in behavioral synchronicity. This is used every day by businesses – to grab your attention – for marketing, news, “click bait,” ads – to make you buy something.
It doesn’t take much to start a negative mind-state. In the last week, my New York Rangers lost three straight games and are out of the Stanley Cup playoffs. The same week, some stocks I own or recommend were hit hard. When that happens, I notice that I’m suddenly drawn to negative news and commentary.
Objectively, these bad vibes validate my feelings, and they also keep my spirits down. That lets my emotions creep in. Looking at the data, however, brings back sanity. Let’s see what the data says now:
What’s in the Market “Vibes” Lately?
The market has hit some turbulence. Last week saw the most unusually large selling since late October:
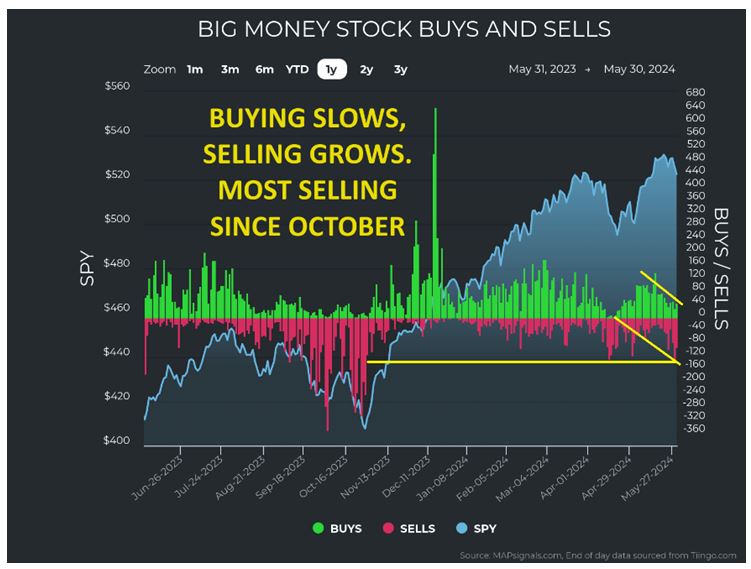
Graphs are for illustrative and discussion purposes only. Please read important disclosures at the end of this commentary.
Some sobering economic news, and key companies issuing weak guidance kindled the fire of selling. Interestingly, the top three strongest sectors mimic (or drive) this pattern. Here we see sector ranks:
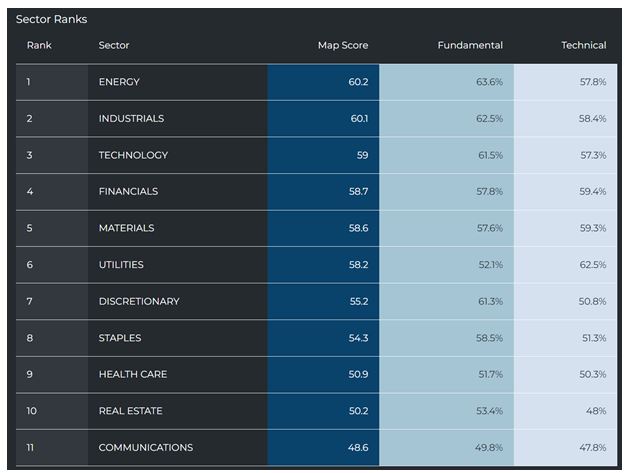
Graphs are for illustrative and discussion purposes only. Please read important disclosures at the end of this commentary.
Charts of unusual buying and selling by sector clearly show similarities to the broader market. Energy saw the most selling since January. Industrials, and Technology saw the most selling since October:
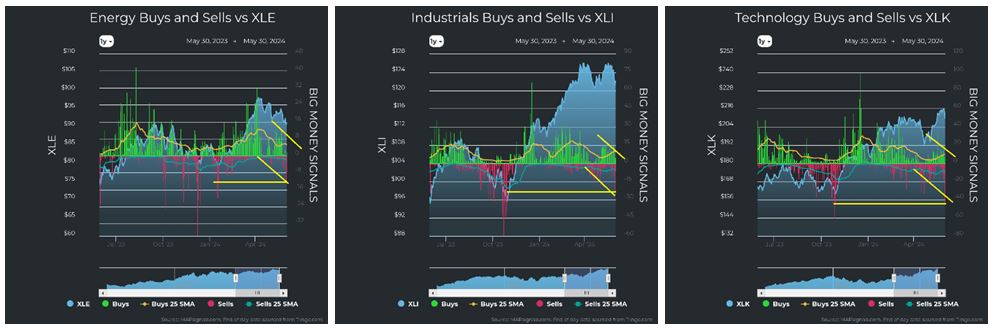
Graphs are for illustrative and discussion purposes only. Please read important disclosures at the end of this commentary.
Financials, Materials, and Utilities were quiet, only displaying slower buying – not elevated selling:
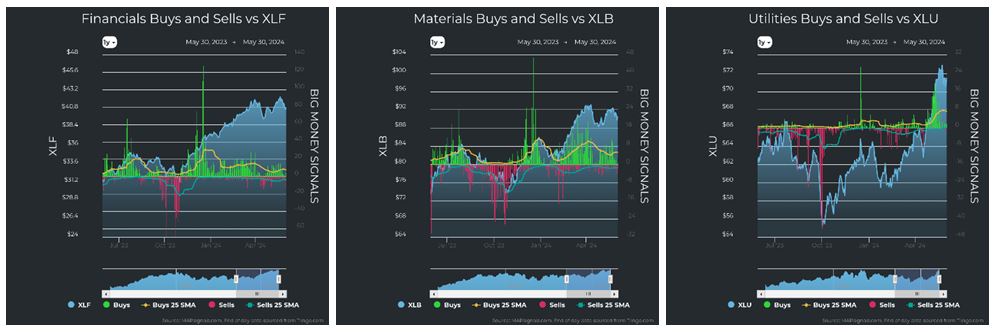
Graphs are for illustrative and discussion purposes only. Please read important disclosures at the end of this commentary.
Discretionary saw the most selling since October. Staples and Health Care saw slowing buying and growing selling:
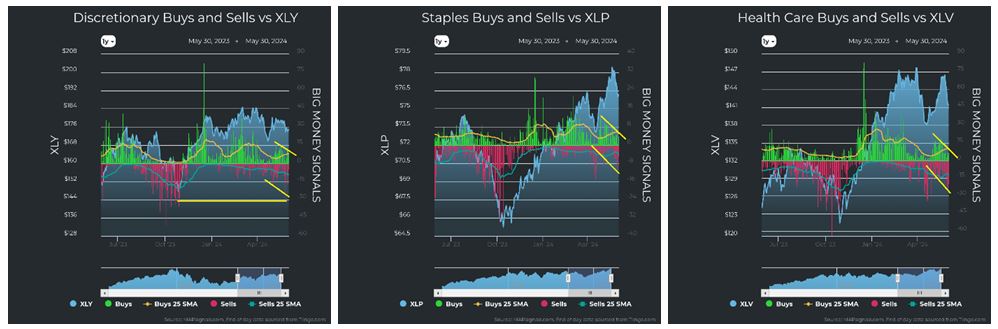
Graphs are for illustrative and discussion purposes only. Please read important disclosures at the end of this commentary.
There was nothing much to report in Real Estate and Communications:
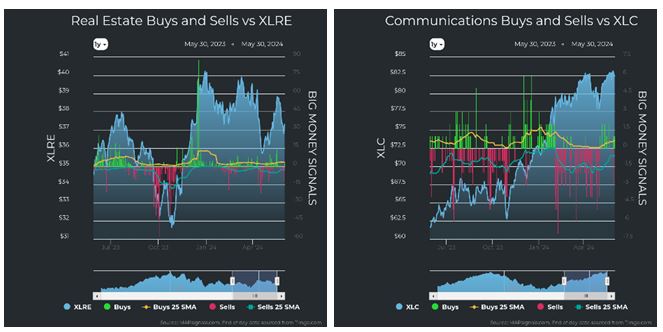
Graphs are for illustrative and discussion purposes only. Please read important disclosures at the end of this commentary.
Last week saw selling in small-caps and mid-caps. Some large caps were also sold.
Look how last week (left) compares to the first three weeks of May (right):
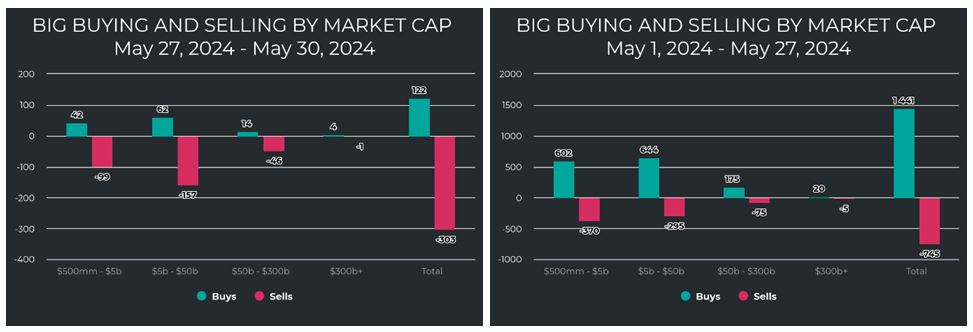
Graphs are for illustrative and discussion purposes only. Please read important disclosures at the end of this commentary.
All these pockets of selling pressure caused a sudden drop in the Big Money Index (BMI):
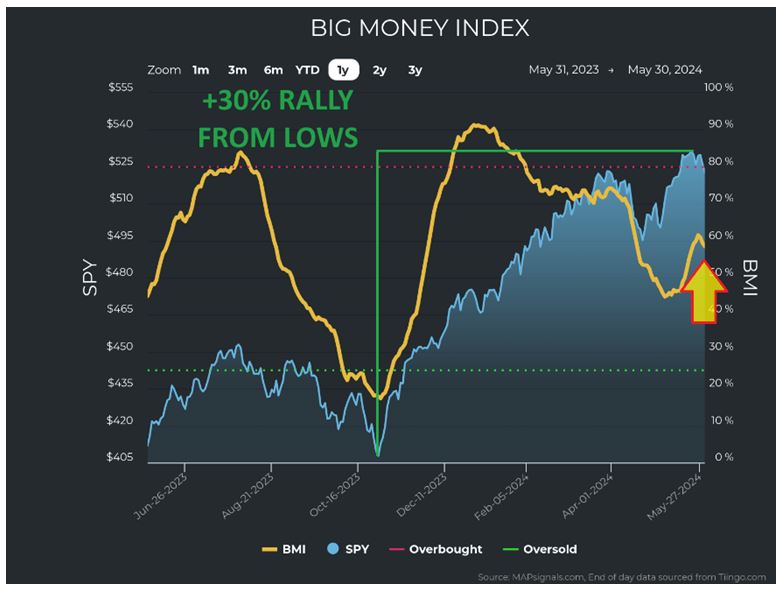
Graphs are for illustrative and discussion purposes only. Please read important disclosures at the end of this commentary.
It’s too early to tell if this begins a new trend, or if this is just an air pocket. Some bellwether tech stocks are disappointing in their earnings and guidance. Heck, even Michael Jordan missed some free-throws! I chalk this up to doldrums more than a true reversal of trends for these businesses. Logically, humankind will always need more new and faster technology. On this oversimplified basis alone, I am not worried.
So. now that we have our negative emotions in check, let’s take objective stock…
The greed emotion says we all want stocks to rise forever. We know that the fastest point from A to B is a straight line, but when it comes to stocks, we seldom see a rocket’s glide path upward. It helps to look at prices over time. For instance, April was an uncomfortable month for stocks, however the S&P 500 hit all-time highs in May after its 30% peak rally from October lows. So now that we’ve arrived in June, what should we expect? Let’s look at some seasonal phenomena to get a clearer picture.
First, we visit our chart of monthly returns for the four main indexes since 1990. It tells us plainly that we should expect a mixed June, a July bump, and then a typically sloppy August and September:
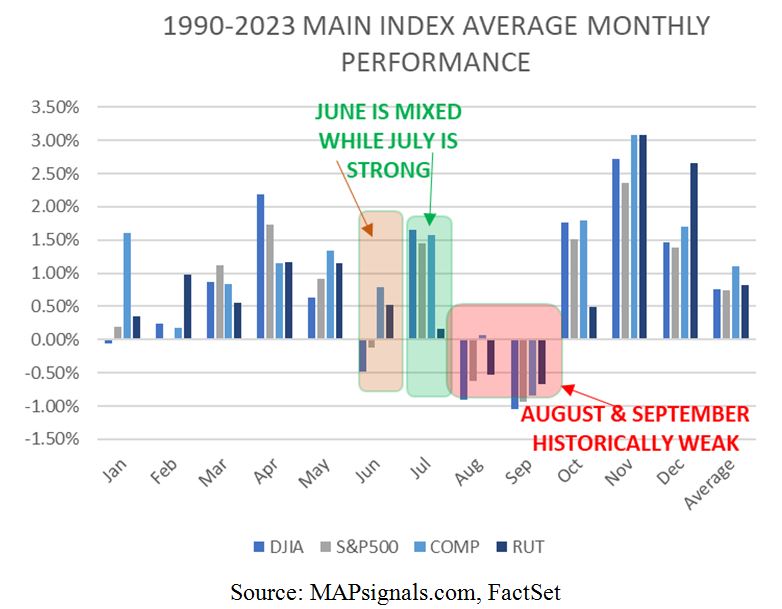
Graphs are for illustrative and discussion purposes only. Please read important disclosures at the end of this commentary.
That chart also clearly tells us that, historically speaking since 1990, we should gear up for a great fourth quarter through the next year’s 1st quarter. We know that things don’t always work out the way they should. Last week brought some unpleasant volatility spawned by the above earnings volatility, some downward revisions to GDP, and more war rhetoric, but still the S&P 500 rose 4.8% in May 2024.
Below I looked at unusual buying and selling the past few months. The column on the right shows the ratio of buying to selling each month since last October’s market lows. That is, hypothetically, if six stocks were bought and four were sold, then the ratio is 60% buys. We find that despite this bump in selling and a weak week to end the month, May 2024 still saw 60% buying on average.
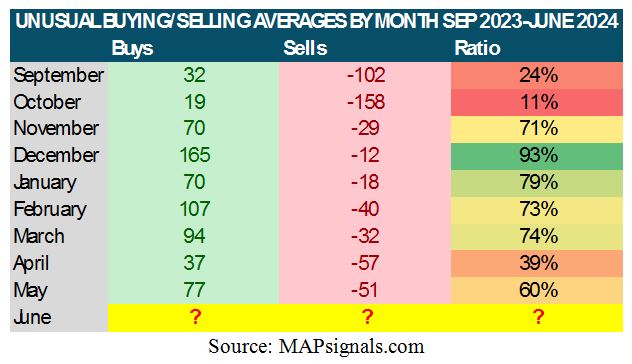
Graphs are for illustrative and discussion purposes only. Please read important disclosures at the end of this commentary.
So how does that compare with history? I looked at the average monthly buying and selling of stocks and ETFs since 1990. It’s fascinating to see how we are right on schedule compared to historical averages. It’s like you can see the market breathing: Green, breathe-in; red. breathe-out. May typically sees 56% buys.
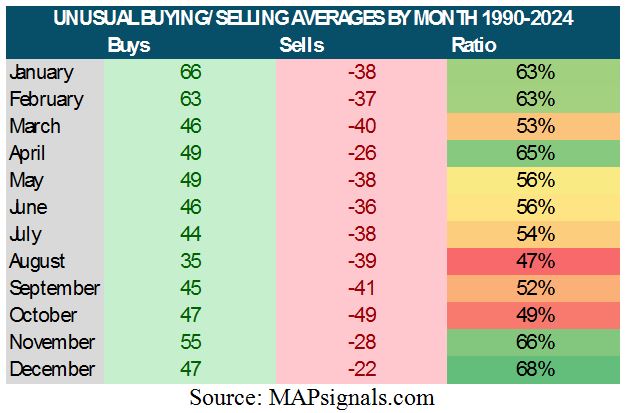
Graphs are for illustrative and discussion purposes only. Please read important disclosures at the end of this commentary.
This past April was a clear departure from the norm, but that’s to be expected over a 34-year data set. Remember what I said above: we should expect a mixed June, a July bump, and then a typically sloppy August and September. But also remember that the BMI fell for more than 10 consecutive days in April. The important thing here is that when that happened, forward returns were just great historically speaking:
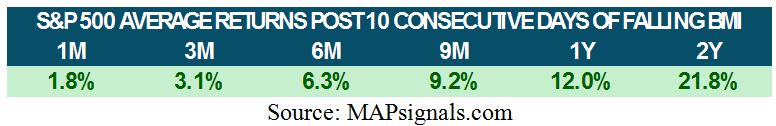
Graphs are for illustrative and discussion purposes only. Please read important disclosures at the end of this commentary.
Don’t cave into emotional contagion and fall into behavioral synchrony. Keep a cool head and embrace the expected summer volatility. It’s on schedule. It’s what normally happens. Summer volatility, like summer storms, are normal. But remember this seasonal quote: “Rain reminds all things to grow.”
All content above represents the opinion of Jason Bodner of Navellier & Associates, Inc.
Also In This Issue
A Look Ahead by Louis Navellier
Are We Flirting with World War III While Over-Focusing on Politics?
Income Mail by Bryan Perry
The PCE Data Shows the First Signs of Inflation Cooling
Growth Mail by Gary Alexander
America’s New D-Day: The Day Debt Doubled Growth
Global Mail by Ivan Martchev
The Reversal of the Reversal
Sector Spotlight by Jason Bodner
It’s June. Time For Some “Good Vibrations”
View Full Archive
Read Past Issues Here

Jason Bodner
MARKETMAIL EDITOR FOR SECTOR SPOTLIGHT
Jason Bodner writes Sector Spotlight in the weekly Marketmail publication and has authored several white papers for the company. He is also Co-Founder of Macro Analytics for Professionals which produces proprietary equity accumulation/distribution research for its clients. Previously, Mr. Bodner served as Director of European Equity Derivatives for Cantor Fitzgerald Europe in London, then moved to the role of Head of Equity Derivatives North America for the same company in New York. He also served as S.V.P. Equity Derivatives for Jefferies, LLC. He received a B.S. in business administration in 1996, with honors, from Skidmore College as a member of the Periclean Honors Society. All content of “Sector Spotlight” represents the opinion of Jason Bodner
Important Disclosures:
Jason Bodner is a co-founder and co-owner of Mapsignals. Mr. Bodner is an independent contractor who is occasionally hired by Navellier & Associates to write an article and or provide opinions for possible use in articles that appear in Navellier & Associates weekly Market Mail. Mr. Bodner is not employed or affiliated with Louis Navellier, Navellier & Associates, Inc., or any other Navellier owned entity. The opinions and statements made here are those of Mr. Bodner and not necessarily those of any other persons or entities. This is not an endorsement, or solicitation or testimonial or investment advice regarding the BMI Index or any statements or recommendations or analysis in the article or the BMI Index or Mapsignals or its products or strategies.
Although information in these reports has been obtained from and is based upon sources that Navellier believes to be reliable, Navellier does not guarantee its accuracy and it may be incomplete or condensed. All opinions and estimates constitute Navellier’s judgment as of the date the report was created and are subject to change without notice. These reports are for informational purposes only and are not a solicitation for the purchase or sale of a security. Any decision to purchase securities mentioned in these reports must take into account existing public information on such securities or any registered prospectus.To the extent permitted by law, neither Navellier & Associates, Inc., nor any of its affiliates, agents, or service providers assumes any liability or responsibility nor owes any duty of care for any consequences of any person acting or refraining to act in reliance on the information contained in this communication or for any decision based on it.
Past performance is no indication of future results. Investment in securities involves significant risk and has the potential for partial or complete loss of funds invested. It should not be assumed that any securities recommendations made by Navellier. in the future will be profitable or equal the performance of securities made in this report. Dividend payments are not guaranteed. The amount of a dividend payment, if any, can vary over time and issuers may reduce dividends paid on securities in the event of a recession or adverse event affecting a specific industry or issuer.
None of the stock information, data, and company information presented herein constitutes a recommendation by Navellier or a solicitation to buy or sell any securities. Any specific securities identified and described do not represent all of the securities purchased, sold, or recommended for advisory clients. The holdings identified do not represent all of the securities purchased, sold, or recommended for advisory clients and the reader should not assume that investments in the securities identified and discussed were or will be profitable.
Information presented is general information that does not take into account your individual circumstances, financial situation, or needs, nor does it present a personalized recommendation to you. Individual stocks presented may not be suitable for every investor. Investment in securities involves significant risk and has the potential for partial or complete loss of funds invested. Investment in fixed income securities has the potential for the investment return and principal value of an investment to fluctuate so that an investor’s holdings, when redeemed, may be worth less than their original cost.
One cannot invest directly in an index. Index is unmanaged and index performance does not reflect deduction of fees, expenses, or taxes. Presentation of Index data does not reflect a belief by Navellier that any stock index constitutes an investment alternative to any Navellier equity strategy or is necessarily comparable to such strategies. Among the most important differences between the Indices and Navellier strategies are that the Navellier equity strategies may (1) incur material management fees, (2) concentrate its investments in relatively few stocks, industries, or sectors, (3) have significantly greater trading activity and related costs, and (4) be significantly more or less volatile than the Indices.
ETF Risk: We may invest in exchange traded funds (“ETFs”) and some of our investment strategies are generally fully invested in ETFs. Like traditional mutual funds, ETFs charge asset-based fees, but they generally do not charge initial sales charges or redemption fees and investors typically pay only customary brokerage fees to buy and sell ETF shares. The fees and costs charged by ETFs held in client accounts will not be deducted from the compensation the client pays Navellier. ETF prices can fluctuate up or down, and a client account could lose money investing in an ETF if the prices of the securities owned by the ETF go down. ETFs are subject to additional risks:
- ETF shares may trade above or below their net asset value;
- An active trading market for an ETF’s shares may not develop or be maintained;
- The value of an ETF may be more volatile than the underlying portfolio of securities the ETF is designed to track;
- The cost of owning shares of the ETF may exceed those a client would incur by directly investing in the underlying securities; and
- Trading of an ETF’s shares may be halted if the listing exchange’s officials deem it appropriate, the shares are delisted from the exchange, or the activation of market-wide “circuit breakers” (which are tied to large decreases in stock prices) halts stock trading generally.
Grader Disclosures: Investment in equity strategies involves substantial risk and has the potential for partial or complete loss of funds invested. The sample portfolio and any accompanying charts are for informational purposes only and are not to be construed as a solicitation to buy or sell any financial instrument and should not be relied upon as the sole factor in an investment making decision. As a matter of normal and important disclosures to you, as a potential investor, please consider the following: The performance presented is not based on any actual securities trading, portfolio, or accounts, and the reported performance of the A, B, C, D, and F portfolios (collectively the “model portfolios”) should be considered mere “paper” or pro forma performance results based on Navellier’s research.
Investors evaluating any of Navellier & Associates, Inc.’s, (or its affiliates’) Investment Products must not use any information presented here, including the performance figures of the model portfolios, in their evaluation of any Navellier Investment Products. Navellier Investment Products include the firm’s mutual funds and managed accounts. The model portfolios, charts, and other information presented do not represent actual funded trades and are not actual funded portfolios. There are material differences between Navellier Investment Products’ portfolios and the model portfolios, research, and performance figures presented here. The model portfolios and the research results (1) may contain stocks or ETFs that are illiquid and difficult to trade; (2) may contain stock or ETF holdings materially different from actual funded Navellier Investment Product portfolios; (3) include the reinvestment of all dividends and other earnings, estimated trading costs, commissions, or management fees; and, (4) may not reflect prices obtained in an actual funded Navellier Investment Product portfolio. For these and other reasons, the reported performances of model portfolios do not reflect the performance results of Navellier’s actually funded and traded Investment Products. In most cases, Navellier’s Investment Products have materially lower performance results than the performances of the model portfolios presented.
This report contains statements that are, or may be considered to be, forward-looking statements. All statements that are not historical facts, including statements about our beliefs or expectations, are “forward-looking statements” within the meaning of The U.S. Private Securities Litigation Reform Act of 1995. These statements may be identified by such forward-looking terminology as “expect,” “estimate,” “plan,” “intend,” “believe,” “anticipate,” “may,” “will,” “should,” “could,” “continue,” “project,” or similar statements or variations of such terms. Our forward-looking statements are based on a series of expectations, assumptions, and projections, are not guarantees of future results or performance, and involve substantial risks and uncertainty as described in Form ADV Part 2A of our filing with the Securities and Exchange Commission (SEC), which is available at www.adviserinfo.sec.gov or by requesting a copy by emailing info@navellier.com. All of our forward-looking statements are as of the date of this report only. We can give no assurance that such expectations or forward-looking statements will prove to be correct. Actual results may differ materially. You are urged to carefully consider all such factors.
FEDERAL TAX ADVICE DISCLAIMER: As required by U.S. Treasury Regulations, you are informed that, to the extent this presentation includes any federal tax advice, the presentation is not written by Navellier to be used, and cannot be used, for the purpose of avoiding federal tax penalties. Navellier does not advise on any income tax requirements or issues. Use of any information presented by Navellier is for general information only and does not represent tax advice either express or implied. You are encouraged to seek professional tax advice for income tax questions and assistance.
IMPORTANT NEWSLETTER DISCLOSURE:The hypothetical performance results for investment newsletters that are authored or edited by Louis Navellier, including Louis Navellier’s Growth Investor, Louis Navellier’s Breakthrough Stocks, Louis Navellier’s Accelerated Profits, and Louis Navellier’s Platinum Club, are not based on any actual securities trading, portfolio, or accounts, and the newsletters’ reported hypothetical performances should be considered mere “paper” or proforma hypothetical performance results and are not actual performance of real world trades. Navellier & Associates, Inc. does not have any relation to or affiliation with the owner of these newsletters. There are material differences between Navellier Investment Products’ portfolios and the InvestorPlace Media, LLC newsletter portfolios authored by Louis Navellier. The InvestorPlace Media, LLC newsletters contain hypothetical performance that do not include transaction costs, advisory fees, or other fees a client might incur if actual investments and trades were being made by an investor. As a result, newsletter performance should not be used to evaluate Navellier Investment services which are separate and different from the newsletters. The owner of the newsletters is InvestorPlace Media, LLC and any questions concerning the newsletters, including any newsletter advertising or hypothetical Newsletter performance claims, (which are calculated solely by Investor Place Media and not Navellier) should be referred to InvestorPlace Media, LLC at (800) 718-8289.
Please note that Navellier & Associates and the Navellier Private Client Group are managed completely independent of the newsletters owned and published by InvestorPlace Media, LLC and written and edited by Louis Navellier, and investment performance of the newsletters should in no way be considered indicative of potential future investment performance for any Navellier & Associates separately managed account portfolio. Potential investors should consult with their financial advisor before investing in any Navellier Investment Product.
Navellier claims compliance with Global Investment Performance Standards (GIPS). To receive a complete list and descriptions of Navellier’s composites and/or a presentation that adheres to the GIPS standards, please contact Navellier or click here. It should not be assumed that any securities recommendations made by Navellier & Associates, Inc. in the future will be profitable or equal the performance of securities made in this report.
FactSet Disclosure: Navellier does not independently calculate the statistical information included in the attached report. The calculation and the information are provided by FactSet, a company not related to Navellier. Although information contained in the report has been obtained from FactSet and is based on sources Navellier believes to be reliable, Navellier does not guarantee its accuracy, and it may be incomplete or condensed. The report and the related FactSet sourced information are provided on an “as is” basis. The user assumes the entire risk of any use made of this information. Investors should consider the report as only a single factor in making their investment decision. The report is for informational purposes only and is not intended as an offer or solicitation for the purchase or sale of a security. FactSet sourced information is the exclusive property of FactSet. Without prior written permission of FactSet, this information may not be reproduced, disseminated or used to create any financial products. All indices are unmanaged and performance of the indices include reinvestment of dividends and interest income, unless otherwise noted, are not illustrative of any particular investment and an investment cannot be made in any index. Past performance is no guarantee of future results.