by Gary Alexander
June 4, 2024
This week we celebrate the 80th anniversary of D-Day, June 6, 1944, by honoring those few remaining heroes that survived that harrowing day on the beaches of Normandy. As this is a financial newsletter, we’ll also mark a different birthday, a month later, of the postwar planning session in Bretton Woods, New Hampshire, July 1-22, which set the framework for the remarkable success of the postwar era.
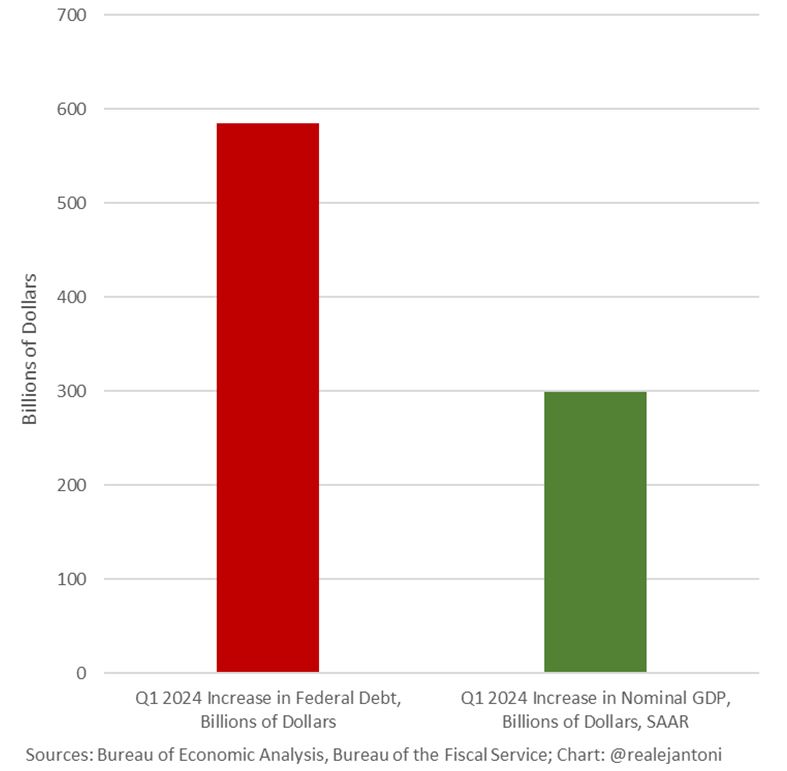
Last Thursday also marked a dour D-Day, when we learned that federal debt in the first quarter grew twice as fast as our economy – nearly $600 billion in federal red ink vs. $300 billion in nominal GDP growth. More on that in a minute, but first let me share the good news about how we did it right in 1944.
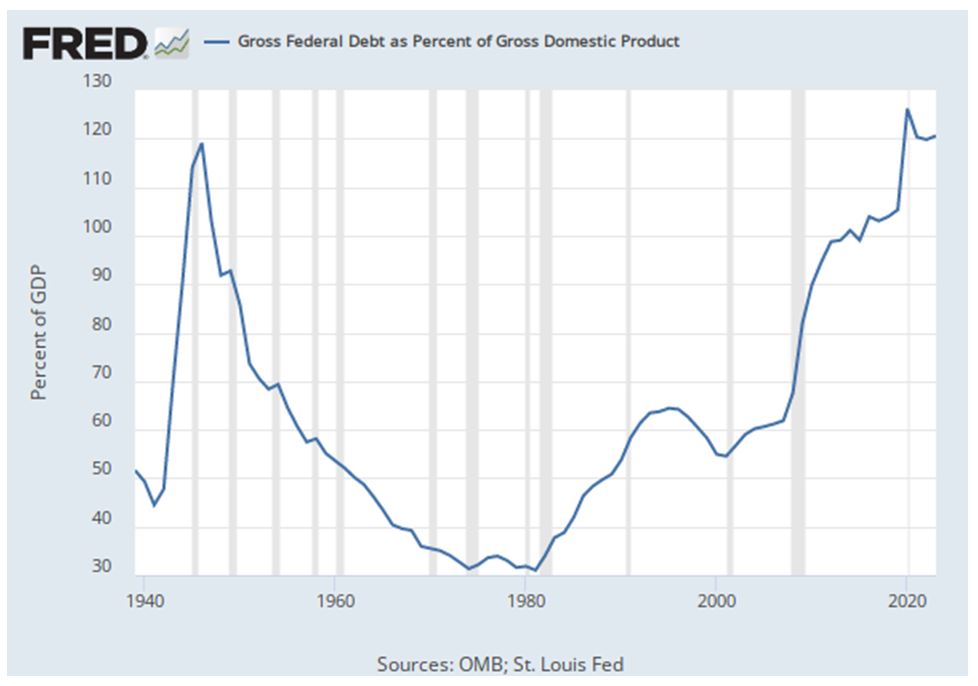
At the close of World War II, the U.S. had accumulated an unconscionable level of debt to fight the largest war ever, on two fronts, starting with a weak economy after 12 years of a Great Depression and a depleted military. America’s gross debt as a percent of GDP shot up from 45% in 1941 to nearly 120% at the end of World War II, with inflation soaring and a near certainty of a new Depression, as 12 million soldiers returned home to fewer jobs in a debt-plus-inflation-ridden economy – just like after WWI.
But none of that happened, as inflation was throttled and only minor, short recessions happened later on. Good jobs (or college, via the GI Bill) welcomed our soldiers, plus new homes for their Baby Boom kids and balanced budgets with growth to cut the debt-to-GDP in half by the late 1950s, all because of the wisdom of those who remembered their mistakes of 1919 – notably British economist John Maynard Keynes, who was present at Versailles and wrote “The Economic Consequences of the Peace” in 1919.
So, let us first honor the birthday tomorrow of John Maynard Keynes, born June 5, 1883, in Cambridge. Although he died shortly after the war, in 1946, his primary contribution at Bretton Woods was arguing against stiff war reparations on Germany or Japan. Bretton Woods gave immediate birth to the U.S. dollar standard, the World Bank and the International Monetary Fund (IMF), and the spirit of Bretton Woods begat the Marshall Plan and rebuilding Japan (instead of punitive war reparations) and GATT’s free trade.
Graphs are for illustrative and discussion purposes only. Please read important disclosures at the end of this commentary.
As this chart shows, America started overspending again in the 1980s, then briefly balanced budgets from 1998 to 2001, then it was off to the races with average trillion-dollar-a-year deficits since 2002.
Now, here’s the bad news about our new D-Day, released last week, May 30th: America’s first-quarter GDP was marked down to +1.3% last Thursday, from the +1.6% originally reported, but that’s not the most important metric. At the same time, first-quarter federal debt grew twice as fast as nominal GDP (that is, in current dollars, without inflation subtracted). The economy grew by $300 billion last quarter, but the national debt increased by nearly $600 billion, an annual rate of $2.3 trillion, near COVID levels.
Graphs are for illustrative and discussion purposes only. Please read important disclosures at the end of this commentary.
This means our debt-to-GDP ratio will start to rise again, after dipping briefly after COVID spending.
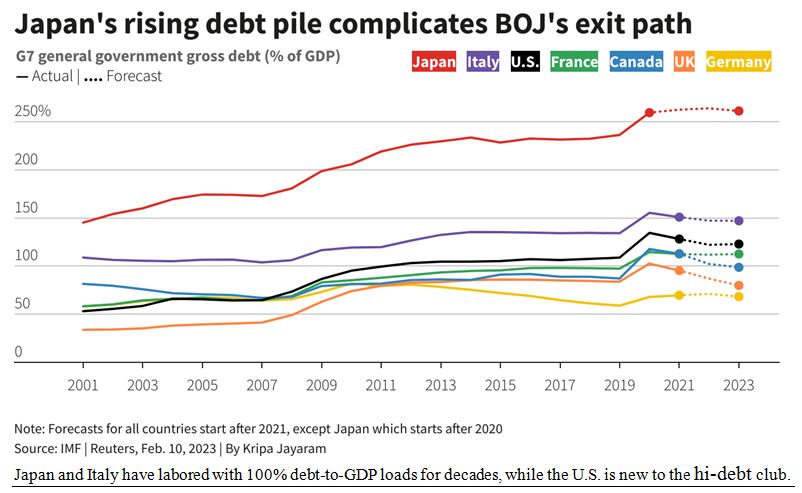
Are We in Danger of Going the Way of Japan — or Italy?
Only two developed nations today have a greater debt-to-GDP ratio than the U.S. has now – Japan (at a lofty 262%) and Italy (at 138%). The U.S. stands at around 120%, with a few Euro-zone nations slightly behind us (France, Spain and Portugal, at around 112%), but those three nations have their budget deficits reasonably in control, compared to America, so we seem to have the bronze medal for debt all locked up.
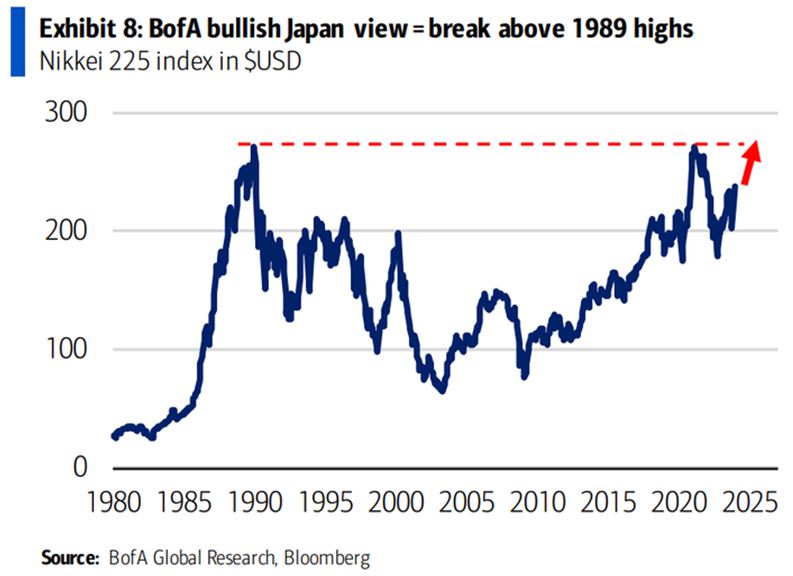
The financial report cards for Japan and Italy are not good. According to the current edition of The Economist, Japan’s latest quarterly GDP growth rate is an annualized negative -2%, its budget deficit this year is -4.8% of GDP, and its yen is down 11.5% to the dollar so far this year. In addition, Japan’s stock market index, though up recently, took over 30 years to climb back to its previous all-time high in 1989 – much longer than the 25 years it took the Dow to recover from its similar 1929 bubble peak – in 1954.
Graphs are for illustrative and discussion purposes only. Please read important disclosures at the end of this commentary.
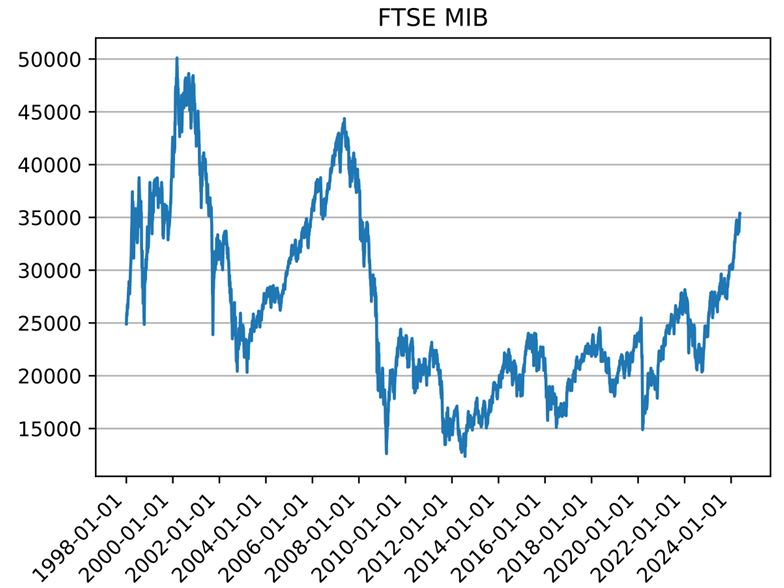
Italy has a similar death-warmed-over economic report card. Its GDP is up an anemic 0.6% year-over-year, its current budget deficit is -5.4% of GDP, and it sports a jobless rate of 7.2%. Its stock market index, the FTSE MIB, is down about 30% from its 2001 peak. Italian governments are historically known for their corruption, while the people mirror their leaders, often working “off the books” to avoid taxes.
Graphs are for illustrative and discussion purposes only. Please read important disclosures at the end of this commentary.
There is hope for recovery. Japan and Italy have labored under a 100% debt-to-GDP burden for several decades, while America just entered the triple-digit debt club in the last five years of COVID spending for benefits far and above families impacted by the pandemic. We are currently “pre-diabetic” debtors and can reverse the disease, but we must act fast to cut the carbs and sweets from our budgetary binges.
Graphs are for illustrative and discussion purposes only. Please read important disclosures at the end of this commentary.
If we don’t bring debt-to-GDP back under 100% this decade, we could go the deflationary route of Japan or the inflationary route of Italy, but it would be slow growth either way, and dismal stock market gains.
Wise up voters, and Congress. This is a key decision year for our future, our D-Day Debt Decision year.
Today in Military History Takes No Back Seat to D-Day
June 4th in 1944 was a Sunday, and nobody wanted to fight on the Lord’s Day, so the Normandy landing was slated for early Monday, June 5, but weather prevented the invasion then, so June 6 became D-Day.
However, today is the anniversary of several important events during the Second World War – a long list:
June 4th marked (1) the final evacuation of Allied forces from Dunkirk in 1940; (2) the Battle of Midway in 1942; (3) the liberation of Rome in 1944, and (4) the occupation of Okinawa in 1945.
In late May 1940, the British were trapped at Dunkirk with their back to the sea, with little chance of breaking out, but most were evacuated by a great flotilla of fishing boats, lifeboats and pleasure yachts. Then, in the Battle of Midway (1942), the Japanese fleet outnumbered the U.S., so they forced a showdown by dispatching four heavy aircraft carriers to occupy Midway, north of Hawaii. But the U.S. cracked their naval code and were ready. U.S. planes sank all four Japanese carriers in the first U.S. victory of the war. Two years later, Allied troops entered Rome, and on June 4, 1945, in celebrations dwarfed by D-Day. Then, the 6th Marine division occupied Orokoe Peninsula, Okinawa, at great cost.
A lot of other military events happened on June 4th
1805: The Barbary War ended in Tripoli, recalling a line in the Marine hymn: To the Shores of Tripoli.
1859: The French under Napoleon III beat the Austrians in the Battle of Magenta, Italy.
1917: The U.S. draft began, for service in the “Great War,” World War I.
1919: U.S. Marines attacked Costa Rica, while President Wilson was in Versailles.
1924: An Eternal Light was dedicated at Madison Square in New York City, to honor WWI veterans.
1967: The Six Day War began on June 5, in Israel.
1989: The Tiananmen Square riots took place in China, known there as “the June 4th incident” (on the same day the Ayatollah Khomeini died), 35 years ago today.
So, happy D-Day Celebrations…but also, “May June the 4th be with you” today.
All content above represents the opinion of Gary Alexander of Navellier & Associates, Inc.
Also In This Issue
A Look Ahead by Louis Navellier
Are We Flirting with World War III While Over-Focusing on Politics?
Income Mail by Bryan Perry
The PCE Data Shows the First Signs of Inflation Cooling
Growth Mail by Gary Alexander
America’s New D-Day: The Day Debt Doubled Growth
Global Mail by Ivan Martchev
The Reversal of the Reversal
Sector Spotlight by Jason Bodner
It’s June. Time For Some “Good Vibrations”
View Full Archive
Read Past Issues Here
About The Author

Gary Alexander
SENIOR EDITOR
Gary Alexander has been Senior Writer at Navellier since 2009. He edits Navellier’s weekly Marketmail and writes a weekly Growth Mail column, in which he uses market history to support the case for growth stocks. For the previous 20 years before joining Navellier, he was Senior Executive Editor at InvestorPlace Media (formerly Phillips Publishing), where he worked with several leading investment analysts, including Louis Navellier (since 1997), helping launch Louis Navellier’s Blue Chip Growth and Global Growth newsletters.
Prior to that, Gary edited Wealth Magazine and Gold Newsletter and wrote various investment research reports for Jefferson Financial in New Orleans in the 1980s. He began his financial newsletter career with KCI Communications in 1980, where he served as consulting editor for Personal Finance newsletter while serving as general manager of KCI’s Alexandria House book division. Before that, he covered the economics beat for news magazines. All content of “Growth Mail” represents the opinion of Gary Alexander
Important Disclosures:
Although information in these reports has been obtained from and is based upon sources that Navellier believes to be reliable, Navellier does not guarantee its accuracy and it may be incomplete or condensed. All opinions and estimates constitute Navellier’s judgment as of the date the report was created and are subject to change without notice. These reports are for informational purposes only and are not a solicitation for the purchase or sale of a security. Any decision to purchase securities mentioned in these reports must take into account existing public information on such securities or any registered prospectus.To the extent permitted by law, neither Navellier & Associates, Inc., nor any of its affiliates, agents, or service providers assumes any liability or responsibility nor owes any duty of care for any consequences of any person acting or refraining to act in reliance on the information contained in this communication or for any decision based on it.
Past performance is no indication of future results. Investment in securities involves significant risk and has the potential for partial or complete loss of funds invested. It should not be assumed that any securities recommendations made by Navellier. in the future will be profitable or equal the performance of securities made in this report. Dividend payments are not guaranteed. The amount of a dividend payment, if any, can vary over time and issuers may reduce dividends paid on securities in the event of a recession or adverse event affecting a specific industry or issuer.
None of the stock information, data, and company information presented herein constitutes a recommendation by Navellier or a solicitation to buy or sell any securities. Any specific securities identified and described do not represent all of the securities purchased, sold, or recommended for advisory clients. The holdings identified do not represent all of the securities purchased, sold, or recommended for advisory clients and the reader should not assume that investments in the securities identified and discussed were or will be profitable.
Information presented is general information that does not take into account your individual circumstances, financial situation, or needs, nor does it present a personalized recommendation to you. Individual stocks presented may not be suitable for every investor. Investment in securities involves significant risk and has the potential for partial or complete loss of funds invested. Investment in fixed income securities has the potential for the investment return and principal value of an investment to fluctuate so that an investor’s holdings, when redeemed, may be worth less than their original cost.
One cannot invest directly in an index. Index is unmanaged and index performance does not reflect deduction of fees, expenses, or taxes. Presentation of Index data does not reflect a belief by Navellier that any stock index constitutes an investment alternative to any Navellier equity strategy or is necessarily comparable to such strategies. Among the most important differences between the Indices and Navellier strategies are that the Navellier equity strategies may (1) incur material management fees, (2) concentrate its investments in relatively few stocks, industries, or sectors, (3) have significantly greater trading activity and related costs, and (4) be significantly more or less volatile than the Indices.
ETF Risk: We may invest in exchange traded funds (“ETFs”) and some of our investment strategies are generally fully invested in ETFs. Like traditional mutual funds, ETFs charge asset-based fees, but they generally do not charge initial sales charges or redemption fees and investors typically pay only customary brokerage fees to buy and sell ETF shares. The fees and costs charged by ETFs held in client accounts will not be deducted from the compensation the client pays Navellier. ETF prices can fluctuate up or down, and a client account could lose money investing in an ETF if the prices of the securities owned by the ETF go down. ETFs are subject to additional risks:
- ETF shares may trade above or below their net asset value;
- An active trading market for an ETF’s shares may not develop or be maintained;
- The value of an ETF may be more volatile than the underlying portfolio of securities the ETF is designed to track;
- The cost of owning shares of the ETF may exceed those a client would incur by directly investing in the underlying securities; and
- Trading of an ETF’s shares may be halted if the listing exchange’s officials deem it appropriate, the shares are delisted from the exchange, or the activation of market-wide “circuit breakers” (which are tied to large decreases in stock prices) halts stock trading generally.
Grader Disclosures: Investment in equity strategies involves substantial risk and has the potential for partial or complete loss of funds invested. The sample portfolio and any accompanying charts are for informational purposes only and are not to be construed as a solicitation to buy or sell any financial instrument and should not be relied upon as the sole factor in an investment making decision. As a matter of normal and important disclosures to you, as a potential investor, please consider the following: The performance presented is not based on any actual securities trading, portfolio, or accounts, and the reported performance of the A, B, C, D, and F portfolios (collectively the “model portfolios”) should be considered mere “paper” or pro forma performance results based on Navellier’s research.
Investors evaluating any of Navellier & Associates, Inc.’s, (or its affiliates’) Investment Products must not use any information presented here, including the performance figures of the model portfolios, in their evaluation of any Navellier Investment Products. Navellier Investment Products include the firm’s mutual funds and managed accounts. The model portfolios, charts, and other information presented do not represent actual funded trades and are not actual funded portfolios. There are material differences between Navellier Investment Products’ portfolios and the model portfolios, research, and performance figures presented here. The model portfolios and the research results (1) may contain stocks or ETFs that are illiquid and difficult to trade; (2) may contain stock or ETF holdings materially different from actual funded Navellier Investment Product portfolios; (3) include the reinvestment of all dividends and other earnings, estimated trading costs, commissions, or management fees; and, (4) may not reflect prices obtained in an actual funded Navellier Investment Product portfolio. For these and other reasons, the reported performances of model portfolios do not reflect the performance results of Navellier’s actually funded and traded Investment Products. In most cases, Navellier’s Investment Products have materially lower performance results than the performances of the model portfolios presented.
This report contains statements that are, or may be considered to be, forward-looking statements. All statements that are not historical facts, including statements about our beliefs or expectations, are “forward-looking statements” within the meaning of The U.S. Private Securities Litigation Reform Act of 1995. These statements may be identified by such forward-looking terminology as “expect,” “estimate,” “plan,” “intend,” “believe,” “anticipate,” “may,” “will,” “should,” “could,” “continue,” “project,” or similar statements or variations of such terms. Our forward-looking statements are based on a series of expectations, assumptions, and projections, are not guarantees of future results or performance, and involve substantial risks and uncertainty as described in Form ADV Part 2A of our filing with the Securities and Exchange Commission (SEC), which is available at www.adviserinfo.sec.gov or by requesting a copy by emailing info@navellier.com. All of our forward-looking statements are as of the date of this report only. We can give no assurance that such expectations or forward-looking statements will prove to be correct. Actual results may differ materially. You are urged to carefully consider all such factors.
FEDERAL TAX ADVICE DISCLAIMER: As required by U.S. Treasury Regulations, you are informed that, to the extent this presentation includes any federal tax advice, the presentation is not written by Navellier to be used, and cannot be used, for the purpose of avoiding federal tax penalties. Navellier does not advise on any income tax requirements or issues. Use of any information presented by Navellier is for general information only and does not represent tax advice either express or implied. You are encouraged to seek professional tax advice for income tax questions and assistance.
IMPORTANT NEWSLETTER DISCLOSURE:The hypothetical performance results for investment newsletters that are authored or edited by Louis Navellier, including Louis Navellier’s Growth Investor, Louis Navellier’s Breakthrough Stocks, Louis Navellier’s Accelerated Profits, and Louis Navellier’s Platinum Club, are not based on any actual securities trading, portfolio, or accounts, and the newsletters’ reported hypothetical performances should be considered mere “paper” or proforma hypothetical performance results and are not actual performance of real world trades. Navellier & Associates, Inc. does not have any relation to or affiliation with the owner of these newsletters. There are material differences between Navellier Investment Products’ portfolios and the InvestorPlace Media, LLC newsletter portfolios authored by Louis Navellier. The InvestorPlace Media, LLC newsletters contain hypothetical performance that do not include transaction costs, advisory fees, or other fees a client might incur if actual investments and trades were being made by an investor. As a result, newsletter performance should not be used to evaluate Navellier Investment services which are separate and different from the newsletters. The owner of the newsletters is InvestorPlace Media, LLC and any questions concerning the newsletters, including any newsletter advertising or hypothetical Newsletter performance claims, (which are calculated solely by Investor Place Media and not Navellier) should be referred to InvestorPlace Media, LLC at (800) 718-8289.
Please note that Navellier & Associates and the Navellier Private Client Group are managed completely independent of the newsletters owned and published by InvestorPlace Media, LLC and written and edited by Louis Navellier, and investment performance of the newsletters should in no way be considered indicative of potential future investment performance for any Navellier & Associates separately managed account portfolio. Potential investors should consult with their financial advisor before investing in any Navellier Investment Product.
Navellier claims compliance with Global Investment Performance Standards (GIPS). To receive a complete list and descriptions of Navellier’s composites and/or a presentation that adheres to the GIPS standards, please contact Navellier or click here. It should not be assumed that any securities recommendations made by Navellier & Associates, Inc. in the future will be profitable or equal the performance of securities made in this report.
FactSet Disclosure: Navellier does not independently calculate the statistical information included in the attached report. The calculation and the information are provided by FactSet, a company not related to Navellier. Although information contained in the report has been obtained from FactSet and is based on sources Navellier believes to be reliable, Navellier does not guarantee its accuracy, and it may be incomplete or condensed. The report and the related FactSet sourced information are provided on an “as is” basis. The user assumes the entire risk of any use made of this information. Investors should consider the report as only a single factor in making their investment decision. The report is for informational purposes only and is not intended as an offer or solicitation for the purchase or sale of a security. FactSet sourced information is the exclusive property of FactSet. Without prior written permission of FactSet, this information may not be reproduced, disseminated or used to create any financial products. All indices are unmanaged and performance of the indices include reinvestment of dividends and interest income, unless otherwise noted, are not illustrative of any particular investment and an investment cannot be made in any index. Past performance is no guarantee of future results.