
by Jason Bodner
September 9, 2026
““Give me a lever long enough, and a fulcrum on which to place it, and I shall move the world.”
— Archimedes
Archimedes was describing a law of physics, but he was also describing the political calculus of midterm election years. In this case, oil is the lever, and the Strait of Hormuz is the fulcrum. Shipments of oil through the Strait impact the price of oil going into the November elections that could “move the world.”
This same calculus impacts market volatility, and it may also be creating the incentive to resolve it.
As September begins, midterm election anxiety is rising. Bond yields are elevated. Oil is above $90. Some growth stocks are getting hit. Investors who felt comfortable in June suddenly are now uneasy.
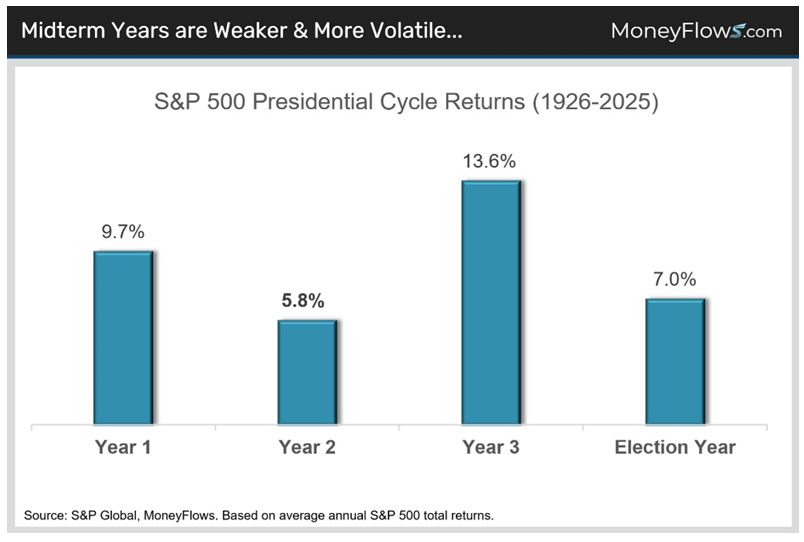
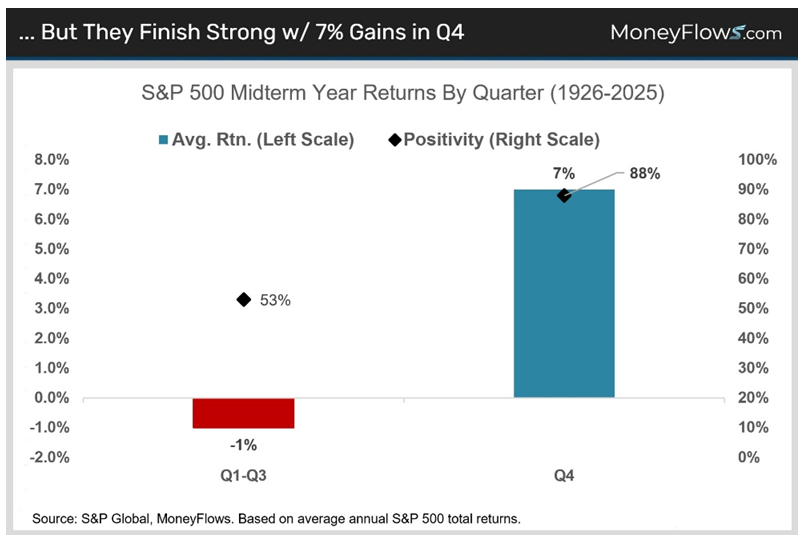
None of this should be surprising. Midterm election years are the weakest of the four-year presidential cycle, averaging 5.8% returns since 1926 with average intra-year drawdowns of 16%. But this is a story of two-markets: The first nine months average in midterm years sees declines of about 1% as uncertainty builds, but then the market takes off like a rocket from late October to the middle of the next year.
Graphs are for illustrative and discussion purposes only. Please read important disclosures at the end of this commentary.
Midterm election years have averaged a phenomenal 7% gain in Q4 with an 88% positive rate, soaring on schedule once the pre-election uncertainty fades. Since 1950, the S&P 500 has averaged a 36% one-year forward return from its midterm-year lows. The current choppiness is the price of admission.
Graphs are for illustrative and discussion purposes only. Please read important disclosures at the end of this commentary.
Fear Rules…Until Certainty Returns
Here is how the fear mechanism works. The Strait of Hormuz handles roughly one-fifth of global oil trade. Disrupt that flow and oil rises. Gasoline follows. Headline inflation rises. Bond investors demand higher yields. The Fed feels pressure even though monetary policy cannot produce a single barrel of oil.
Higher yields pressure growth stocks because future earnings get discounted at a higher rate. This week the 30-year Treasury hit 5.34%, its highest level since 2007. Japan’s 10-year bond touched a 30-year high. UK gilt yields hit their highest level since 1998. But fear works both ways. If Hormuz normalizes, oil falls, inflation fears ease and long-end yields can compress. Secretary Bessent can then accelerate Treasury buybacks, adding more downward pressure. The unwind could be as fast as the build-up.
President Trump does not want his midterm legacy to be losing the Senate and possibly the House, creating a lame-duck two-year halt to his controversial Presidency. But resolving Hormuz removes the oil shock, cools inflation fears and gives the bond market room to breathe before November.
The Venezuelan deal announced earlier this year, securing a 35% equity stake in 65 billion barrels of reserves, suggests the strategic chessboard was already being set before Iran escalated.
What the Data Says Now
Last Tuesday (September 1) was the week’s most instructive session, with 45-inflows and 133-outflows on some real volume. The 1-day ratio of 25.3% inflows was the lowest since the Aschenbrenner blow-up.
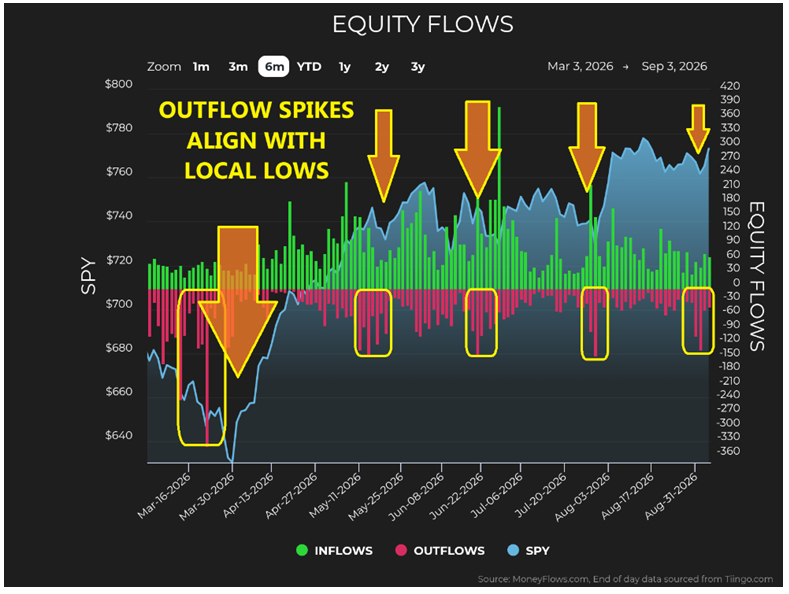
Context matters. In March, rising outflow caused a collapsing Big Money Index (BMI), from 65% to 42% in three-weeks, and each spike brought more selling. Then March 20 brought capitulation, with 337-outflows, the biggest selling day of 2026, marking the exact low. A month later the S&P 500 was up 9%.
Tuesday wasn’t like last March. The BMI was 66%. At these levels, outflow spikes historically look more like selling exhaustion than something worse. Here’s how outflows aligned with troughs since March:
Graphs are for illustrative and discussion purposes only. Please read important disclosures at the end of this commentary.
The market is rotating, not divesting. Wednesday and Thursday supported that view. Buyers returned, the NASDAQ gained 1.4% on Thursday, and the BMI stabilized above 66%.
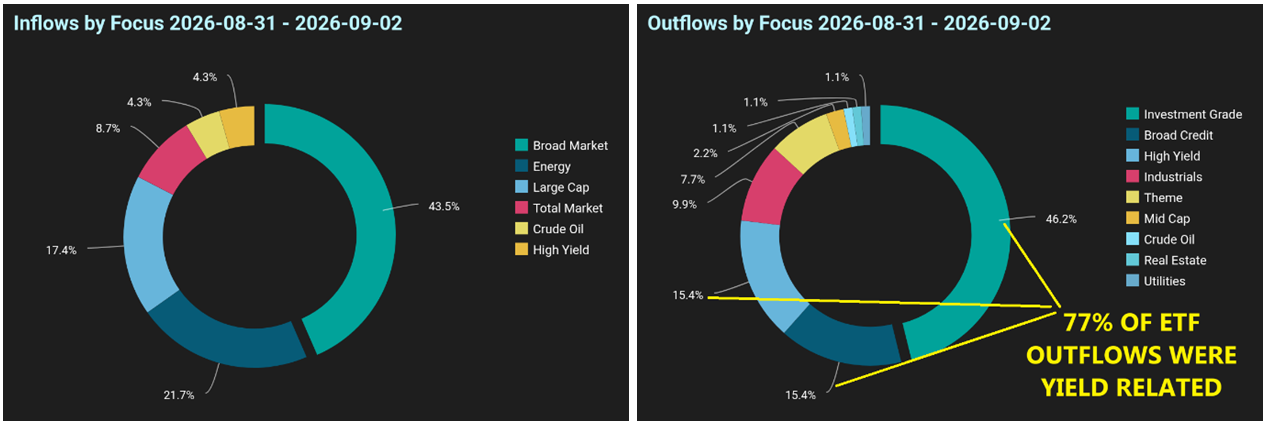
ETF flows tell the rotation story. Commodity ETFs dominated inflows across crude oil, agriculture and natural gas. Tuesday also saw 48-bond ETFs register outflows across maturities, credit qualities and geographies. Over three-days there were 70-bond ETF outflows involving 51-unique funds.
Graphs are for illustrative and discussion purposes only. Please read important disclosures at the end of this commentary.
To me, that looks less like rotation and more like a washout. In stocks, extreme outflows have repeatedly marked local troughs – just like March 20th. The same logic may apply here. When virtually every corner of fixed income gets sold at once, a lot of the sellers who wanted out may have just gotten out.
Sector flows confirmed the repositioning. Energy led at 52-net inflows, its strongest reading in months. Healthcare extended its streak to eleven-straight weeks of net inflows at plus 29. Technology stayed positive at plus 7. Selling concentrated in Industrials at minus 62, Discretionary at minus 53 and Real Estate at minus 32, exactly the rate-sensitive and cyclical areas taking the brunt of higher yields.
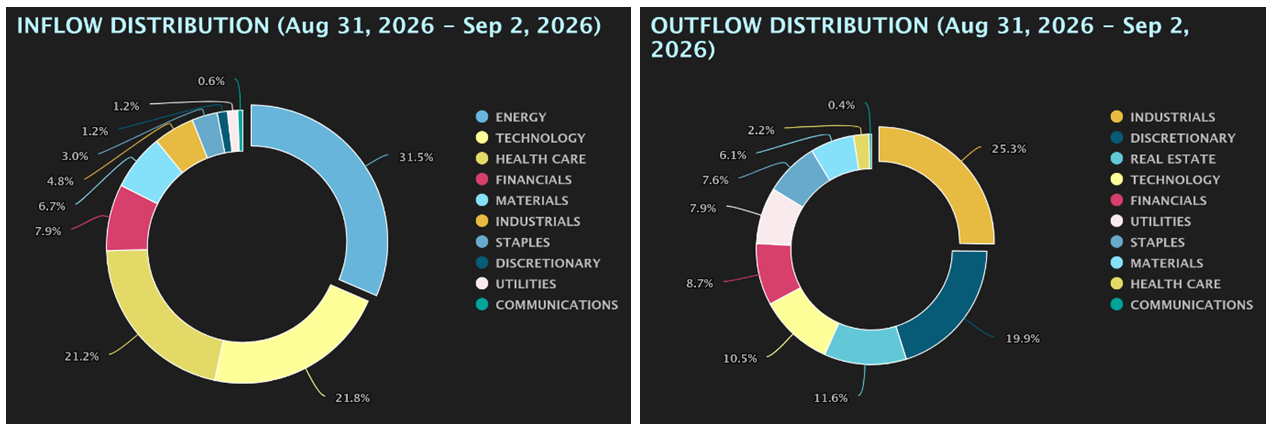
Graphs are for illustrative and discussion purposes only. Please read important disclosures at the end of this commentary.
If Hormuz normalizes and the oil shock fades, those areas can reprice themselves very quickly.
The Earnings Backdrop
Friday’s jobs report added to the puzzle. The economy added 162,000 jobs in August, nearly triple the expectations, but consider that 42,000 jobs came from public education, reversing July’s 45,000 decline. Still, the message is clear: The economy is stronger than expected, even with rising oil prices and rates.
Corporate America says the same thing. With 97% of S&P 500 companies reported, 86% beat earnings estimates and 77% beat revenue estimates. Blended earnings growth exceeded 52%, the highest growth rate since Q2 2021 and more than double the 23.1% expected at the end of quarter, on June 30, 2026.
Ten of 11-sectors beat earnings expectations. Net profit margins hit a record. For Q3, positive guidance is running nearly 2-to-1 over negative guidance. And the forward P/E is 19.6, below the five-year average of 19.9. In other words, businesses are producing record earnings while the market has gotten cheaper.
The AI buildout has not changed, either. Nvidia CEO Jensen Huang forecast 70% revenue growth for fiscal 2028, while the other big firms that control more than 90% of global DRAM all warned of supply shortages through 2028, so the outlook for the businesses hasn’t changed. The narrative has.
Volatile Septembers in midterm years always feel uncomfortable. They also end. November and December of midterm years are historically among the strongest months of the four-year presidential cycle. This time, the calendar and the political incentives may be pointing in the same direction.
The lever works both ways. The fulcrum hasn’t moved, but the applied force is about to change direction.
As the Tao Te Ching says, the nature of things is to cycle. Any direction that looks permanent rarely is.
All content above represents the opinion of Jason Bodner of Navellier & Associates, Inc.
Also In This Issue
A Look Ahead by Louis Navellier
Friday’s Jobs Report and Other Indicators Look Strong
Income Mail by Bryan Perry
The Opponents of Data Centers Just Don’t Get It
Growth Mail by Gary Alexander
What Happened to America’s Work Ethic?
Global Mail by Ivan Martchev
The President is on a Collision Course with the Fed
Sector Spotlight by Jason Bodner
Applying Leverage to the Upcoming Elections
View Full Archive
Read Past Issues Here

Jason Bodner
MARKETMAIL EDITOR FOR SECTOR SPOTLIGHT
Jason Bodner writes Sector Spotlight in the weekly Marketmail publication and has authored several white papers for the company. He is also Co-Founder of Macro Analytics for Professionals which produces proprietary equity accumulation and distribution research for its clients. Previously, Mr. Bodner served as Director of European Equity Derivatives for Cantor Fitzgerald Europe in London, then moved to the role of Head of Equity Derivatives North America for the same company in New York. He also served as S.V.P. Equity Derivatives for Jefferies, LLC. He received a B.S. in business administration in 1996, with honors, from Skidmore College as a member of the Periclean Honors Society. All content of “Sector Spotlight” represents the opinion of Jason Bodner
Important Disclosures:
Jason Bodner is a co-founder and co-owner of Mapsignals. Mr. Bodner is an independent contractor who is occasionally hired by Navellier & Associates to write an article and or provide opinions for possible use in articles that appear in Navellier & Associates weekly Market Mail. Mr. Bodner is not employed or affiliated with Louis Navellier, Navellier & Associates, Inc., or any other Navellier owned entity. The opinions and statements made here are those of Mr. Bodner and not necessarily those of any other persons or entities. This is not an endorsement, or solicitation or testimonial or investment advice regarding the BMI Index or any statements or recommendations or analysis in the article or the BMI Index or Mapsignals or its products or strategies.
Although information in these reports has been obtained from and is based upon sources that Navellier believes to be reliable, Navellier does not guarantee its accuracy and it may be incomplete or condensed. All opinions and estimates constitute Navellier’s judgment as of the date the report was created and are subject to change without notice. These reports are for informational purposes only and are not a solicitation for the purchase or sale of a security. Any decision to purchase securities mentioned in these reports must take into account existing public information on such securities or any registered prospectus.To the extent permitted by law, neither Navellier & Associates, Inc., nor any of its affiliates, agents, or service providers assumes any liability or responsibility nor owes any duty of care for any consequences of any person acting or refraining to act in reliance on the information contained in this communication or for any decision based on it.
Past performance is no indication of future results. Investment in securities involves significant risk and has the potential for partial or complete loss of funds invested. It should not be assumed that any securities recommendations made by Navellier. in the future will be profitable or equal the performance of securities made in this report. Dividend payments are not guaranteed. The amount of a dividend payment, if any, can vary over time and issuers may reduce dividends paid on securities in the event of a recession or adverse event affecting a specific industry or issuer.
None of the stock information, data, and company information presented herein constitutes a recommendation by Navellier or a solicitation to buy or sell any securities. Any specific securities identified and described do not represent all of the securities purchased, sold, or recommended for advisory clients. The holdings identified do not represent all of the securities purchased, sold, or recommended for advisory clients and the reader should not assume that investments in the securities identified and discussed were or will be profitable.
Information presented is general information that does not take into account your individual circumstances, financial situation, or needs, nor does it present a personalized recommendation to you. Individual stocks presented may not be suitable for every investor. Investment in securities involves significant risk and has the potential for partial or complete loss of funds invested. Investment in fixed income securities has the potential for the investment return and principal value of an investment to fluctuate so that an investor’s holdings, when redeemed, may be worth less than their original cost.
One cannot invest directly in an index. Index is unmanaged and index performance does not reflect deduction of fees, expenses, or taxes. Presentation of Index data does not reflect a belief by Navellier that any stock index constitutes an investment alternative to any Navellier equity strategy or is necessarily comparable to such strategies. Among the most important differences between the Indices and Navellier strategies are that the Navellier equity strategies may (1) incur material management fees, (2) concentrate its investments in relatively few stocks, industries, or sectors, (3) have significantly greater trading activity and related costs, and (4) be significantly more or less volatile than the Indices.
ETF Risk: We may invest in exchange traded funds (“ETFs”) and some of our investment strategies are generally fully invested in ETFs. Like traditional mutual funds, ETFs charge asset-based fees, but they generally do not charge initial sales charges or redemption fees and investors typically pay only customary brokerage fees to buy and sell ETF shares. The fees and costs charged by ETFs held in client accounts will not be deducted from the compensation the client pays Navellier. ETF prices can fluctuate up or down, and a client account could lose money investing in an ETF if the prices of the securities owned by the ETF go down. ETFs are subject to additional risks:
- ETF shares may trade above or below their net asset value;
- An active trading market for an ETF’s shares may not develop or be maintained;
- The value of an ETF may be more volatile than the underlying portfolio of securities the ETF is designed to track;
- The cost of owning shares of the ETF may exceed those a client would incur by directly investing in the underlying securities and;
- Trading of an ETF’s shares may be halted if the listing exchange’s officials deem it appropriate, the shares are delisted from the exchange, or the activation of market-wide “circuit breakers” (which are tied to large decreases in stock prices) halts stock trading generally.
Grader Disclosures: Investment in equity strategies involves substantial risk and has the potential for partial or complete loss of funds invested. The sample portfolio and any accompanying charts are for informational purposes only and are not to be construed as a solicitation to buy or sell any financial instrument and should not be relied upon as the sole factor in an investment making decision. As a matter of normal and important disclosures to you, as a potential investor, please consider the following: The performance presented is not based on any actual securities trading, portfolio, or accounts, and the reported performance of the A, B, C, D, and F portfolios (collectively the “model portfolios”) should be considered mere “paper” or pro forma performance results based on Navellier’s research.
Investors evaluating any of Navellier & Associates, Inc.’s, (or its affiliates’) Investment Products must not use any information presented here, including the performance figures of the model portfolios, in their evaluation of any Navellier Investment Products. Navellier Investment Products include the firm’s mutual funds and managed accounts. The model portfolios, charts, and other information presented do not represent actual funded trades and are not actual funded portfolios. There are material differences between Navellier Investment Products’ portfolios and the model portfolios, research, and performance figures presented here. The model portfolios and the research results (1) may contain stocks or ETFs that are illiquid and difficult to trade; (2) may contain stock or ETF holdings materially different from actual funded Navellier Investment Product portfolios; (3) include the reinvestment of all dividends and other earnings, estimated trading costs, commissions, or management fees; and, (4) may not reflect prices obtained in an actual funded Navellier Investment Product portfolio. For these and other reasons, the reported performances of model portfolios do not reflect the performance results of Navellier’s actually funded and traded Investment Products. In most cases, Navellier’s Investment Products have materially lower performance results than the performances of the model portfolios presented.
This report contains statements that are, or may be considered to be, forward-looking statements. All statements that are not historical facts, including statements about our beliefs or expectations, are “forward-looking statements” within the meaning of The U.S. Private Securities Litigation Reform Act of 1995. These statements may be identified by such forward-looking terminology as “expect,” “estimate,” “plan,” “intend,” “believe,” “anticipate,” “may,” “will,” “should,” “could,” “continue,” “project,” or similar statements or variations of such terms. Our forward-looking statements are based on a series of expectations, assumptions, and projections, are not guarantees of future results or performance, and involve substantial risks and uncertainty as described in Form ADV Part 2A of our filing with the Securities and Exchange Commission (SEC), which is available at www.adviserinfo.sec.gov or by requesting a copy by emailing info@navellier.com. All of our forward-looking statements are as of the date of this report only. We can give no assurance that such expectations or forward-looking statements will prove to be correct. Actual results may differ materially. You are urged to carefully consider all such factors.
FEDERAL TAX ADVICE DISCLAIMER: As required by U.S. Treasury Regulations, you are informed that, to the extent this presentation includes any federal tax advice, the presentation is not written by Navellier to be used, and cannot be used, for the purpose of avoiding federal tax penalties. Navellier does not advise on any income tax requirements or issues. Use of any information presented by Navellier is for general information only and does not represent tax advice either express or implied. You are encouraged to seek professional tax advice for income tax questions and assistance.
IMPORTANT NEWSLETTER DISCLOSURE:The hypothetical performance results for investment newsletters that are authored or edited by Louis Navellier, including Louis Navellier’s Growth Investor, Louis Navellier’s Breakthrough Stocks, Louis Navellier’s Accelerated Profits, and Louis Navellier’s Platinum Club, are not based on any actual securities trading, portfolio, or accounts, and the newsletters’ reported hypothetical performances should be considered mere “paper” or proforma hypothetical performance results and are not actual performance of real world trades. Navellier & Associates, Inc. does not have any relation to or affiliation with the owner of these newsletters. There are material differences between Navellier Investment Products’ portfolios and the InvestorPlace Media, LLC newsletter portfolios authored by Louis Navellier. The InvestorPlace Media, LLC newsletters contain hypothetical performance that do not include transaction costs, advisory fees, or other fees a client might incur if actual investments and trades were being made by an investor. As a result, newsletter performance should not be used to evaluate Navellier Investment services which are separate and different from the newsletters. The owner of the newsletters is InvestorPlace Media, LLC and any questions concerning the newsletters, including any newsletter advertising or hypothetical Newsletter performance claims, (which are calculated solely by Investor Place Media and not Navellier) should be referred to InvestorPlace Media, LLC at (800) 718-8289.
Please note that Navellier & Associates and the Navellier Private Client Group are managed completely independent of the newsletters owned and published by InvestorPlace Media, LLC and written and edited by Louis Navellier, and investment performance of the newsletters should in no way be considered indicative of potential future investment performance for any Navellier & Associates separately managed account portfolio. Potential investors should consult with their financial advisor before investing in any Navellier Investment Product.
Navellier claims compliance with Global Investment Performance Standards (GIPS). To receive a complete list and descriptions of Navellier’s composites and/or a presentation that adheres to the GIPS standards, please contact Navellier or click here. It should not be assumed that any securities recommendations made by Navellier & Associates, Inc. in the future will be profitable or equal the performance of securities made in this report.
FactSet Disclosure: Navellier does not independently calculate the statistical information included in the attached report. The calculation and the information are provided by FactSet, a company not related to Navellier. Although information contained in the report has been obtained from FactSet and is based on sources Navellier believes to be reliable, Navellier does not guarantee its accuracy, and it may be incomplete or condensed. The report and the related FactSet sourced information are provided on an “as is” basis. The user assumes the entire risk of any use made of this information. Investors should consider the report as only a single factor in making their investment decision. The report is for informational purposes only and is not intended as an offer or solicitation for the purchase or sale of a security. FactSet sourced information is the exclusive property of FactSet. Without prior written permission of FactSet, this information may not be reproduced, disseminated or used to create any financial products. All indices are unmanaged and performance of the indices include reinvestment of dividends and interest income, unless otherwise noted, are not illustrative of any particular investment and an investment cannot be made in any index. Past performance is no guarantee of future results.