by Gary Alexander
September 12, 2023
In the last 25 years, three events have haunted us, and they all share an anniversary this week, yet most of our attention this week may be focused on the 22nd anniversary of 9/11. That’s understandable from one perspective, but financial crises also carry their own long-term toll – plus some valuable lessons – and this month marks their 15th and 25th and 150th anniversaries, so let’s look at railroads, real estate and the ruble:
Crisis #1: September 20-29, 1998: The Russian Ruble Breaks the Bank
So many trading systems are based on “what works historically,” especially past trading ranges of historic tops and bottoms. A famous example of this folly is the case of Long-Term Capital Management (LTCM).
As often happens, the “best and the brightest” craft a fool-proof system that ultimately fools themselves. The core system was devised by Nobel prize winners Myron Scholes and Robert C. Merton, using their eponymous Black-Scholes-Merton system for pricing options with no theoretical risk. Whenever spreads between a pair of sovereign bonds got too far out of alignment, they would sell the overpriced bond and buy the underpriced one, pocketing the difference as prices reverted to the mean, using high leverage to supercharge thin spreads. Trades were executed by another superstar, bond king John Merriwether.
For nearly half a decade (1994 to mid-1998) LTCM’s returns were so phenomenal (40% a year) that their assets under management (AUM) soared to nearly $100 billion, but in August 1998, Russia defaulted on its ruble debt and so LTCM’s narrow spreads – by then leveraged up to a stratospheric 50-to-1 – ballooned and exploded, resulting in a debt exposure over $1 trillion, so margin calls came streaming in.
According to later testimony by William J. McDonough, then-president of the New York Federal Reserve:
“A team from the New York Fed, led by Peter Fisher, head of our Markets Group, and joined by Treasury Assistant Secretary Gary Gensler, met with the Long-Term Capital partners at their offices, on Sunday, September 20. During this meeting, we learned the broad outlines of Long-Term Capital’s major positions in credit and equity markets, the difficulties they were having in trying to reduce these positions in thin market conditions, their deteriorating funding positions … The team also came to understand …that the size of these positions was much greater than market participants imagined.”
The rest of the world learned on Tuesday, September 22, that LTCM was bankrupt, and a government-led bail-out was to begin the next day. Essentially, the New York Federal Reserve organized a rescue plan – not for just this one hedge fund, but of global liquidity for all major currency exposures. What was not so clear at the time was that Warren Buffett offered to take over LTCM at about a dime on the dollar, but he was rejected because the firm rightly believed the Federal Reserve would bail them out more favorably.
The next week, on Monday, September 29, Federal Reserve Chairman Alan Greenspan cut short-term interest rates in response to rising global financial turmoil, but his work was not over. The Fed eventually reduced the Fed Funds rate three times throughout the fall of 1998 as liquidity fears spread globally.
Graphs are for illustrative and discussion purposes only. Please read important disclosures at the end of this commentary.
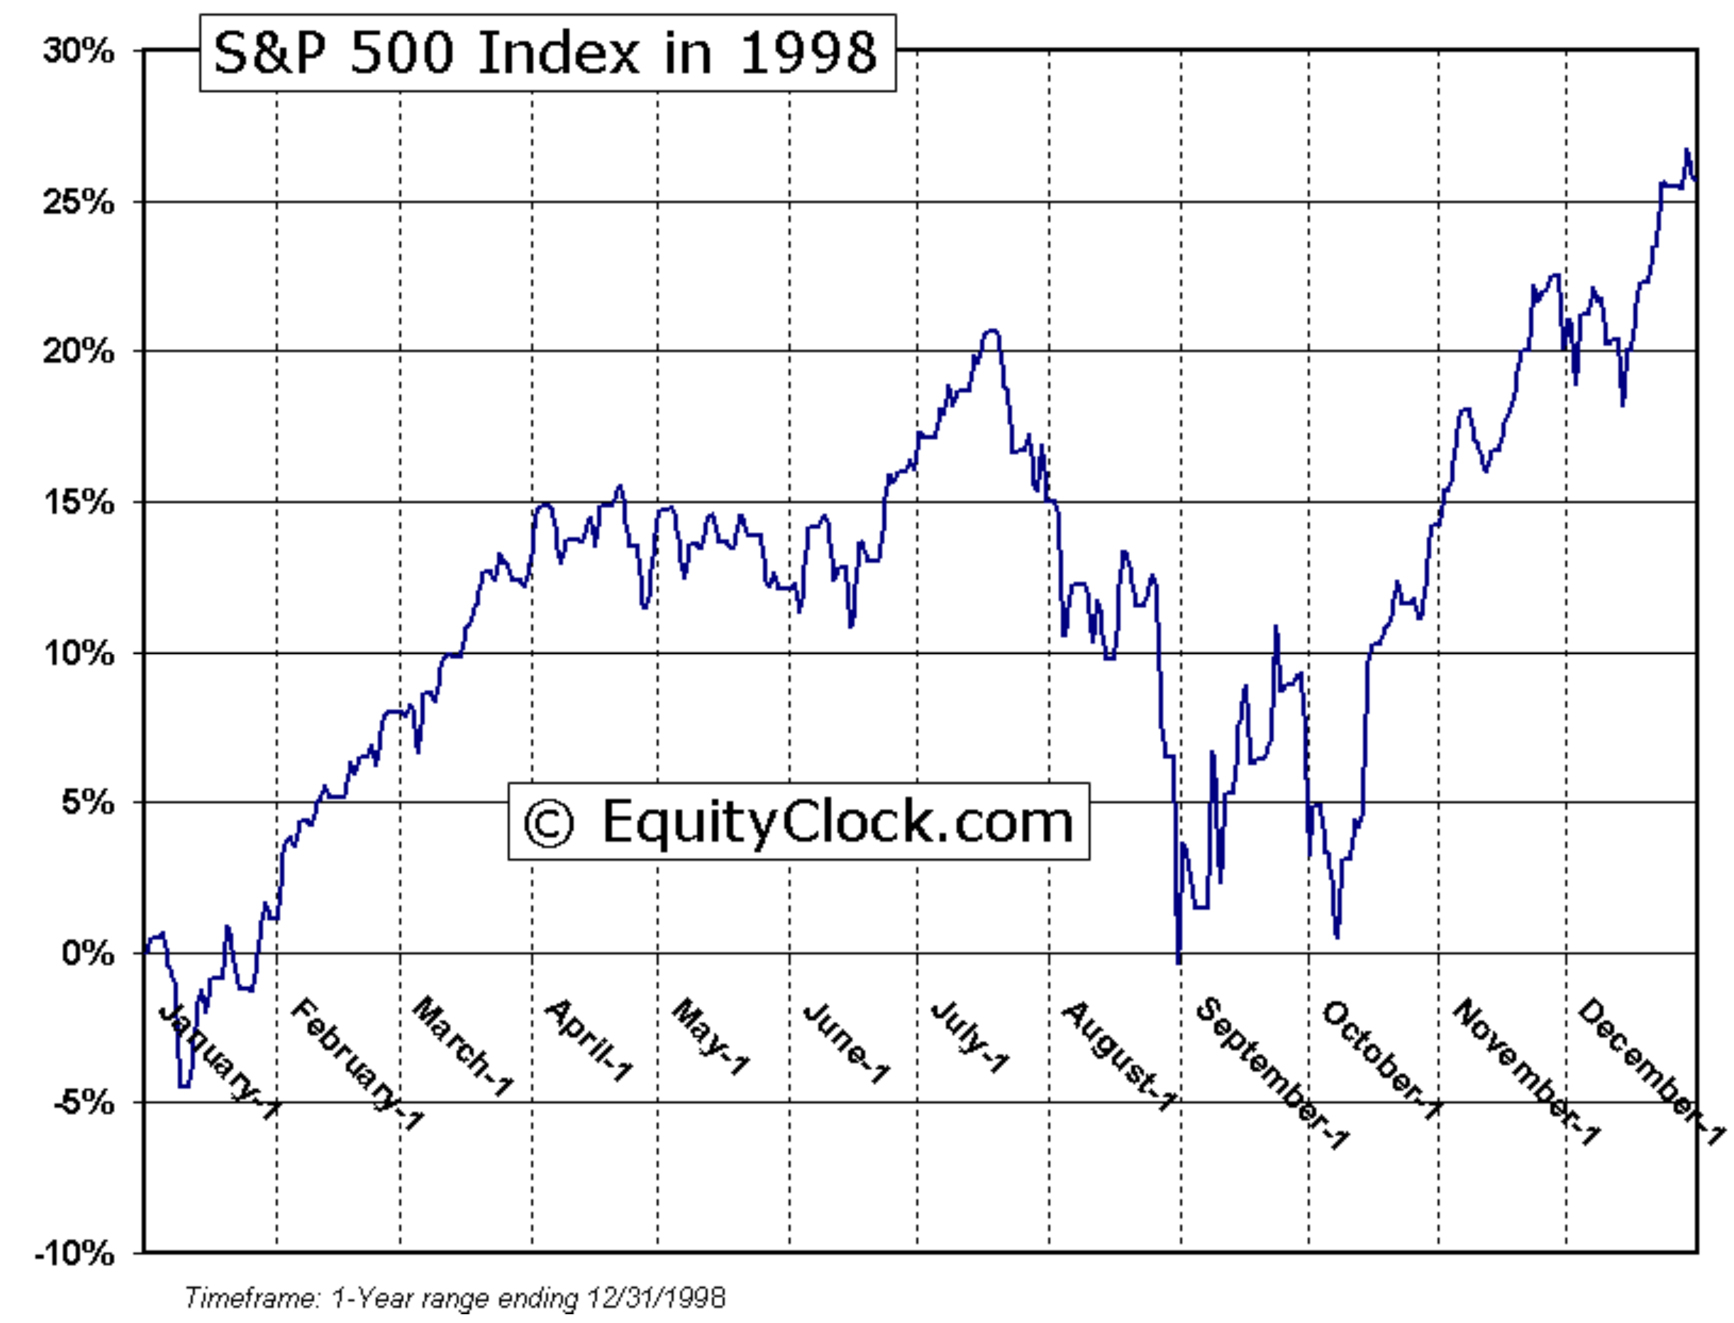
The Russian ruble and LTCM collapse caused a double bottom, but stocks then rallied 28% to new highs.
The bulk of the market decline that summer came during the ruble collapse from July 17 to August 31 (-19.3% in both the Dow and S&P 500). After an early September rally, the market set a double bottom on news of LTCM’s collapse. Thursday, October 8 was the “date of maximum pessimism.” That week, I was helping John Dessauer host his “Dream Swiss Seminar” in Grindelwald and we sensed major gloom among the 60+ investors assembled there, so Dessauer said he was buying stocks that day and encouraged others to do so. In short order, the S&P 500 rocketed back up 28% between October 8 and year-end 1998.
Crisis #2: September 15, 2008 – The Day Real Estate Debt Almost Destroyed Wall Street
It all started with a housing boom, as a series of politicians and realtors oversold the American Dream:
“In 2002, the George W. Bush administration urged Congress to pass the American Dream Down Payment Act, which subsidized the down payments of prospective home buyers whose incomes were below a certain level. After the passage of that Act, the president also urged Congress to pass legislation permitting the Federal Housing Administration to begin making zero-down-payment loans at low interest rates to low-income Americans” (Thomas Sowell, Housing Boom and Bust, p. 41-42).
Graphs are for illustrative and discussion purposes only. Please read important disclosures at the end of this commentary.
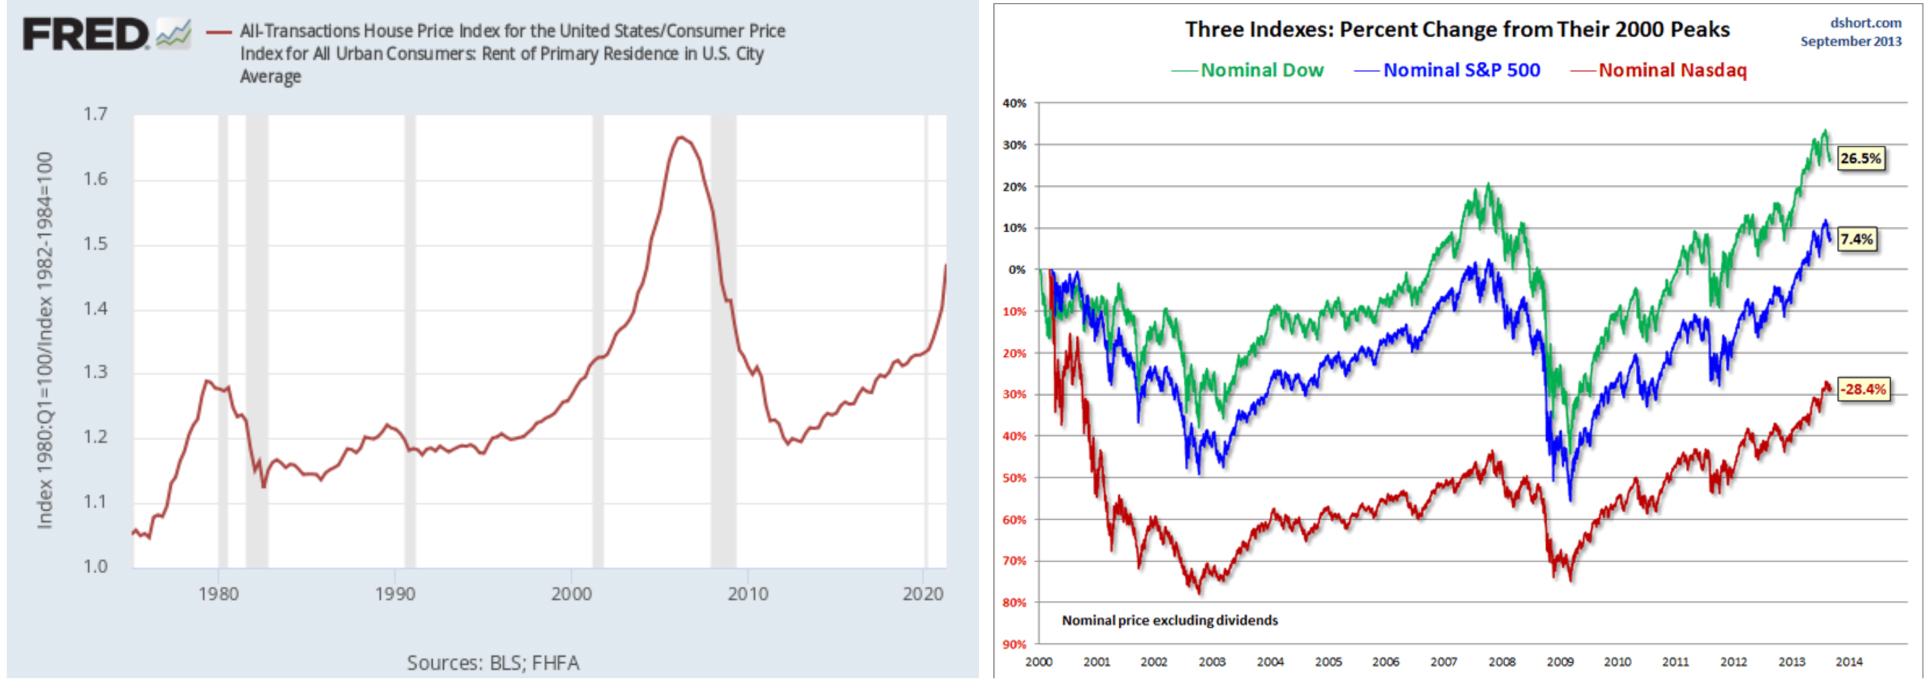
Home prices crashed in 2006-7 (St. Louis Fed chart), followed by a stock market crash in 2008-9 (Market Oracle)
Barney Frank, Chair of the House Committee on Financial Services, admitted that he “would like to get Fannie and Freddie more deeply into helping low-income housing and possibly moving into something that is more explicitly like a subsidy,” adding that, “I want to roll the dice a little bit more in this situation toward subsidized housing” (Sowell, page 49). As a result, home prices started escalating rapidly in 2002 to 2005, and homeowners often treated their homes like an ATM machine, refinancing to generate cash.
Bear Stearns was forced into a pennies-on-the dollar shotgun merger in March 2008, and other financial firms were next inline. After emergency measures failed to save Lehman Brothers on Sunday, September 14, the firm filed Chapter 11 bankruptcy papers on Monday, September 15, setting off a stock free-fall:
| INDEX | September 12, 2008 | March 9, 2009 | Six-month decline |
| Dow Jones Industrials | 11,421.99 | 6,547.05 | -42.7% |
| NASDAQ Composite | 2,261.27 | 1,268.64 | -43.9% |
| S&P 500 | 1,251.70 | 676.53 | -46.0% |
| Russell 2000 | 720.26 | 343.26 | -52.3% |
| Source: Stock Trader’s Almanac 2010 | |||
The Dow fell 4.5% on September 15, the worst one-day drop since the Attack on America on 9/11, but unlike 2001, these declines continued for the next six months. That first week of September 15-19, 2008, saw massive cash and money market withdrawals, threatening major banks with imminent failure.
It wasn’t just real estate, of course. Wall Street manufactured kinky derivatives out of risky “tranches” of real estate mortgage loans (many rated “AAA”), but bids disappeared on such junk in that fall of 2008.
Crisis #3: September 18-22, 1873: Bankrupt Railroads Unhorsed “Mad Traders” on Wall Street
Going further back in our time machine, railroads were the hot tech stocks after the Civil War, especially after the first Transcontinental Railroad was completed in 1869, so banker Jay Cooke decided to build another transcontinental railroad! But on Thursday, September 18, 1873, at 11:00am on Wall Street, H.C. Fahnstock, Cooke’s New York partner, announced that Cooke’s office was closed. Cooke, in Philadelphia that day, admitted it was true, and so the most prominent banker in the country was suddenly bankrupt.
Despite Wall Street’s railroad mania, Cooke failed to construct a second transcontinental line. Apparently, demand could not support a second line. Cooke’s folly was mostly a symbol of gross over-speculation in land and securities. After this September opening shot, over 5000 businesses failed in the last quarter of 1873 and another 5,000 businesses failed over the next five years, as inflation gave way to deflation.

Graphs are for illustrative and discussion purposes only. Please read important disclosures at the end of this commentary.
Robert Sobel, writing like Stephen King in Panic on Wall Street, said the “coal-black steed named Panic” quickly “thundered riderless down Wall Street,” where “a monstrous yell went up and seemed to literally shake the building in which all these mad brokers were for the moment confined.” Along with Jay Cooke, 37 other banks and two brokerage houses closed their doors on this date alone. In ensuing days, losses increased, and the NYSE was forced to close for over a week. Eventually, the Secretary of the Treasury decided to infuse the economy with $26 million in paper money and the market eventually re-opened.
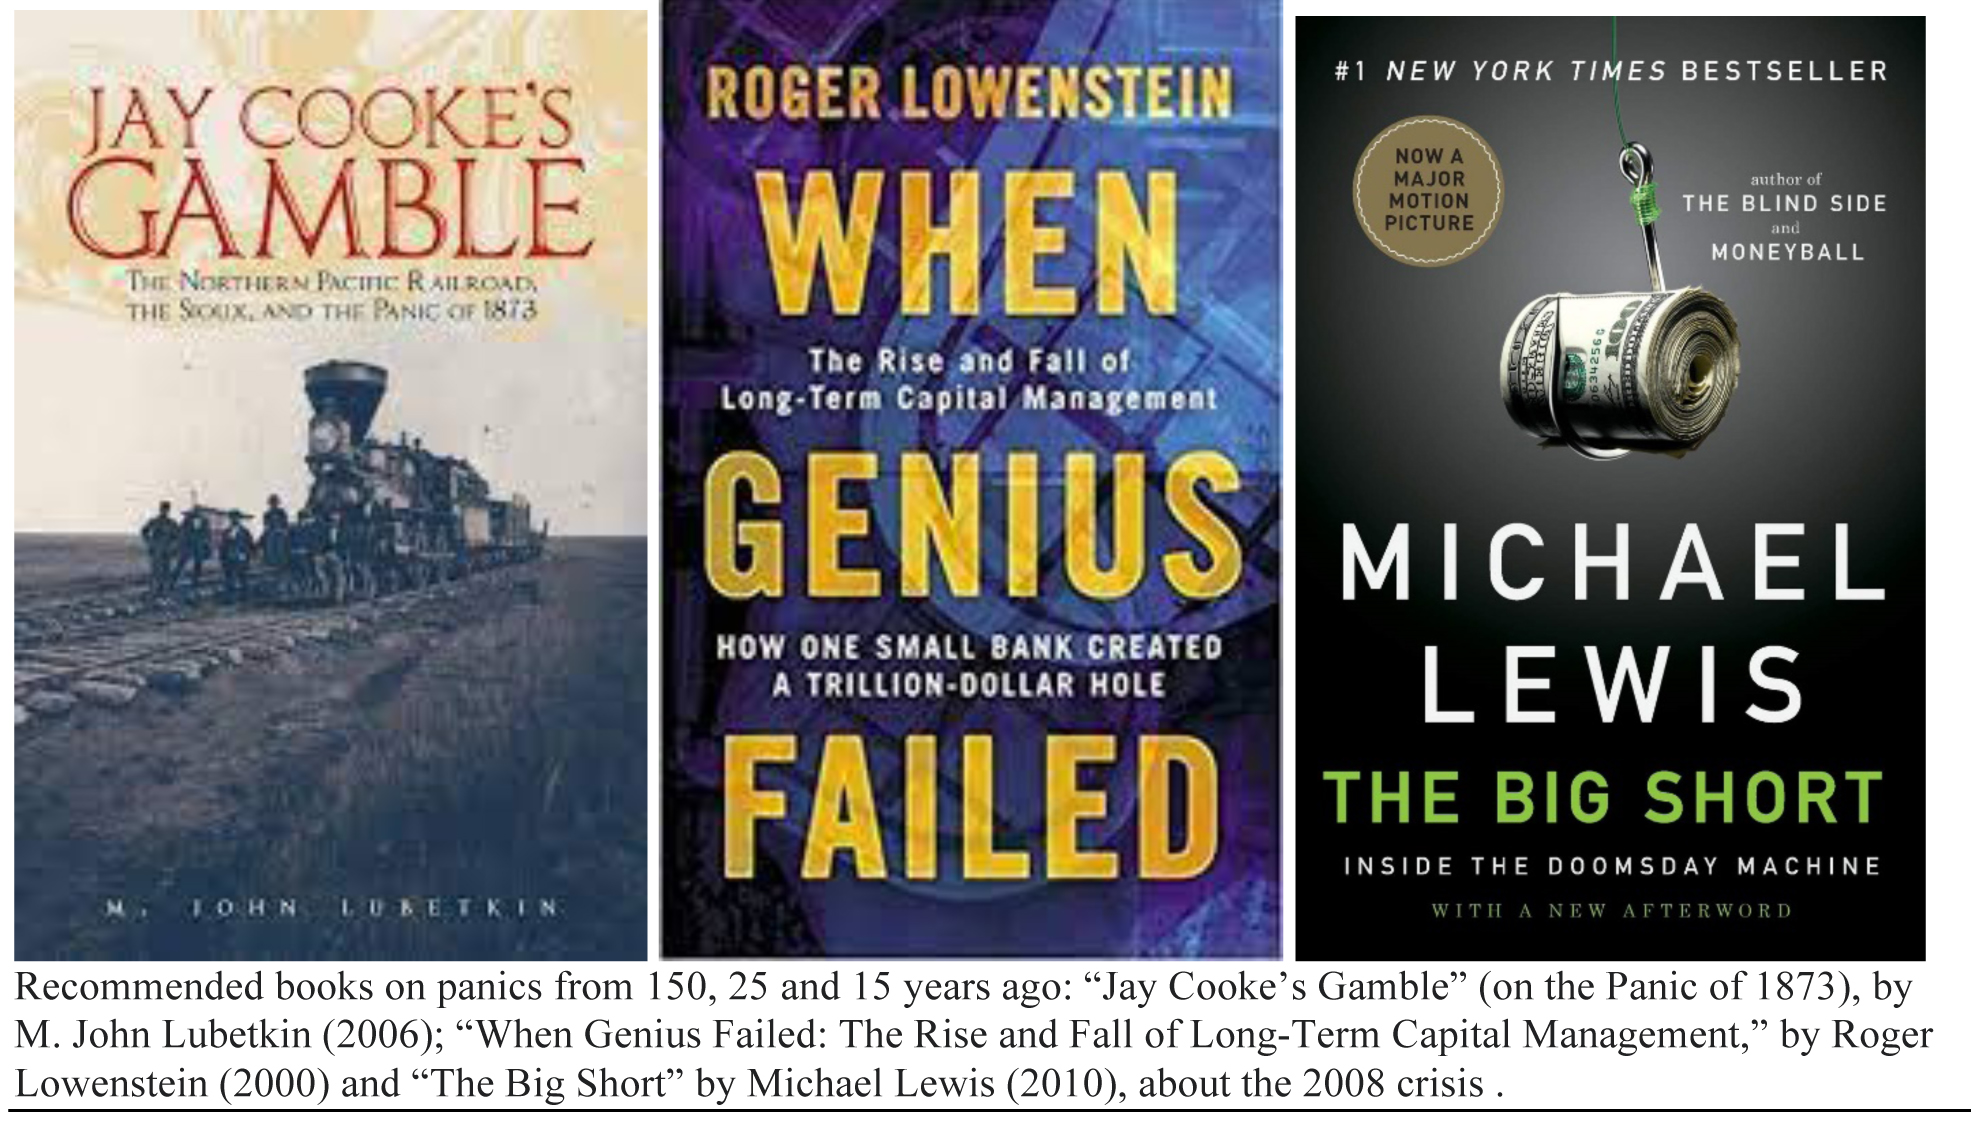
There have been some superb books (and a movie or two) about these three September crashes:
America’s Panic soon spread to Europe, from whence much of the capital for these failed railroad bonds originated, causing the worst worldwide depression to that date, lasting for most of the rest of the 1870s.
Now you may understand why September has a worse historical record than even dreaded October! But the real lesson is not to get caught up in the reigning mania of the day, even if it seems like a sure thing.
All content above represents the opinion of Gary Alexander of Navellier & Associates, Inc.
Also In This Issue
A Look Ahead by Louis Navellier
World Trade is Waning as the G20 Meets in India
Income Mail by Bryan Perry
Investors Look for A “September to Remember”
Growth Mail by Gary Alexander
September Speculations in Railroads, Real Estate and Russian Rubles
Global Mail by Ivan Martchev
The Yuan Wild Card Just Got Wilder
Sector Spotlight by Jason Bodner
September 11 Puts Any Market Moves in Perspective
View Full Archive
Read Past Issues Here
About The Author

Gary Alexander
SENIOR EDITOR
Gary Alexander has been Senior Writer at Navellier since 2009. He edits Navellier’s weekly Marketmail and writes a weekly Growth Mail column, in which he uses market history to support the case for growth stocks. For the previous 20 years before joining Navellier, he was Senior Executive Editor at InvestorPlace Media (formerly Phillips Publishing), where he worked with several leading investment analysts, including Louis Navellier (since 1997), helping launch Louis Navellier’s Blue Chip Growth and Global Growth newsletters.
Prior to that, Gary edited Wealth Magazine and Gold Newsletter and wrote various investment research reports for Jefferson Financial in New Orleans in the 1980s. He began his financial newsletter career with KCI Communications in 1980, where he served as consulting editor for Personal Finance newsletter while serving as general manager of KCI’s Alexandria House book division. Before that, he covered the economics beat for news magazines. All content of “Growth Mail” represents the opinion of Gary Alexander
Important Disclosures:
Although information in these reports has been obtained from and is based upon sources that Navellier believes to be reliable, Navellier does not guarantee its accuracy and it may be incomplete or condensed. All opinions and estimates constitute Navellier’s judgment as of the date the report was created and are subject to change without notice. These reports are for informational purposes only and are not a solicitation for the purchase or sale of a security. Any decision to purchase securities mentioned in these reports must take into account existing public information on such securities or any registered prospectus.To the extent permitted by law, neither Navellier & Associates, Inc., nor any of its affiliates, agents, or service providers assumes any liability or responsibility nor owes any duty of care for any consequences of any person acting or refraining to act in reliance on the information contained in this communication or for any decision based on it.
Past performance is no indication of future results. Investment in securities involves significant risk and has the potential for partial or complete loss of funds invested. It should not be assumed that any securities recommendations made by Navellier. in the future will be profitable or equal the performance of securities made in this report. Dividend payments are not guaranteed. The amount of a dividend payment, if any, can vary over time and issuers may reduce dividends paid on securities in the event of a recession or adverse event affecting a specific industry or issuer.
None of the stock information, data, and company information presented herein constitutes a recommendation by Navellier or a solicitation to buy or sell any securities. Any specific securities identified and described do not represent all of the securities purchased, sold, or recommended for advisory clients. The holdings identified do not represent all of the securities purchased, sold, or recommended for advisory clients and the reader should not assume that investments in the securities identified and discussed were or will be profitable.
Information presented is general information that does not take into account your individual circumstances, financial situation, or needs, nor does it present a personalized recommendation to you. Individual stocks presented may not be suitable for every investor. Investment in securities involves significant risk and has the potential for partial or complete loss of funds invested. Investment in fixed income securities has the potential for the investment return and principal value of an investment to fluctuate so that an investor’s holdings, when redeemed, may be worth less than their original cost.
One cannot invest directly in an index. Index is unmanaged and index performance does not reflect deduction of fees, expenses, or taxes. Presentation of Index data does not reflect a belief by Navellier that any stock index constitutes an investment alternative to any Navellier equity strategy or is necessarily comparable to such strategies. Among the most important differences between the Indices and Navellier strategies are that the Navellier equity strategies may (1) incur material management fees, (2) concentrate its investments in relatively few stocks, industries, or sectors, (3) have significantly greater trading activity and related costs, and (4) be significantly more or less volatile than the Indices.
ETF Risk: We may invest in exchange traded funds (“ETFs”) and some of our investment strategies are generally fully invested in ETFs. Like traditional mutual funds, ETFs charge asset-based fees, but they generally do not charge initial sales charges or redemption fees and investors typically pay only customary brokerage fees to buy and sell ETF shares. The fees and costs charged by ETFs held in client accounts will not be deducted from the compensation the client pays Navellier. ETF prices can fluctuate up or down, and a client account could lose money investing in an ETF if the prices of the securities owned by the ETF go down. ETFs are subject to additional risks:
- ETF shares may trade above or below their net asset value;
- An active trading market for an ETF’s shares may not develop or be maintained;
- The value of an ETF may be more volatile than the underlying portfolio of securities the ETF is designed to track;
- The cost of owning shares of the ETF may exceed those a client would incur by directly investing in the underlying securities; and
- Trading of an ETF’s shares may be halted if the listing exchange’s officials deem it appropriate, the shares are delisted from the exchange, or the activation of market-wide “circuit breakers” (which are tied to large decreases in stock prices) halts stock trading generally.
Grader Disclosures: Investment in equity strategies involves substantial risk and has the potential for partial or complete loss of funds invested. The sample portfolio and any accompanying charts are for informational purposes only and are not to be construed as a solicitation to buy or sell any financial instrument and should not be relied upon as the sole factor in an investment making decision. As a matter of normal and important disclosures to you, as a potential investor, please consider the following: The performance presented is not based on any actual securities trading, portfolio, or accounts, and the reported performance of the A, B, C, D, and F portfolios (collectively the “model portfolios”) should be considered mere “paper” or pro forma performance results based on Navellier’s research.
Investors evaluating any of Navellier & Associates, Inc.’s, (or its affiliates’) Investment Products must not use any information presented here, including the performance figures of the model portfolios, in their evaluation of any Navellier Investment Products. Navellier Investment Products include the firm’s mutual funds and managed accounts. The model portfolios, charts, and other information presented do not represent actual funded trades and are not actual funded portfolios. There are material differences between Navellier Investment Products’ portfolios and the model portfolios, research, and performance figures presented here. The model portfolios and the research results (1) may contain stocks or ETFs that are illiquid and difficult to trade; (2) may contain stock or ETF holdings materially different from actual funded Navellier Investment Product portfolios; (3) include the reinvestment of all dividends and other earnings, estimated trading costs, commissions, or management fees; and, (4) may not reflect prices obtained in an actual funded Navellier Investment Product portfolio. For these and other reasons, the reported performances of model portfolios do not reflect the performance results of Navellier’s actually funded and traded Investment Products. In most cases, Navellier’s Investment Products have materially lower performance results than the performances of the model portfolios presented.
This report contains statements that are, or may be considered to be, forward-looking statements. All statements that are not historical facts, including statements about our beliefs or expectations, are “forward-looking statements” within the meaning of The U.S. Private Securities Litigation Reform Act of 1995. These statements may be identified by such forward-looking terminology as “expect,” “estimate,” “plan,” “intend,” “believe,” “anticipate,” “may,” “will,” “should,” “could,” “continue,” “project,” or similar statements or variations of such terms. Our forward-looking statements are based on a series of expectations, assumptions, and projections, are not guarantees of future results or performance, and involve substantial risks and uncertainty as described in Form ADV Part 2A of our filing with the Securities and Exchange Commission (SEC), which is available at www.adviserinfo.sec.gov or by requesting a copy by emailing info@navellier.com. All of our forward-looking statements are as of the date of this report only. We can give no assurance that such expectations or forward-looking statements will prove to be correct. Actual results may differ materially. You are urged to carefully consider all such factors.
FEDERAL TAX ADVICE DISCLAIMER: As required by U.S. Treasury Regulations, you are informed that, to the extent this presentation includes any federal tax advice, the presentation is not written by Navellier to be used, and cannot be used, for the purpose of avoiding federal tax penalties. Navellier does not advise on any income tax requirements or issues. Use of any information presented by Navellier is for general information only and does not represent tax advice either express or implied. You are encouraged to seek professional tax advice for income tax questions and assistance.
IMPORTANT NEWSLETTER DISCLOSURE:The hypothetical performance results for investment newsletters that are authored or edited by Louis Navellier, including Louis Navellier’s Growth Investor, Louis Navellier’s Breakthrough Stocks, Louis Navellier’s Accelerated Profits, and Louis Navellier’s Platinum Club, are not based on any actual securities trading, portfolio, or accounts, and the newsletters’ reported hypothetical performances should be considered mere “paper” or proforma hypothetical performance results and are not actual performance of real world trades. Navellier & Associates, Inc. does not have any relation to or affiliation with the owner of these newsletters. There are material differences between Navellier Investment Products’ portfolios and the InvestorPlace Media, LLC newsletter portfolios authored by Louis Navellier. The InvestorPlace Media, LLC newsletters contain hypothetical performance that do not include transaction costs, advisory fees, or other fees a client might incur if actual investments and trades were being made by an investor. As a result, newsletter performance should not be used to evaluate Navellier Investment services which are separate and different from the newsletters. The owner of the newsletters is InvestorPlace Media, LLC and any questions concerning the newsletters, including any newsletter advertising or hypothetical Newsletter performance claims, (which are calculated solely by Investor Place Media and not Navellier) should be referred to InvestorPlace Media, LLC at (800) 718-8289.
Please note that Navellier & Associates and the Navellier Private Client Group are managed completely independent of the newsletters owned and published by InvestorPlace Media, LLC and written and edited by Louis Navellier, and investment performance of the newsletters should in no way be considered indicative of potential future investment performance for any Navellier & Associates separately managed account portfolio. Potential investors should consult with their financial advisor before investing in any Navellier Investment Product.
Navellier claims compliance with Global Investment Performance Standards (GIPS). To receive a complete list and descriptions of Navellier’s composites and/or a presentation that adheres to the GIPS standards, please contact Navellier or click here. It should not be assumed that any securities recommendations made by Navellier & Associates, Inc. in the future will be profitable or equal the performance of securities made in this report.
FactSet Disclosure: Navellier does not independently calculate the statistical information included in the attached report. The calculation and the information are provided by FactSet, a company not related to Navellier. Although information contained in the report has been obtained from FactSet and is based on sources Navellier believes to be reliable, Navellier does not guarantee its accuracy, and it may be incomplete or condensed. The report and the related FactSet sourced information are provided on an “as is” basis. The user assumes the entire risk of any use made of this information. Investors should consider the report as only a single factor in making their investment decision. The report is for informational purposes only and is not intended as an offer or solicitation for the purchase or sale of a security. FactSet sourced information is the exclusive property of FactSet. Without prior written permission of FactSet, this information may not be reproduced, disseminated or used to create any financial products. All indices are unmanaged and performance of the indices include reinvestment of dividends and interest income, unless otherwise noted, are not illustrative of any particular investment and an investment cannot be made in any index. Past performance is no guarantee of future results.