
by Bryan Perry
August 25, 2026
For nearly a decade, income investors were forced into an uncomfortable compromise: either accept micro-yields from safe government bonds or venture far out on the credit risk curve to buy high-yield junk debt. Today, even with rates more normalized, achieving a double-digit yield usually comes with catches, either structural credit exposure in private debt or severe capital erosion from yield-trap equities.
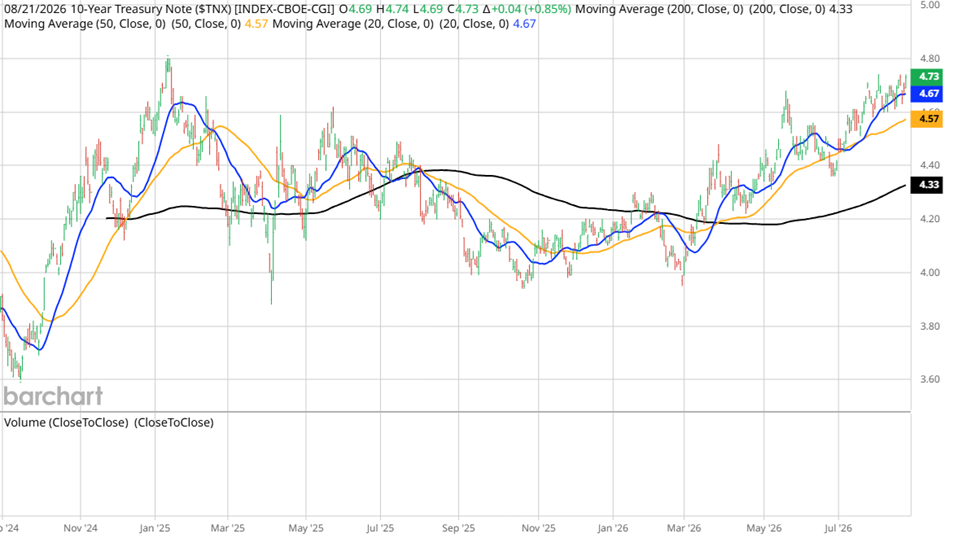
Currently, the bond market is in huge flux, with the fixed-income landscape experiencing a structural shift. The U.S.10-Year Treasury yield recently pushed up near a 20-month high (4.74%), with 30-year yields touching near-20-year highs (5.27%). The cause for higher yields at present is glaringly obvious.
Graphs are for illustrative and discussion purposes only. Please read important disclosures at the end of this commentary.
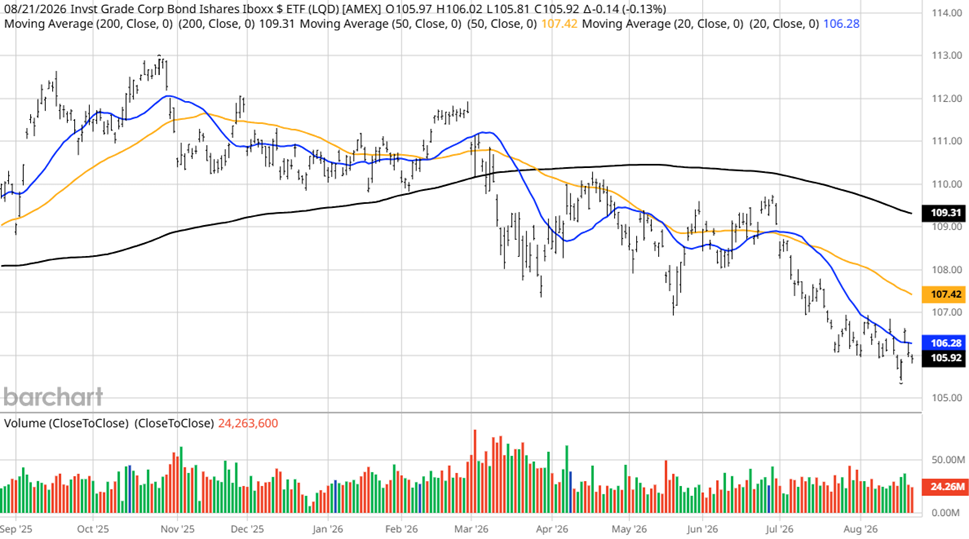
Unprecedented federal debt issuance is flooding the market. Investors are demanding a higher yield to hold long-term debt, driving Treasury and investment grade bond prices down even as short-term policy rates remain on hold. Persistent cost pressures, driven by energy market volatility and runaway spending, have triggered hawkish Federal Reserve signals, including a message of delayed rate cuts.
Graphs are for illustrative and discussion purposes only. Please read important disclosures at the end of this commentary.
Hence, traditional fixed-income debt instruments are underperforming, and though the recent inflation data has favored a more bullish bias for future Fed policy, it hasn’t changed the pressure felt on the longer end of the yield curve. Bond vigilantes are working 24/7 to take the 10-year Treasury yield to 5%, which is why Treasury Secretary Scott Bessent tried to support the markets with a $4 billion buyback – a fairly tiny sum compared to the size of the Treasury market and increasingly huge annual budget deficits.
The market trades over $800 billion in debt daily, so a $4 billion repurchase offers just a brief liquidity cushion. Unlike the Federal Reserve, which can create bank reserves out of thin air to buy bonds (as with QE), the Treasury must use the cash it actually holds. That cash comes from tax revenues or issuing new debt, like short-term Treasury bills, and that is why the bond market shrugged off this event a day later.
At the same time, S&P 500 earnings are robust, with targets of 8,000-8,500 emerging from the top Wall Street firms crunching numbers around the clock. So, it would seem these same firms have priced in the implications of bond market volatility, and their assumptions come amid selling in long-dated maturities.
Some High-Yield Alternatives Now
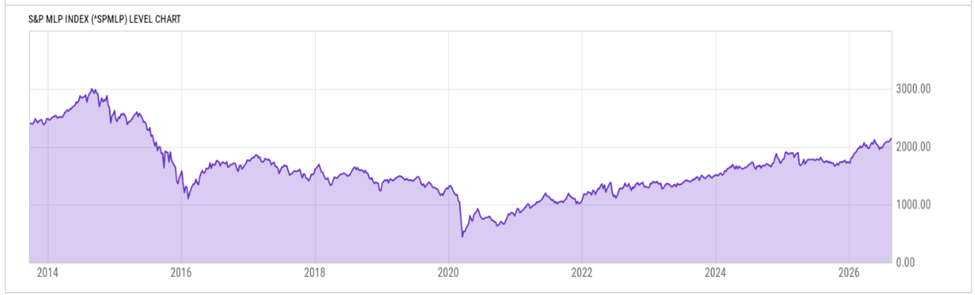
Despite this, a compelling path to high yields exists without relying on conventional fixed-income assets. By building a targeted, two-pillar portfolio of Energy Master Limited Partnerships (MLPs) and active equity option overlay ETFs, investors can generate strong current cash flow with capital-gains potential.
Graphs are for illustrative and discussion purposes only. Please read important disclosures at the end of this commentary.
Energy Master Limited Partnerships represent the essential circulatory system of the modern economy. Unlike traditional oil and gas exploration companies exposed to volatile commodity prices, midstream MLPs operate under a toll-booth business model. They own pipelines, storage facilities, and processing plants which collect fixed-fee revenues based on volume rather than energy prices.
The post-2015 balance sheet discipline in the energy sector transformed MLPs into cash-generation powerhouses. Today, major midstream operators carry historically low leverage ratios, generating significant free cash flow after capital expenditures, and funding capital expansion projects internally.
The resulting distributions are not only generous but highly covered by operating cash flows, offering an exceptionally attractive risk-adjusted income yield, along with embedded tax advantages.
To pull the portfolio’s overall yield toward a double-digit yield, active covered call and equity overlay strategies provide a powerful strategy. Rather than relying solely on corporate earnings distributions, these active ETFs buy high-quality equities and indexes, such as the S&P 500 or Nasdaq 100, and write call options against the portfolio or indices to capture implied volatility premiums.
In sideways, modestly bullish, or volatile market environments – like the present market landscape – call option premiums can spike, transforming market volatility directly into spendable monthly income.
While traditional covered call funds capped all equity upside, the modern actively managed overlays dynamically adjust strike prices and hedge positions, allowing investors to participate in structural equity bull runs while harvesting robust, derivative-generated cash flow.
In an environment where short-term interest rates are expected to stabilize or fall, and with inflation running at a 3.4% annual rate, earning income exceeding inflation and tax rates while offering upside appreciation potential means getting more creative with one’s capital committed to income generation.
Against the current market landscape, this combination of asset classes looks to benefit from a rising S&P 500 index and expanding domestic energy infrastructure. Together, investors can craft a 7%-to-8%+ blended yield approaching what the S&P 500 averaged on an annual basis in its historical run.
Going back over a century, to 1916, the long-term annualized nominal return of U.S. large-cap stocks (with dividends reinvested) is roughly 10.4% per year. Technically, the modern S&P 500 index wasn’t officially established until 1957. However, back-tested reconstructions using Robert Shiller’s historical dataset confirm performance consistently circling a 10% nominal benchmark, regardless of the start date.
A portfolio constructed to return 7%-8% a year by way of distributions alone is a compelling proposition in today’s market, where long-term Treasuries are under pressure, demand for energy is rising, and the Kevin Warsh-led Fed is targeting an easier monetary policy. Income investors have tactical choices to stay ahead of inflation and the tax man, and these tools are readily available – not the illiquid high-risk private equity route, but instead, seek liquid assets traded on the NYSE with the click of a mouse.
All content above represents the opinion of Bryan Perry of Navellier & Associates, Inc.
Also In This Issue
A Look Ahead by Louis Navellier
Why Data Centers and Memory Stocks Remain Great Buys
Income Mail by Bryan Perry
The Current Blueprint for High Yield Income
Growth Mail by Gary Alexander
The “Gold Vigilantes” Went to War This August
Global Mail by Ivan Martchev
Secretary Bessent’s Act of Desperation
Sector Spotlight by Jason Bodner
Trust the Data, Not Your “Gut” Feelings
View Full Archive
Read Past Issues Here

Bryan Perry
SENIOR DIRECTOR
Bryan Perry is a Senior Director with Navellier Private Client Group, advising and facilitating high net worth investors in the pursuit of their financial goals.
Bryan’s financial services career spanning the past three decades includes over 20-years of wealth management experience with Wall Street firms that include Bear Stearns, Lehman Brothers and Paine Webber, working with both retail and institutional clients. Bryan earned a B.A. in Political Science from Virginia Polytechnic Institute & State University and currently holds a Series 65 license. All content of “Income Mail” represents the opinion of Bryan Perry
Important Disclosures:
Although information in these reports has been obtained from and is based upon sources that Navellier believes to be reliable, Navellier does not guarantee its accuracy and it may be incomplete or condensed. All opinions and estimates constitute Navellier’s judgment as of the date the report was created and are subject to change without notice. These reports are for informational purposes only and are not a solicitation for the purchase or sale of a security. Any decision to purchase securities mentioned in these reports must take into account existing public information on such securities or any registered prospectus.To the extent permitted by law, neither Navellier & Associates, Inc., nor any of its affiliates, agents, or service providers assumes any liability or responsibility nor owes any duty of care for any consequences of any person acting or refraining to act in reliance on the information contained in this communication or for any decision based on it.
Past performance is no indication of future results. Investment in securities involves significant risk and has the potential for partial or complete loss of funds invested. It should not be assumed that any securities recommendations made by Navellier. in the future will be profitable or equal the performance of securities made in this report. Dividend payments are not guaranteed. The amount of a dividend payment, if any, can vary over time and issuers may reduce dividends paid on securities in the event of a recession or adverse event affecting a specific industry or issuer.
None of the stock information, data, and company information presented herein constitutes a recommendation by Navellier or a solicitation to buy or sell any securities. Any specific securities identified and described do not represent all of the securities purchased, sold, or recommended for advisory clients. The holdings identified do not represent all of the securities purchased, sold, or recommended for advisory clients and the reader should not assume that investments in the securities identified and discussed were or will be profitable.
Information presented is general information that does not take into account your individual circumstances, financial situation, or needs, nor does it present a personalized recommendation to you. Individual stocks presented may not be suitable for every investor. Investment in securities involves significant risk and has the potential for partial or complete loss of funds invested. Investment in fixed income securities has the potential for the investment return and principal value of an investment to fluctuate so that an investor’s holdings, when redeemed, may be worth less than their original cost.
One cannot invest directly in an index. Index is unmanaged and index performance does not reflect deduction of fees, expenses, or taxes. Presentation of Index data does not reflect a belief by Navellier that any stock index constitutes an investment alternative to any Navellier equity strategy or is necessarily comparable to such strategies. Among the most important differences between the Indices and Navellier strategies are that the Navellier equity strategies may (1) incur material management fees, (2) concentrate its investments in relatively few stocks, industries, or sectors, (3) have significantly greater trading activity and related costs, and (4) be significantly more or less volatile than the Indices.
ETF Risk: We may invest in exchange traded funds (“ETFs”) and some of our investment strategies are generally fully invested in ETFs. Like traditional mutual funds, ETFs charge asset-based fees, but they generally do not charge initial sales charges or redemption fees and investors typically pay only customary brokerage fees to buy and sell ETF shares. The fees and costs charged by ETFs held in client accounts will not be deducted from the compensation the client pays Navellier. ETF prices can fluctuate up or down, and a client account could lose money investing in an ETF if the prices of the securities owned by the ETF go down. ETFs are subject to additional risks:
- ETF shares may trade above or below their net asset value;
- An active trading market for an ETF’s shares may not develop or be maintained;
- The value of an ETF may be more volatile than the underlying portfolio of securities the ETF is designed to track;
- The cost of owning shares of the ETF may exceed those a client would incur by directly investing in the underlying securities; and
- Trading of an ETF’s shares may be halted if the listing exchange’s officials deem it appropriate, the shares are delisted from the exchange, or the activation of market-wide “circuit breakers” (which are tied to large decreases in stock prices) halts stock trading generally.
Grader Disclosures: Investment in equity strategies involves substantial risk and has the potential for partial or complete loss of funds invested. The sample portfolio and any accompanying charts are for informational purposes only and are not to be construed as a solicitation to buy or sell any financial instrument and should not be relied upon as the sole factor in an investment making decision. As a matter of normal and important disclosures to you, as a potential investor, please consider the following: The performance presented is not based on any actual securities trading, portfolio, or accounts, and the reported performance of the A, B, C, D, and F portfolios (collectively the “model portfolios”) should be considered mere “paper” or pro forma performance results based on Navellier’s research.
Investors evaluating any of Navellier & Associates, Inc.’s, (or its affiliates’) Investment Products must not use any information presented here, including the performance figures of the model portfolios, in their evaluation of any Navellier Investment Products. Navellier Investment Products include the firm’s mutual funds and managed accounts. The model portfolios, charts, and other information presented do not represent actual funded trades and are not actual funded portfolios. There are material differences between Navellier Investment Products’ portfolios and the model portfolios, research, and performance figures presented here. The model portfolios and the research results (1) may contain stocks or ETFs that are illiquid and difficult to trade; (2) may contain stock or ETF holdings materially different from actual funded Navellier Investment Product portfolios; (3) include the reinvestment of all dividends and other earnings, estimated trading costs, commissions, or management fees; and, (4) may not reflect prices obtained in an actual funded Navellier Investment Product portfolio. For these and other reasons, the reported performances of model portfolios do not reflect the performance results of Navellier’s actually funded and traded Investment Products. In most cases, Navellier’s Investment Products have materially lower performance results than the performances of the model portfolios presented.
This report contains statements that are, or may be considered to be, forward-looking statements. All statements that are not historical facts, including statements about our beliefs or expectations, are “forward-looking statements” within the meaning of The U.S. Private Securities Litigation Reform Act of 1995. These statements may be identified by such forward-looking terminology as “expect,” “estimate,” “plan,” “intend,” “believe,” “anticipate,” “may,” “will,” “should,” “could,” “continue,” “project,” or similar statements or variations of such terms. Our forward-looking statements are based on a series of expectations, assumptions, and projections, are not guarantees of future results or performance, and involve substantial risks and uncertainty as described in Form ADV Part 2A of our filing with the Securities and Exchange Commission (SEC), which is available at www.adviserinfo.sec.gov or by requesting a copy by emailing info@navellier.com. All of our forward-looking statements are as of the date of this report only. We can give no assurance that such expectations or forward-looking statements will prove to be correct. Actual results may differ materially. You are urged to carefully consider all such factors.
FEDERAL TAX ADVICE DISCLAIMER: As required by U.S. Treasury Regulations, you are informed that, to the extent this presentation includes any federal tax advice, the presentation is not written by Navellier to be used, and cannot be used, for the purpose of avoiding federal tax penalties. Navellier does not advise on any income tax requirements or issues. Use of any information presented by Navellier is for general information only and does not represent tax advice either express or implied. You are encouraged to seek professional tax advice for income tax questions and assistance.
IMPORTANT NEWSLETTER DISCLOSURE:The hypothetical performance results for investment newsletters that are authored or edited by Louis Navellier, including Louis Navellier’s Growth Investor, Louis Navellier’s Breakthrough Stocks, Louis Navellier’s Accelerated Profits, and Louis Navellier’s Platinum Club, are not based on any actual securities trading, portfolio, or accounts, and the newsletters’ reported hypothetical performances should be considered mere “paper” or proforma hypothetical performance results and are not actual performance of real world trades. Navellier & Associates, Inc. does not have any relation to or affiliation with the owner of these newsletters. There are material differences between Navellier Investment Products’ portfolios and the InvestorPlace Media, LLC newsletter portfolios authored by Louis Navellier. The InvestorPlace Media, LLC newsletters contain hypothetical performance that do not include transaction costs, advisory fees, or other fees a client might incur if actual investments and trades were being made by an investor. As a result, newsletter performance should not be used to evaluate Navellier Investment services which are separate and different from the newsletters. The owner of the newsletters is InvestorPlace Media, LLC and any questions concerning the newsletters, including any newsletter advertising or hypothetical Newsletter performance claims, (which are calculated solely by Investor Place Media and not Navellier) should be referred to InvestorPlace Media, LLC at (800) 718-8289.
Please note that Navellier & Associates and the Navellier Private Client Group are managed completely independent of the newsletters owned and published by InvestorPlace Media, LLC and written and edited by Louis Navellier, and investment performance of the newsletters should in no way be considered indicative of potential future investment performance for any Navellier & Associates separately managed account portfolio. Potential investors should consult with their financial advisor before investing in any Navellier Investment Product.
Navellier claims compliance with Global Investment Performance Standards (GIPS). To receive a complete list and descriptions of Navellier’s composites and/or a presentation that adheres to the GIPS standards, please contact Navellier or click here. It should not be assumed that any securities recommendations made by Navellier & Associates, Inc. in the future will be profitable or equal the performance of securities made in this report.
FactSet Disclosure: Navellier does not independently calculate the statistical information included in the attached report. The calculation and the information are provided by FactSet, a company not related to Navellier. Although information contained in the report has been obtained from FactSet and is based on sources Navellier believes to be reliable, Navellier does not guarantee its accuracy, and it may be incomplete or condensed. The report and the related FactSet sourced information are provided on an “as is” basis. The user assumes the entire risk of any use made of this information. Investors should consider the report as only a single factor in making their investment decision. The report is for informational purposes only and is not intended as an offer or solicitation for the purchase or sale of a security. FactSet sourced information is the exclusive property of FactSet. Without prior written permission of FactSet, this information may not be reproduced, disseminated or used to create any financial products. All indices are unmanaged and performance of the indices include reinvestment of dividends and interest income, unless otherwise noted, are not illustrative of any particular investment and an investment cannot be made in any index. Past performance is no guarantee of future results.