by Jason Bodner
August 22, 2023
August is the month when Americans get jealous of Europeans, who are notorious for their month-long vacations. Many workers take all of August off. That fact even fueled a legendary spat between hedge fund titan Dan Loeb and a prospective employee. Their leaked email conversation devolved quickly, leading to Loeb stereotyping the European as lazy and not wanting to work hard.
Interestingly, prior to 1919, European workers scarcely had any vacations. Breaks were unpaid and didn’t foster travel. But in 1919, some French bakers and printers won a week’s paid vacation. Then politicians saw an opportunity. They viewed workers’ time off as a way to mold society. They urged workers to be political and patriotic during vacations. By 1925 paid vacation was the law across Europe and by World War II, European vacation was politically secure. It kept expanding through the 1980s, when several European countries guaranteed five weeks’ paid vacation per year. And five weeks is a minimum in France. Most French get 6-10 weeks annual leave, depending on their job, on top of paid public holidays.
If Europe indeed shuts down for August, why don’t their stock markets shut down?! After all, volatility is to August as white is to rice. We’ve seen plenty of evidence of that, and this August is no different.
Global stocks have been feeling the pressure, many sinking to two-month lows. It’s partly because bond investors have been selling U.S. Treasury securities lately, pushing yields higher. The 10-year bond hit 4.328%, nearly the highest level since 2007. This is because bond investors feel interest rates will stay higher for longer, or even that rates may rise further. When current rates pay less than what investors think they will be paid in the future, they are worth less, so the bonds get sold, shoving yields higher.
This hurts stocks: The MSCI all-country index is off 5.85% thus far in August, per this ACWI ETF chart:
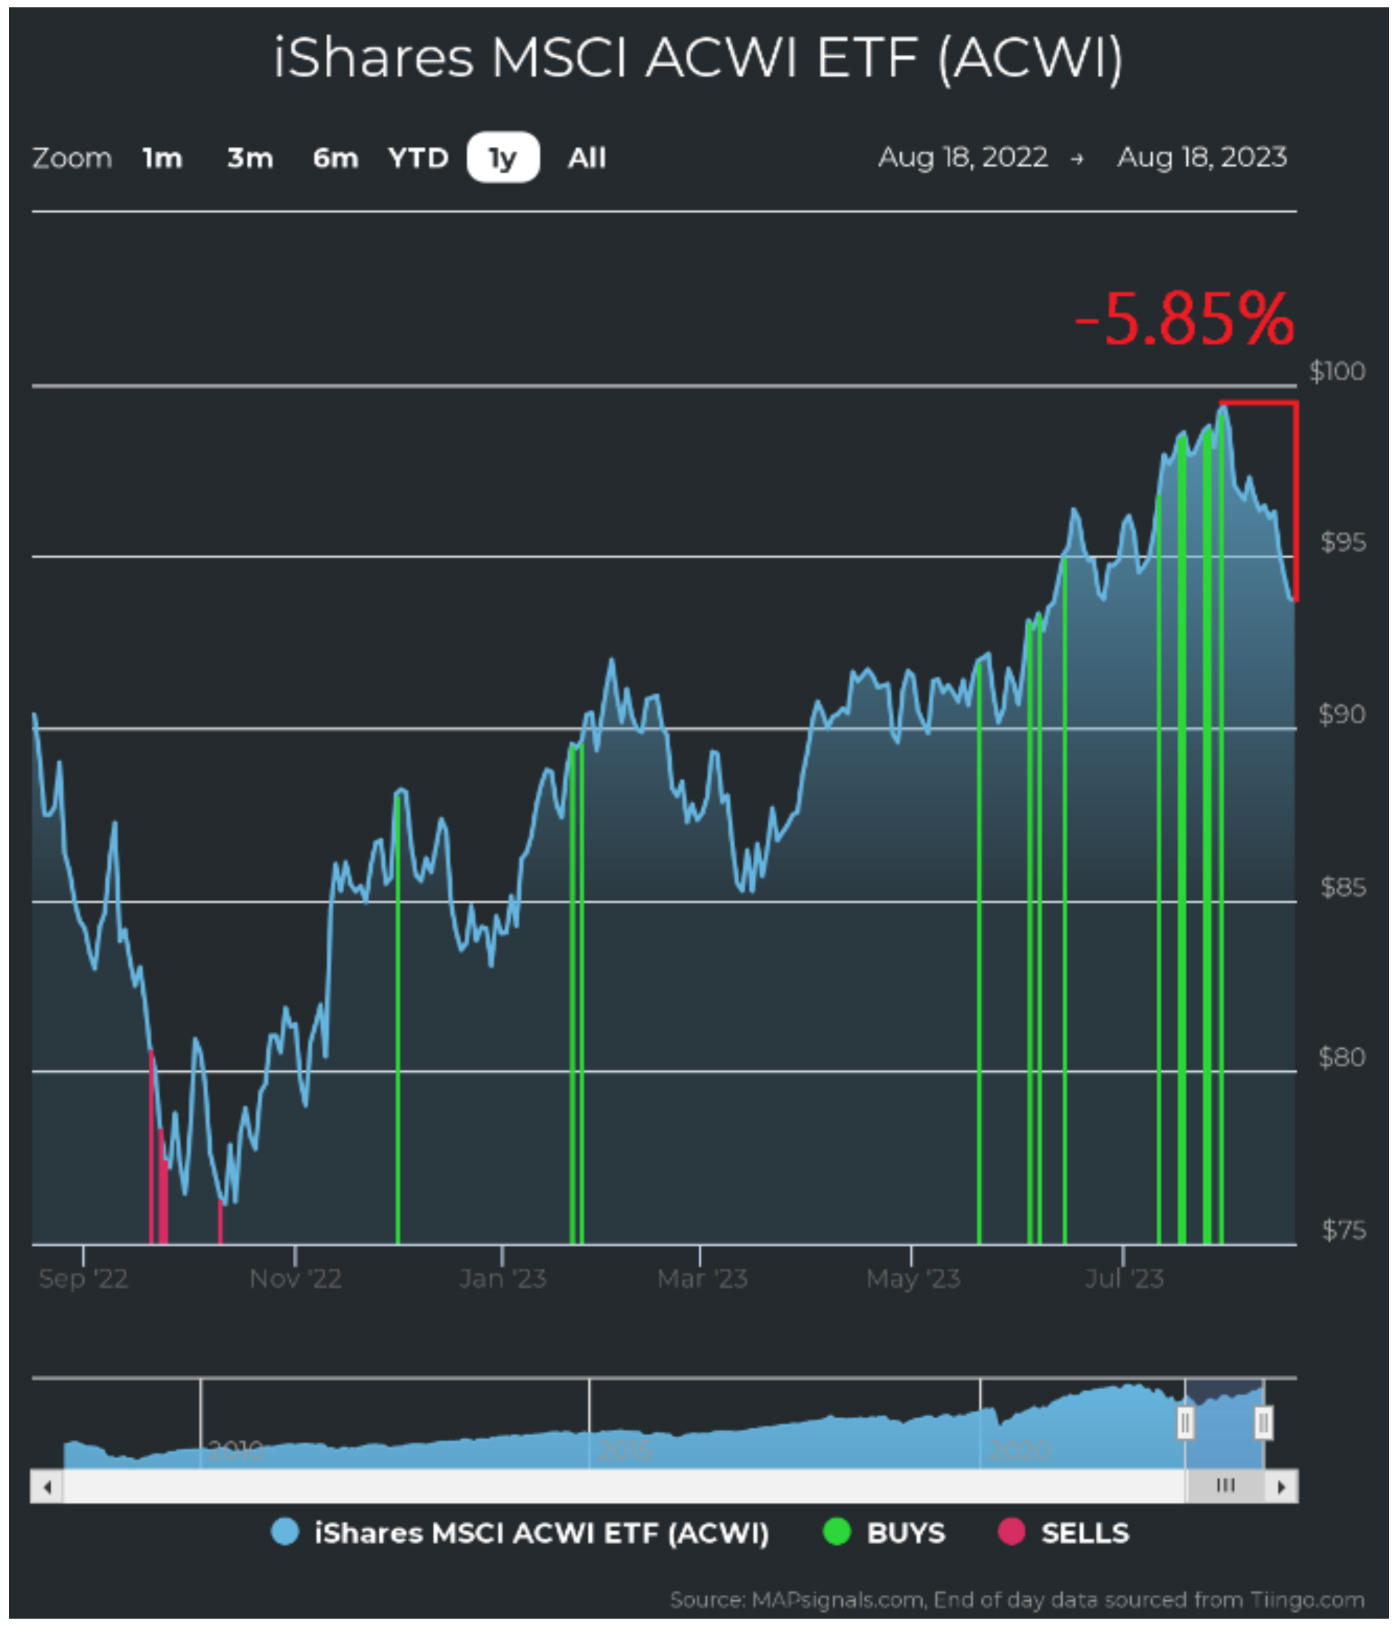
Graphs are for illustrative and discussion purposes only. Please read important disclosures at the end of this commentary.
Talk about August volatility arriving right on schedule! As U.S. economic data continues to beat expectations, stocks pay the price for those higher bond yields. The UK 10-year bond is also at the highest levels since 2008, so bond investors are reminded of the Fed mantra, “Higher for longer.”
They did this before, throughout the year, and frankly it gives a great excuse to punish stocks, only to buy them back later, lower, should there be a reversal in trend in yields – like happened earlier this year.
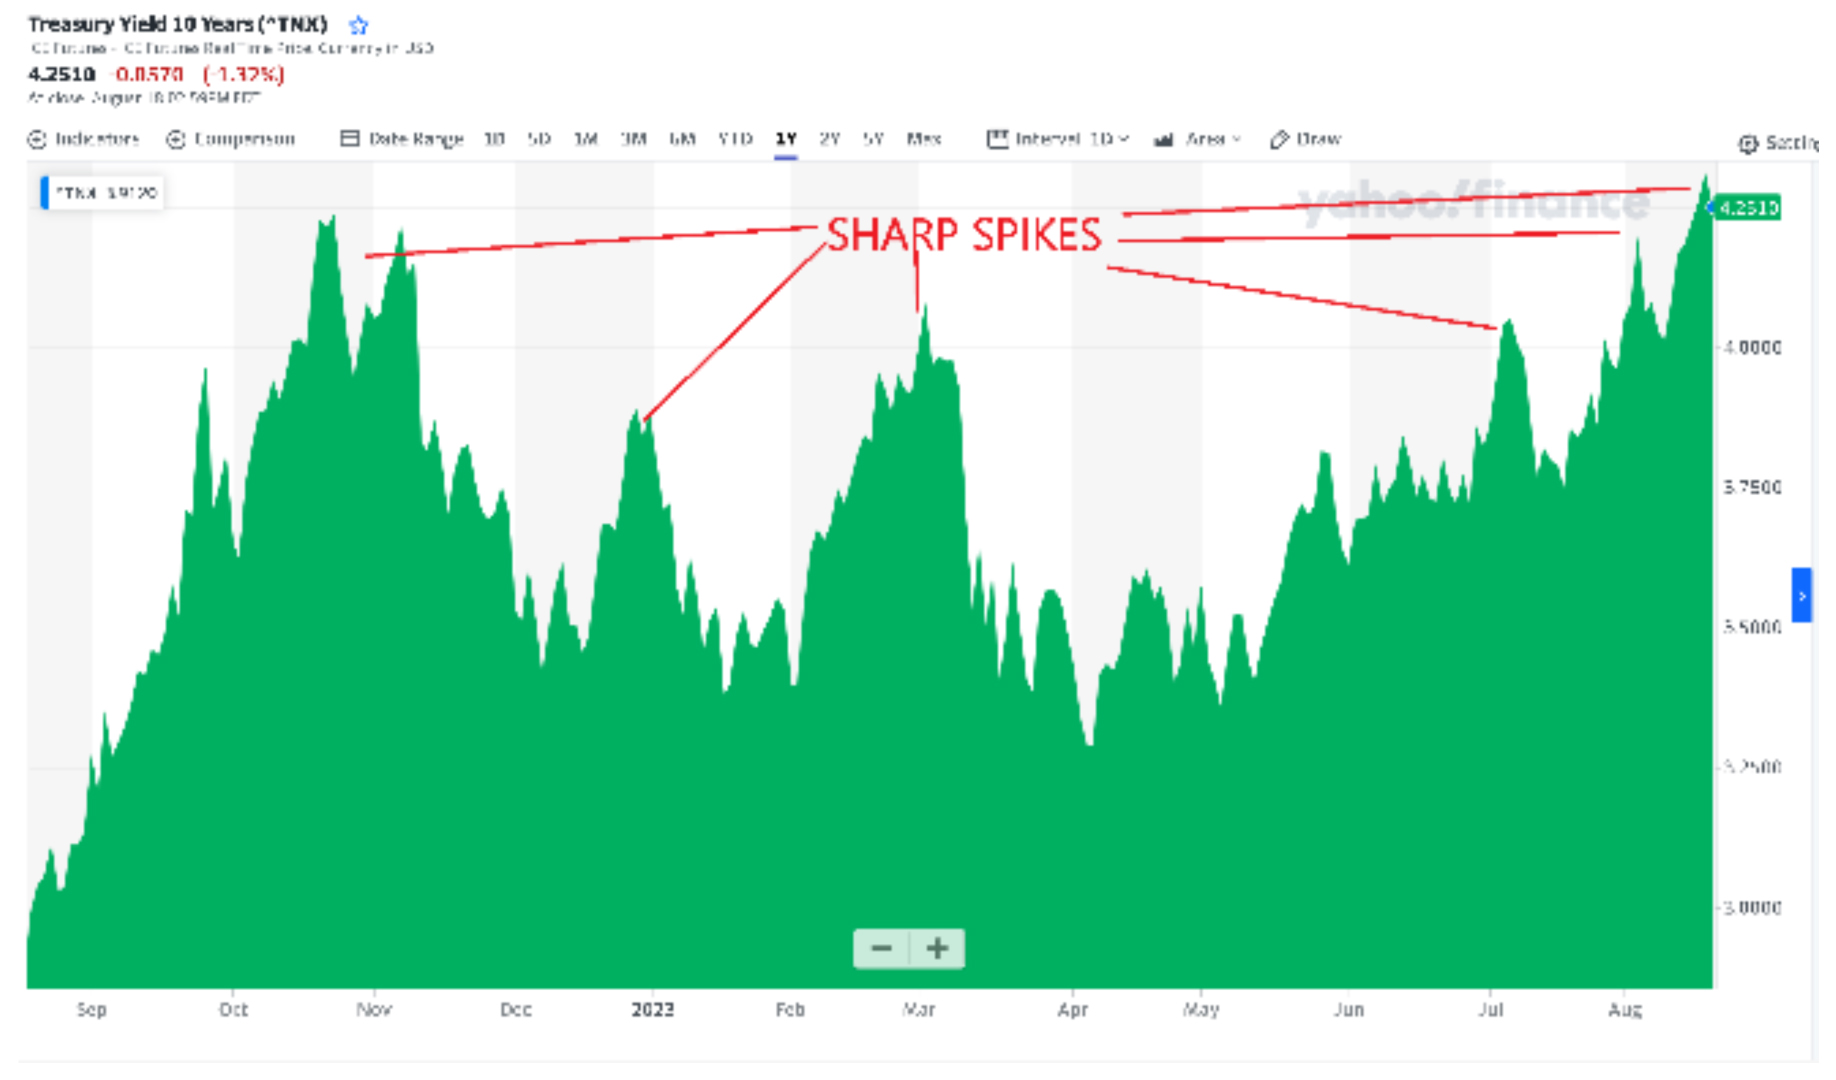
Graphs are for illustrative and discussion purposes only. Please read important disclosures at the end of this commentary.
Federal Reserve minutes showed that members worried about continued risks of inflation – fueling all the rate hike talk. But keep in mind: The CPI has significantly fallen from 9.2% to 3.2%, just above the Fed’s long-term goal of 2%. Also, the latest July CPI was below expectations. In my humble opinion, this provides a great narrative for August and September yuckiness, which seasonally happens according to my research since 1990. But also remember that Q4 is historically the strongest (here’s that chart again):
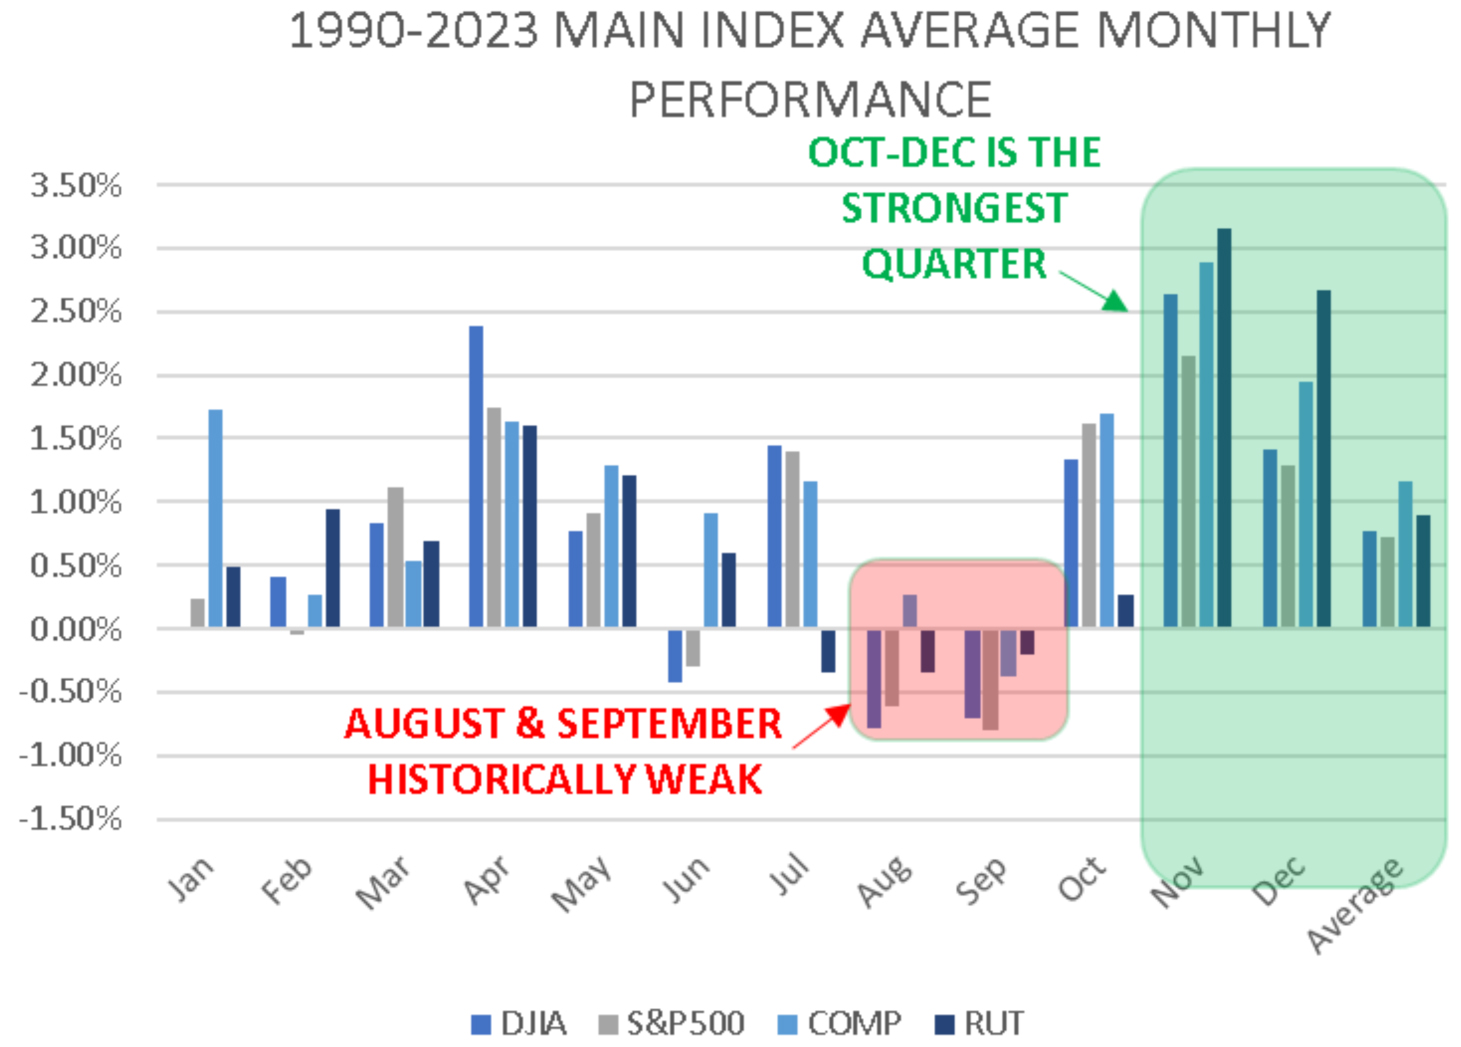
Graphs are for illustrative and discussion purposes only. Please read important disclosures at the end of this commentary.
Getting back to the media drivers of volatility, let’s add fear of China liquidity as more gas on the fire. Zhongzhi Enterprise Group is a major financial firm that said it needs to restructure its debt.
There’s trouble in the Chinese property market, too, with Evergrande filing for bankruptcy protection. That sent Asian shares lower, further pressuring global stocks.
The saying goes, “When the cat’s away, the mice will play.” Most of Wall Street is away on vacation in the dog days of summer. Many are doing their best to emulate Europe’s vacation mentality. Liquidity thins out, which is a precursor for higher volatility. All you need are some scary headlines to catalyze the assault on stocks. My bet is that we will continue in this choppiness for a while.
Nothing would make algo traders happier than to force a “capitulation day,” a shaking out of scared investors. That’s always when the trend bends and stocks rebound. Then, remarkably, the headlines get brighter. There’s evidence suggesting this might be the case, too.
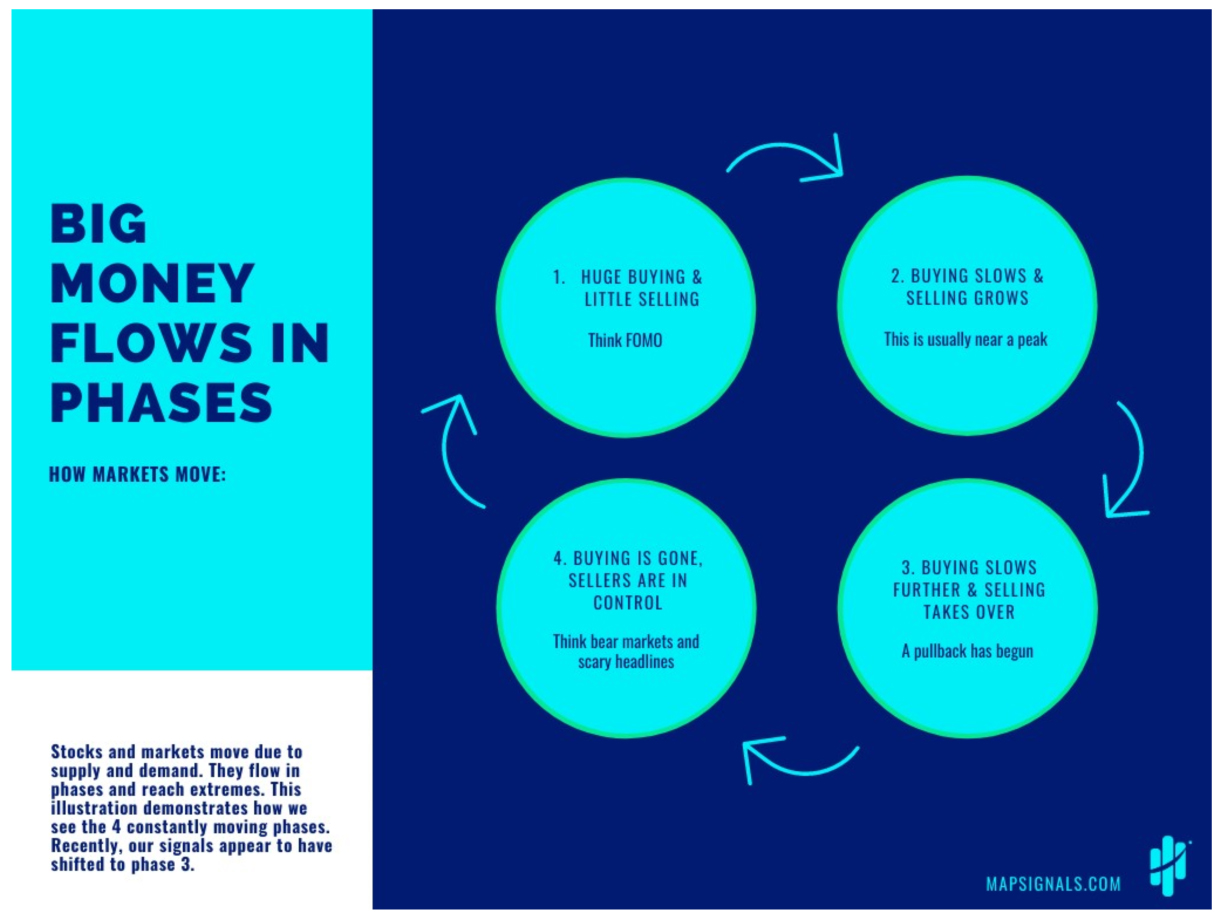
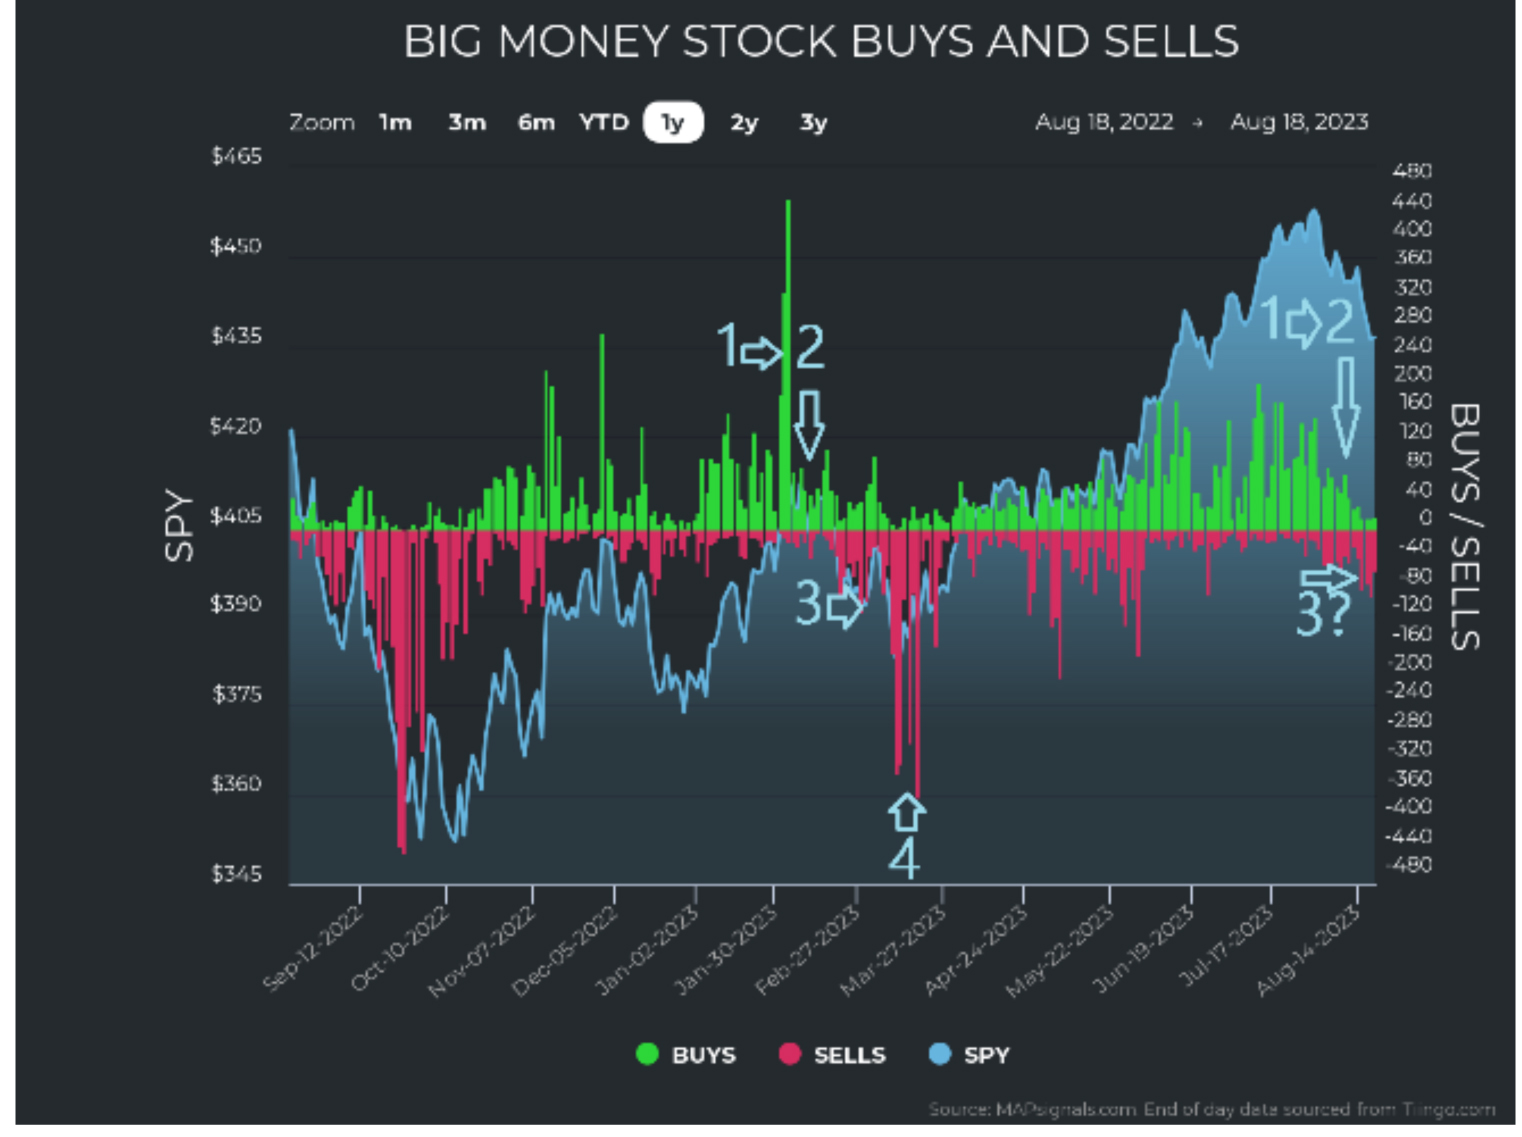
As MAPSignals points out, the flow of big institutional money has a distinct cycle:
Graphs are for illustrative and discussion purposes only. Please read important disclosures at the end of this commentary.
If the type is too small, you can click it to expand, or read my paraphrase of the cycle here:
1) Big buying, little selling: a rising tide lifts all boats.
2) Buying slows down, selling starts: near the peak.
3) Buying all but stops and selling grows: the roller coaster starts the drop.
4) Buying is nowhere, selling is high: fear and loathing.
Looking at the chart of big money buying and selling of stocks, it looks like we are in #3 now.
Graphs are for illustrative and discussion purposes only. Please read important disclosures at the end of this commentary.
We also see the BMI falling fast. Remember, this is a key indicator of money flows in the market:

Graphs are for illustrative and discussion purposes only. Please read important disclosures at the end of this commentary.
The indicators now line up for what we expected – a summer that has most investors wondering if we should just close the stock market. August sucks for now, but there are a few things to keep in mind:
1) Volume is low, and we can see Looking at this chart of unusual trades, which just shows unusual volume transactions, we clearly see prior violent drops are accompanied with spikes in unusually large volume. It may be a precursor, but we are seeing low volume right now:
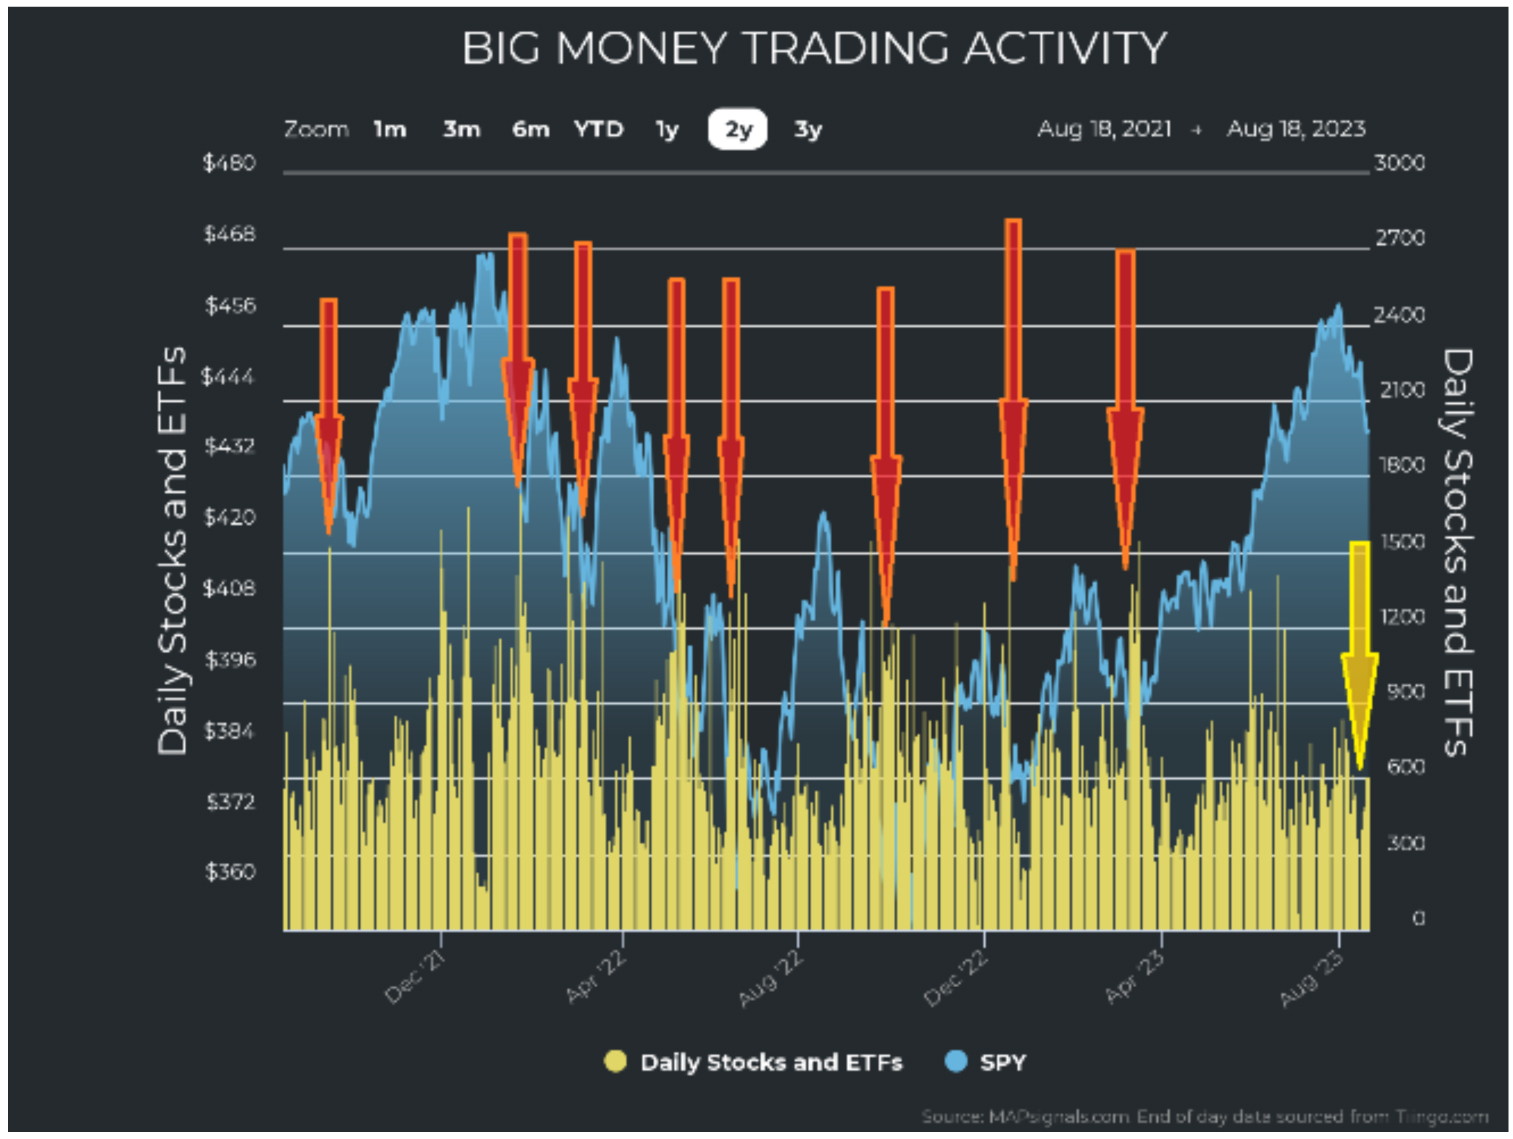
Graphs are for illustrative and discussion purposes only. Please read important disclosures at the end of this commentary.
2) Remember, stocks should start lifting beginning in October and rise through to the end of the year.
I warned you of summer volatility, and it is here big-time, but it’s important to remain focused on the data and seasonality. September usually isn’t much better than August, so hang in there. We have about six weeks to go, but the flip-side of fear is that it brings plenty of opportunity for forward thinkers.
Summer finds Europeans tuning out for the month of August – at least – so should we really be fretting over the latest headline-driven angst? I say no. We should mentally close the market. The news will have you believe there’s plenty to worry about, but in the words of Corrie ten Boom: “Worry does not empty tomorrow of its sorrow. It empties today of its strength.”
All content above represents the opinion of Jason Bodner of Navellier & Associates, Inc.
Also In This Issue
A Look Ahead by Louis Navellier
The Fed May Be “Data-Dependent,” But Some of That Data is Flawed
Income Mail by Bryan Perry
China’s Economy is at Risk of Experiencing a Japan-Like Lost Decade
Growth Mail by Gary Alexander
Decision Time: Will the 2020s Be Another Roaring ‘20s or Stagnant 70s?
Global Mail by Ivan Martchev
Questions About China Intensify
Sector Spotlight by Jason Bodner
With Europe Taking All of August Off, Why Not Close August Markets?
View Full Archive
Read Past Issues Here

Jason Bodner
MARKETMAIL EDITOR FOR SECTOR SPOTLIGHT
Jason Bodner writes Sector Spotlight in the weekly Marketmail publication and has authored several white papers for the company. He is also Co-Founder of Macro Analytics for Professionals which produces proprietary equity accumulation/distribution research for its clients. Previously, Mr. Bodner served as Director of European Equity Derivatives for Cantor Fitzgerald Europe in London, then moved to the role of Head of Equity Derivatives North America for the same company in New York. He also served as S.V.P. Equity Derivatives for Jefferies, LLC. He received a B.S. in business administration in 1996, with honors, from Skidmore College as a member of the Periclean Honors Society. All content of “Sector Spotlight” represents the opinion of Jason Bodner
Important Disclosures:
Jason Bodner is a co-founder and co-owner of Mapsignals. Mr. Bodner is an independent contractor who is occasionally hired by Navellier & Associates to write an article and or provide opinions for possible use in articles that appear in Navellier & Associates weekly Market Mail. Mr. Bodner is not employed or affiliated with Louis Navellier, Navellier & Associates, Inc., or any other Navellier owned entity. The opinions and statements made here are those of Mr. Bodner and not necessarily those of any other persons or entities. This is not an endorsement, or solicitation or testimonial or investment advice regarding the BMI Index or any statements or recommendations or analysis in the article or the BMI Index or Mapsignals or its products or strategies.
Although information in these reports has been obtained from and is based upon sources that Navellier believes to be reliable, Navellier does not guarantee its accuracy and it may be incomplete or condensed. All opinions and estimates constitute Navellier’s judgment as of the date the report was created and are subject to change without notice. These reports are for informational purposes only and are not a solicitation for the purchase or sale of a security. Any decision to purchase securities mentioned in these reports must take into account existing public information on such securities or any registered prospectus.To the extent permitted by law, neither Navellier & Associates, Inc., nor any of its affiliates, agents, or service providers assumes any liability or responsibility nor owes any duty of care for any consequences of any person acting or refraining to act in reliance on the information contained in this communication or for any decision based on it.
Past performance is no indication of future results. Investment in securities involves significant risk and has the potential for partial or complete loss of funds invested. It should not be assumed that any securities recommendations made by Navellier. in the future will be profitable or equal the performance of securities made in this report. Dividend payments are not guaranteed. The amount of a dividend payment, if any, can vary over time and issuers may reduce dividends paid on securities in the event of a recession or adverse event affecting a specific industry or issuer.
None of the stock information, data, and company information presented herein constitutes a recommendation by Navellier or a solicitation to buy or sell any securities. Any specific securities identified and described do not represent all of the securities purchased, sold, or recommended for advisory clients. The holdings identified do not represent all of the securities purchased, sold, or recommended for advisory clients and the reader should not assume that investments in the securities identified and discussed were or will be profitable.
Information presented is general information that does not take into account your individual circumstances, financial situation, or needs, nor does it present a personalized recommendation to you. Individual stocks presented may not be suitable for every investor. Investment in securities involves significant risk and has the potential for partial or complete loss of funds invested. Investment in fixed income securities has the potential for the investment return and principal value of an investment to fluctuate so that an investor’s holdings, when redeemed, may be worth less than their original cost.
One cannot invest directly in an index. Index is unmanaged and index performance does not reflect deduction of fees, expenses, or taxes. Presentation of Index data does not reflect a belief by Navellier that any stock index constitutes an investment alternative to any Navellier equity strategy or is necessarily comparable to such strategies. Among the most important differences between the Indices and Navellier strategies are that the Navellier equity strategies may (1) incur material management fees, (2) concentrate its investments in relatively few stocks, industries, or sectors, (3) have significantly greater trading activity and related costs, and (4) be significantly more or less volatile than the Indices.
ETF Risk: We may invest in exchange traded funds (“ETFs”) and some of our investment strategies are generally fully invested in ETFs. Like traditional mutual funds, ETFs charge asset-based fees, but they generally do not charge initial sales charges or redemption fees and investors typically pay only customary brokerage fees to buy and sell ETF shares. The fees and costs charged by ETFs held in client accounts will not be deducted from the compensation the client pays Navellier. ETF prices can fluctuate up or down, and a client account could lose money investing in an ETF if the prices of the securities owned by the ETF go down. ETFs are subject to additional risks:
- ETF shares may trade above or below their net asset value;
- An active trading market for an ETF’s shares may not develop or be maintained;
- The value of an ETF may be more volatile than the underlying portfolio of securities the ETF is designed to track;
- The cost of owning shares of the ETF may exceed those a client would incur by directly investing in the underlying securities; and
- Trading of an ETF’s shares may be halted if the listing exchange’s officials deem it appropriate, the shares are delisted from the exchange, or the activation of market-wide “circuit breakers” (which are tied to large decreases in stock prices) halts stock trading generally.
Grader Disclosures: Investment in equity strategies involves substantial risk and has the potential for partial or complete loss of funds invested. The sample portfolio and any accompanying charts are for informational purposes only and are not to be construed as a solicitation to buy or sell any financial instrument and should not be relied upon as the sole factor in an investment making decision. As a matter of normal and important disclosures to you, as a potential investor, please consider the following: The performance presented is not based on any actual securities trading, portfolio, or accounts, and the reported performance of the A, B, C, D, and F portfolios (collectively the “model portfolios”) should be considered mere “paper” or pro forma performance results based on Navellier’s research.
Investors evaluating any of Navellier & Associates, Inc.’s, (or its affiliates’) Investment Products must not use any information presented here, including the performance figures of the model portfolios, in their evaluation of any Navellier Investment Products. Navellier Investment Products include the firm’s mutual funds and managed accounts. The model portfolios, charts, and other information presented do not represent actual funded trades and are not actual funded portfolios. There are material differences between Navellier Investment Products’ portfolios and the model portfolios, research, and performance figures presented here. The model portfolios and the research results (1) may contain stocks or ETFs that are illiquid and difficult to trade; (2) may contain stock or ETF holdings materially different from actual funded Navellier Investment Product portfolios; (3) include the reinvestment of all dividends and other earnings, estimated trading costs, commissions, or management fees; and, (4) may not reflect prices obtained in an actual funded Navellier Investment Product portfolio. For these and other reasons, the reported performances of model portfolios do not reflect the performance results of Navellier’s actually funded and traded Investment Products. In most cases, Navellier’s Investment Products have materially lower performance results than the performances of the model portfolios presented.
This report contains statements that are, or may be considered to be, forward-looking statements. All statements that are not historical facts, including statements about our beliefs or expectations, are “forward-looking statements” within the meaning of The U.S. Private Securities Litigation Reform Act of 1995. These statements may be identified by such forward-looking terminology as “expect,” “estimate,” “plan,” “intend,” “believe,” “anticipate,” “may,” “will,” “should,” “could,” “continue,” “project,” or similar statements or variations of such terms. Our forward-looking statements are based on a series of expectations, assumptions, and projections, are not guarantees of future results or performance, and involve substantial risks and uncertainty as described in Form ADV Part 2A of our filing with the Securities and Exchange Commission (SEC), which is available at www.adviserinfo.sec.gov or by requesting a copy by emailing info@navellier.com. All of our forward-looking statements are as of the date of this report only. We can give no assurance that such expectations or forward-looking statements will prove to be correct. Actual results may differ materially. You are urged to carefully consider all such factors.
FEDERAL TAX ADVICE DISCLAIMER: As required by U.S. Treasury Regulations, you are informed that, to the extent this presentation includes any federal tax advice, the presentation is not written by Navellier to be used, and cannot be used, for the purpose of avoiding federal tax penalties. Navellier does not advise on any income tax requirements or issues. Use of any information presented by Navellier is for general information only and does not represent tax advice either express or implied. You are encouraged to seek professional tax advice for income tax questions and assistance.
IMPORTANT NEWSLETTER DISCLOSURE:The hypothetical performance results for investment newsletters that are authored or edited by Louis Navellier, including Louis Navellier’s Growth Investor, Louis Navellier’s Breakthrough Stocks, Louis Navellier’s Accelerated Profits, and Louis Navellier’s Platinum Club, are not based on any actual securities trading, portfolio, or accounts, and the newsletters’ reported hypothetical performances should be considered mere “paper” or proforma hypothetical performance results and are not actual performance of real world trades. Navellier & Associates, Inc. does not have any relation to or affiliation with the owner of these newsletters. There are material differences between Navellier Investment Products’ portfolios and the InvestorPlace Media, LLC newsletter portfolios authored by Louis Navellier. The InvestorPlace Media, LLC newsletters contain hypothetical performance that do not include transaction costs, advisory fees, or other fees a client might incur if actual investments and trades were being made by an investor. As a result, newsletter performance should not be used to evaluate Navellier Investment services which are separate and different from the newsletters. The owner of the newsletters is InvestorPlace Media, LLC and any questions concerning the newsletters, including any newsletter advertising or hypothetical Newsletter performance claims, (which are calculated solely by Investor Place Media and not Navellier) should be referred to InvestorPlace Media, LLC at (800) 718-8289.
Please note that Navellier & Associates and the Navellier Private Client Group are managed completely independent of the newsletters owned and published by InvestorPlace Media, LLC and written and edited by Louis Navellier, and investment performance of the newsletters should in no way be considered indicative of potential future investment performance for any Navellier & Associates separately managed account portfolio. Potential investors should consult with their financial advisor before investing in any Navellier Investment Product.
Navellier claims compliance with Global Investment Performance Standards (GIPS). To receive a complete list and descriptions of Navellier’s composites and/or a presentation that adheres to the GIPS standards, please contact Navellier or click here. It should not be assumed that any securities recommendations made by Navellier & Associates, Inc. in the future will be profitable or equal the performance of securities made in this report.
FactSet Disclosure: Navellier does not independently calculate the statistical information included in the attached report. The calculation and the information are provided by FactSet, a company not related to Navellier. Although information contained in the report has been obtained from FactSet and is based on sources Navellier believes to be reliable, Navellier does not guarantee its accuracy, and it may be incomplete or condensed. The report and the related FactSet sourced information are provided on an “as is” basis. The user assumes the entire risk of any use made of this information. Investors should consider the report as only a single factor in making their investment decision. The report is for informational purposes only and is not intended as an offer or solicitation for the purchase or sale of a security. FactSet sourced information is the exclusive property of FactSet. Without prior written permission of FactSet, this information may not be reproduced, disseminated or used to create any financial products. All indices are unmanaged and performance of the indices include reinvestment of dividends and interest income, unless otherwise noted, are not illustrative of any particular investment and an investment cannot be made in any index. Past performance is no guarantee of future results.