by Jason Bodner
July 9, 2024
It is the July 4th weekend, a time to relax and reflect on our country’s independence, and our freedom. A lot has changed since 1776. Our population in 1776 was 2.5 million. It is now an estimated 341,842,492, representing an unbelievable 13,575% gain. Our forefathers didn’t see that coming. They also likely didn’t envision the Freedom Tower in New York City standing at 1776 feet tall, a nod to our freedom.
Like or love the state of our nation these days, it’s ours, and it affords us freedom to determine our own outcomes. With hard work and determination, we can accomplish our dreams. The Land of the Free is also the Land of Opportunity. No one said that it’s easy, but it’s possible.
One of the best opportunities to gain wealth in the U.S. is by investing in stocks. History is speckled with a few rags to riches stories of neophytes who made it big. The story of Dan Zanger comes to mind. He was a pool contractor who transformed $10,000 into $42 million in under two years back in 1998-2000!
History is also replete with stories where people lost their shirts and failed miserably at investing.
I’ve found that the best way to win in any market is to focus on the data and remove emotion from the equation. That way, predictable outcomes can be exploited when you measure your wins against your losses. The key is winning more than losing, and score bigger wins than losses. That is a long-term recipe for success, and a game in which you need not focus on losing; you only need to focus on the process.
July is starting with its expected thin holiday-week trading volume, which is also visible in the slowdown in unusual buys and sells. For starters, notice the wedging pattern of dwindling volume:
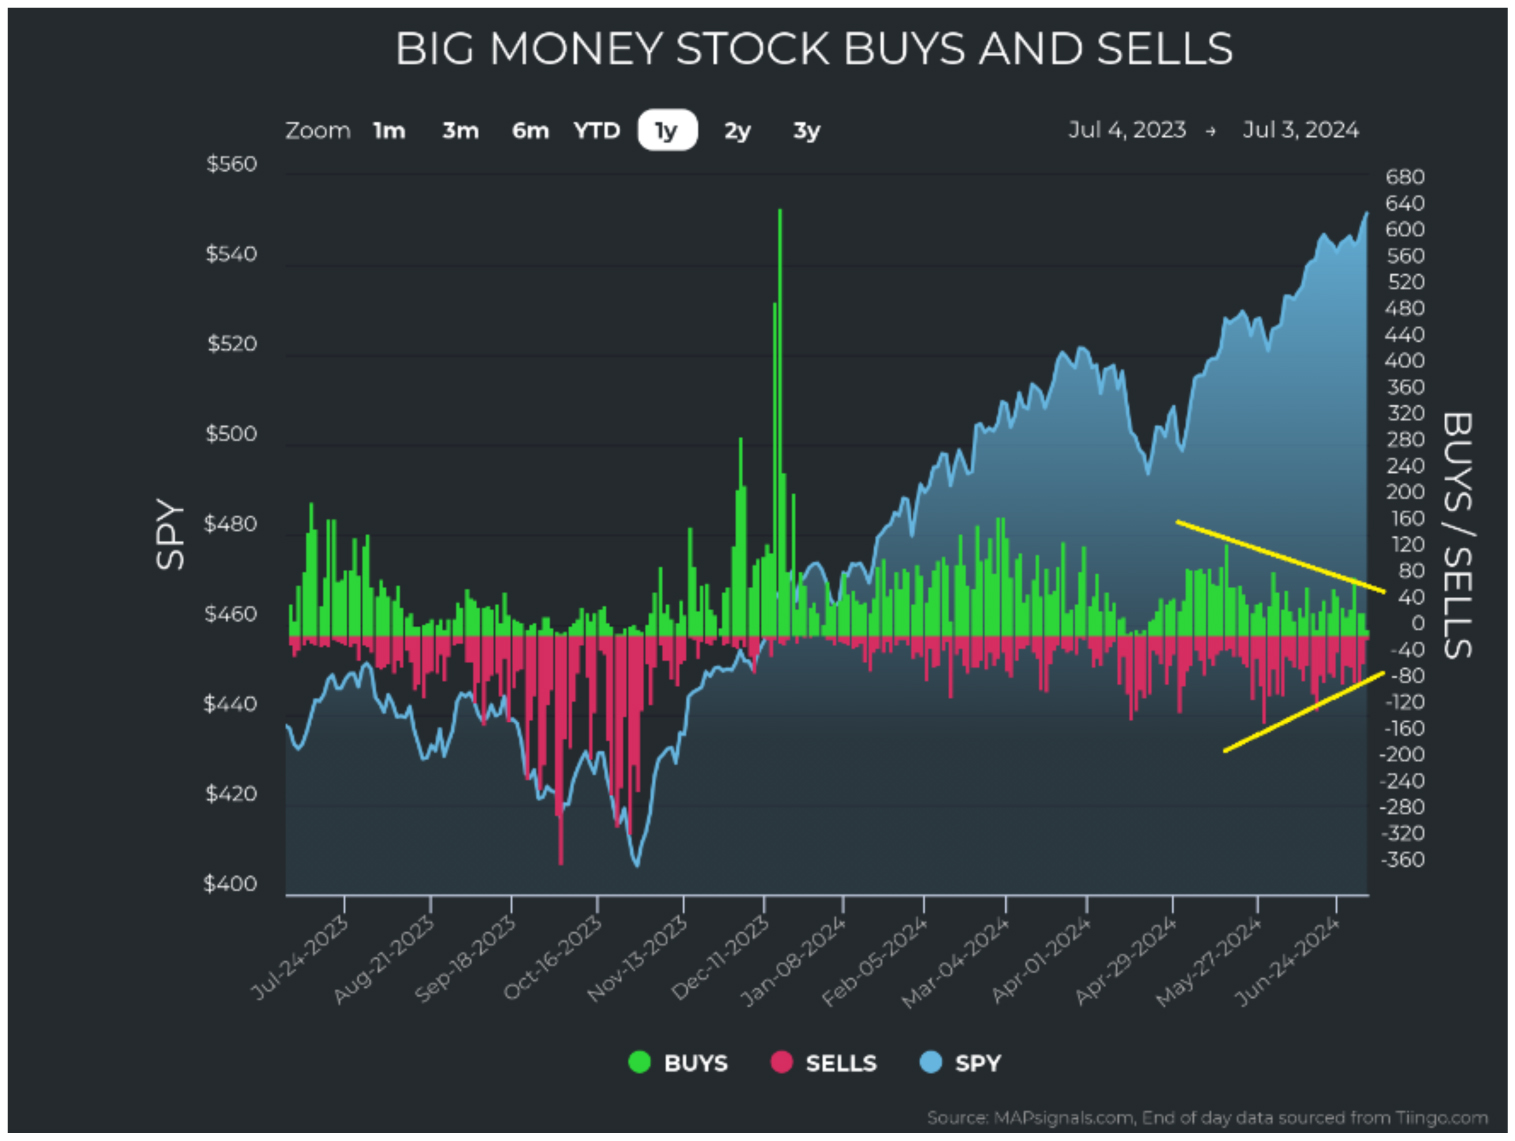
Graphs are for illustrative and discussion purposes only. Please read important disclosures at the end of this commentary.
Falling volume is helping to stabilize the Big Money Index. This is largely due to prior elevated selling rolling off the 25-day moving average. The last six trading days have seen the BMI in a 0.8 point range:
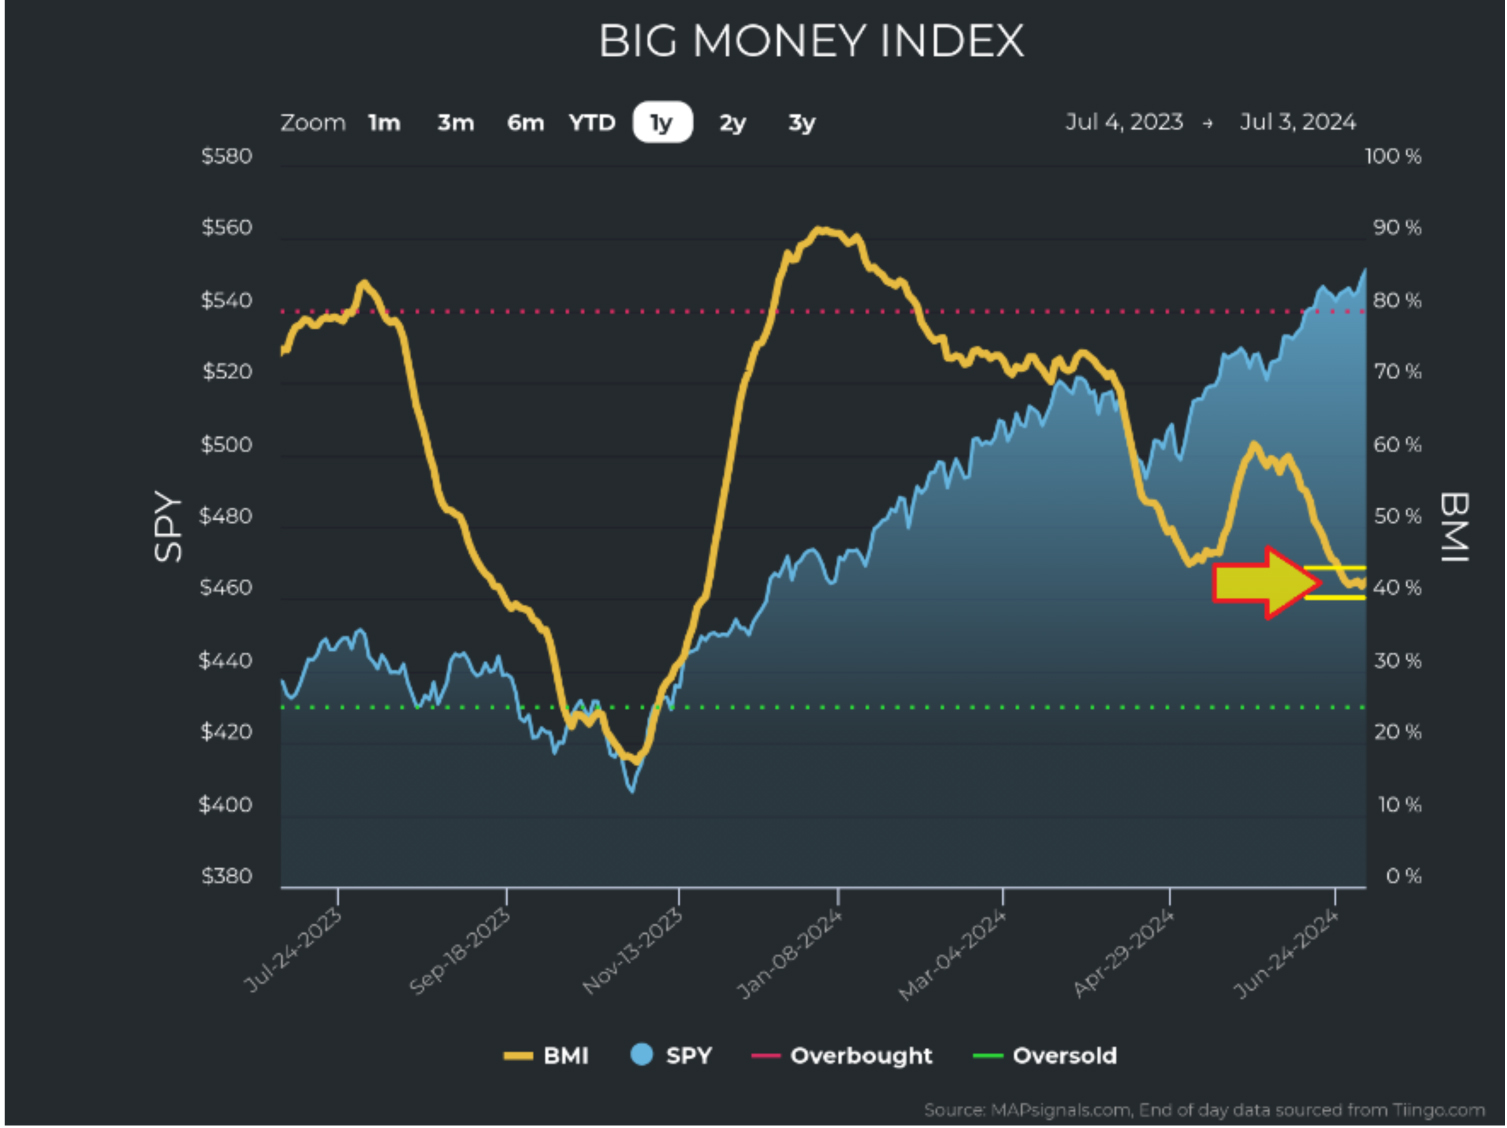
Graphs are for illustrative and discussion purposes only. Please read important disclosures at the end of this commentary.
The BMI fell hard in June, but stocks did not fall with it. In fact, technology stocks did particularly well.
In the following chart of XLK – the SPDR Select Technology Sector ETF – we see the index rising with the upward sloping yellow lines. Notice the recent vanishing of selling:
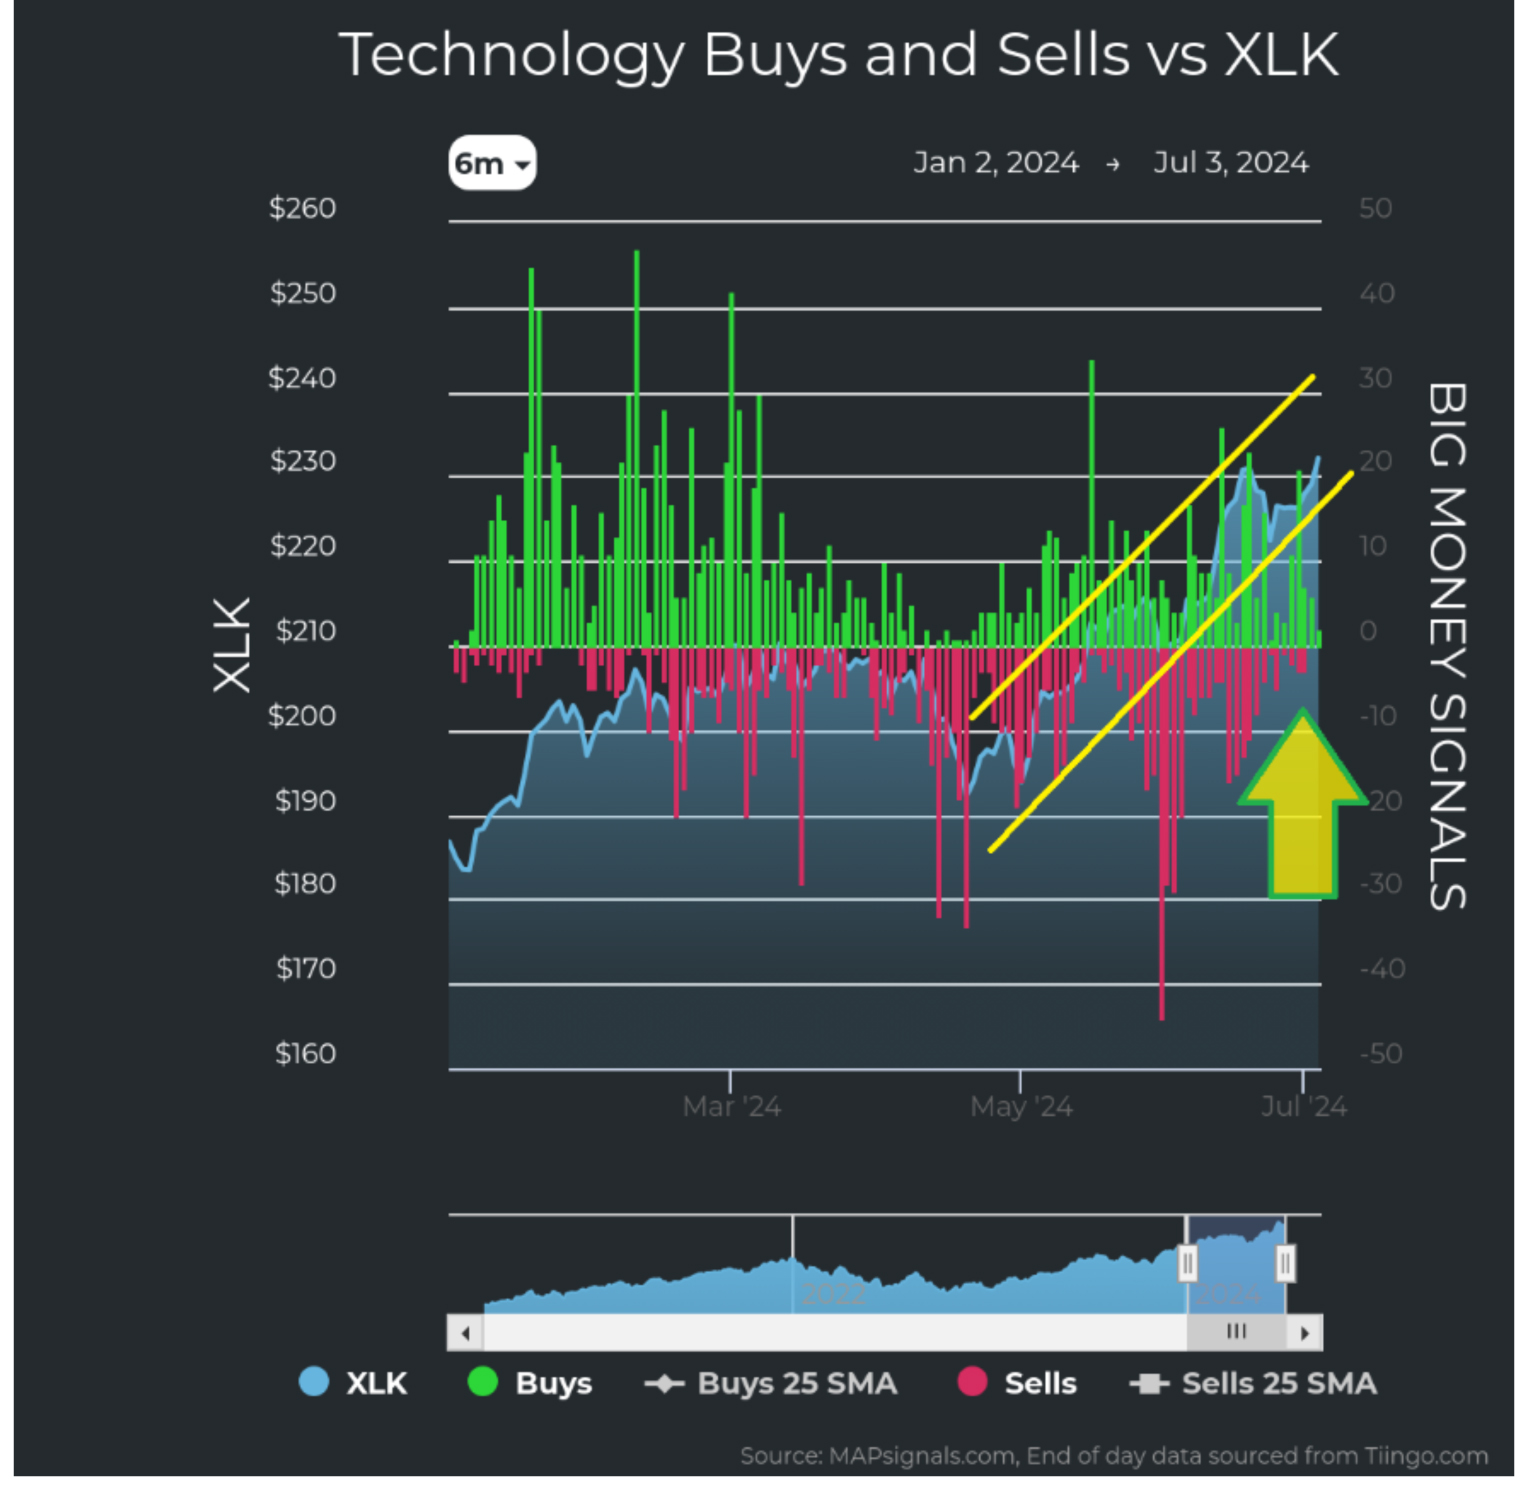
Graphs are for illustrative and discussion purposes only. Please read important disclosures at the end of this commentary.
We can see this action echoed in the following pie charts. On the left, we see how technology was the sector with the most buying. Health Care continues its internal tug of war, simultaneously seeing the second-most buying and the most selling:
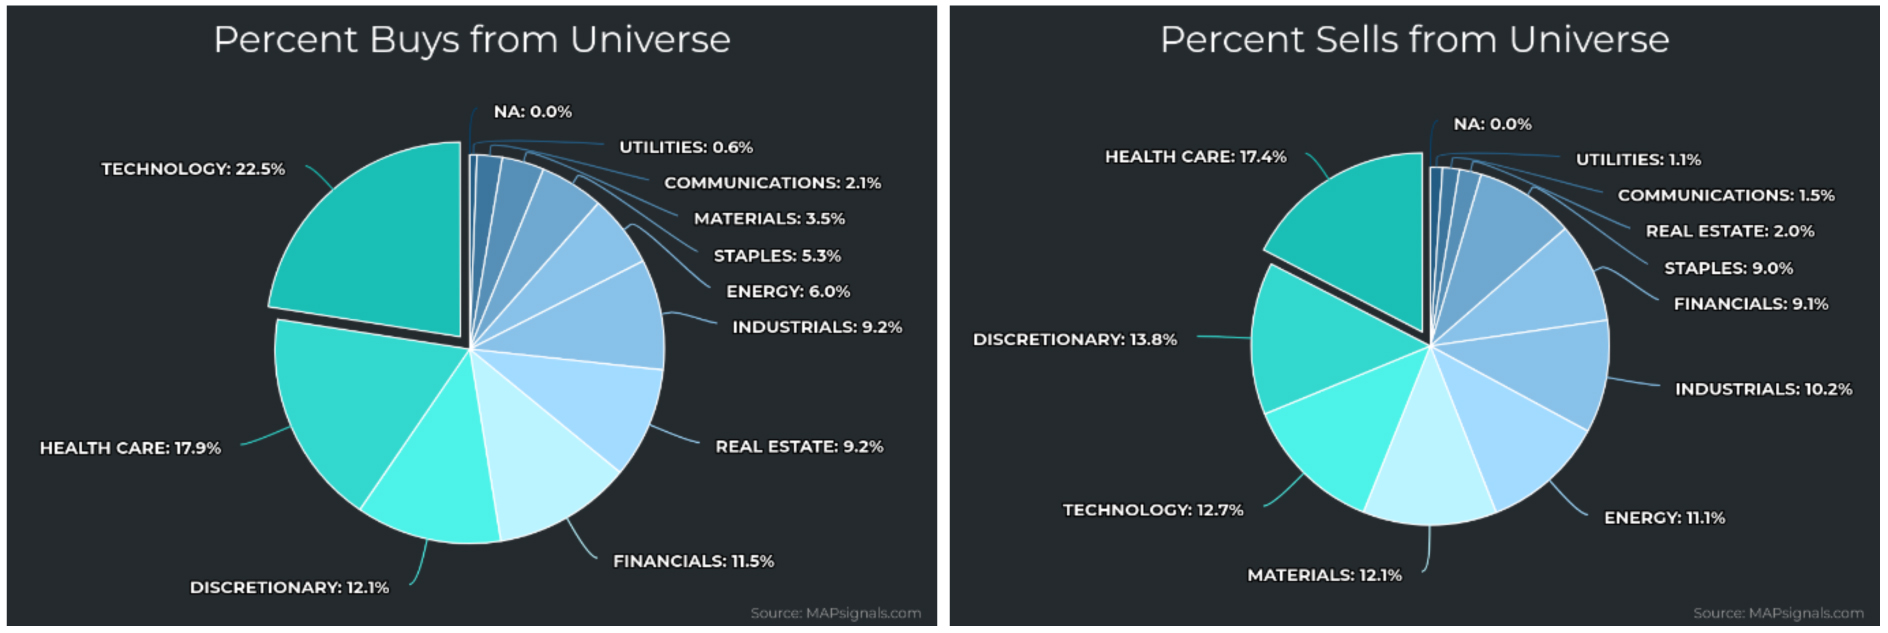
Graphs are for illustrative and discussion purposes only. Please read important disclosures at the end of this commentary.
This price action in technology along with the unusual buying (green lines in the technology chart above) helped propel the index to the top of our sector strength and weakness table:
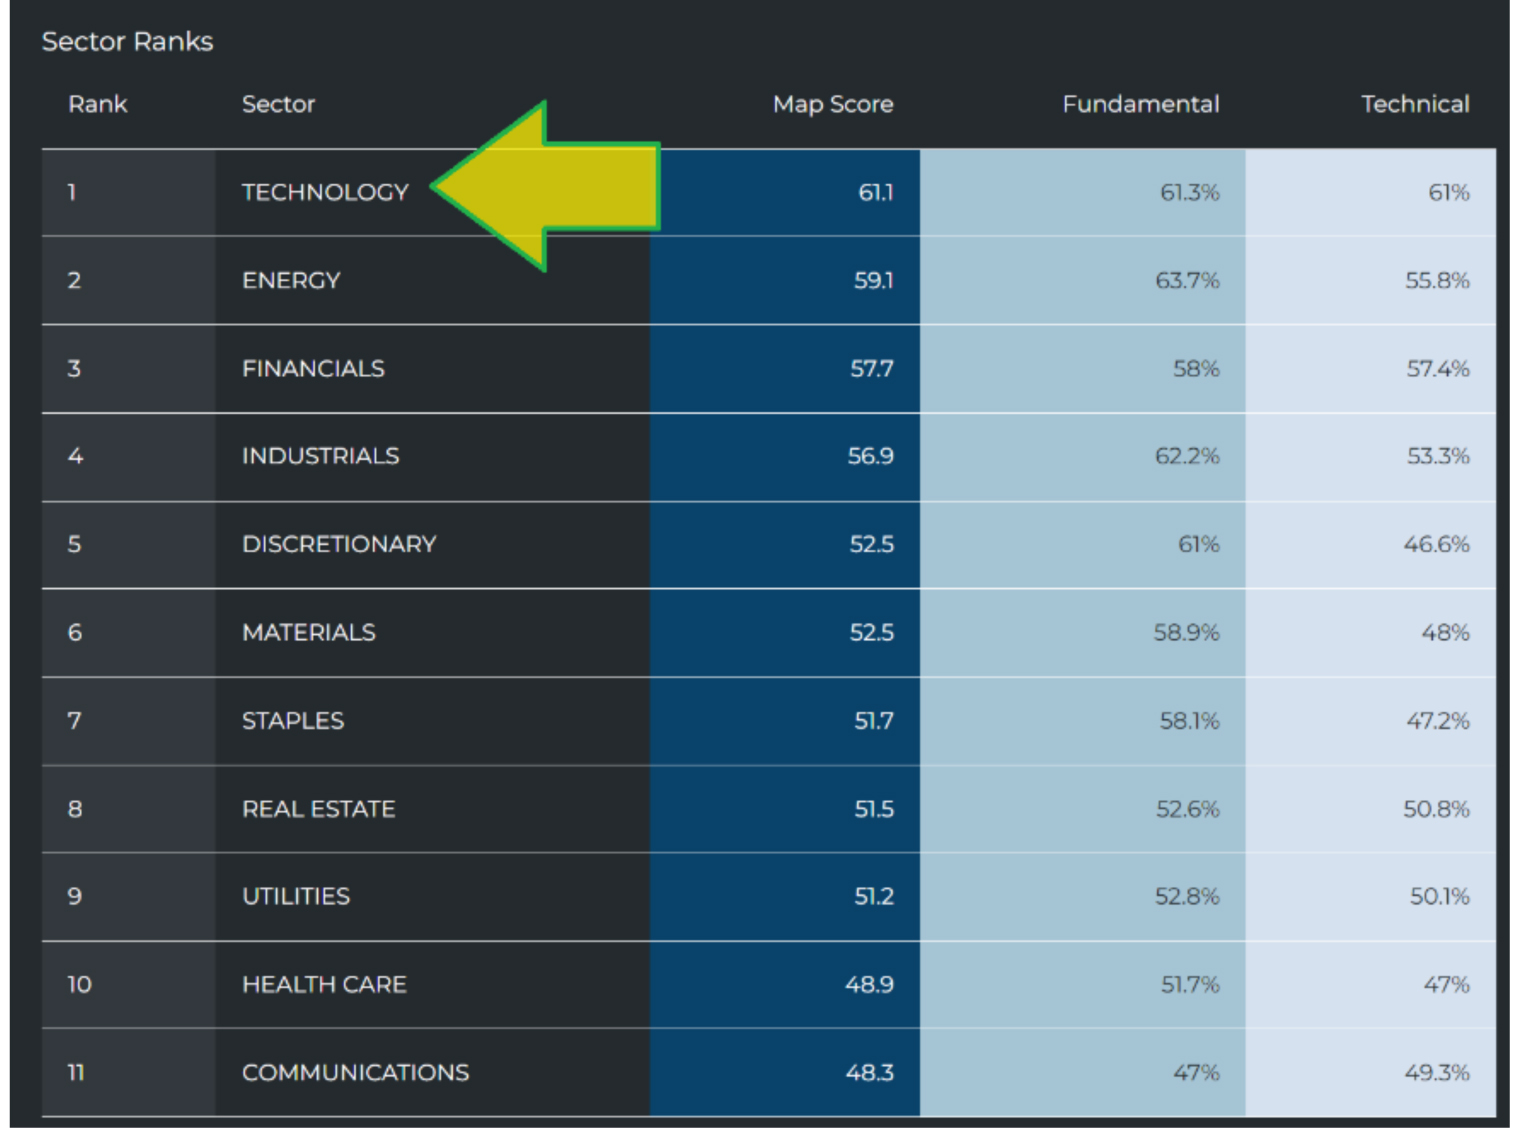
Graphs are for illustrative and discussion purposes only. Please read important disclosures at the end of this commentary.
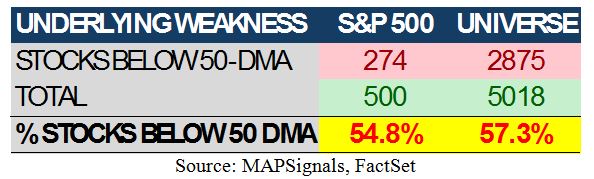
The bad news is that while the S&P 500 has been outperforming the BMI, the stocks that comprise it don’t match the eye test. According to my data, 55% of the stocks in S&P 500 are currently trading below their 50-day moving average. The average market cap for those 274 S&P 500 companies is $55 billion.
And it’s not just happening in the S&P 500 either. Out of the 5,018 stocks that populated the price data in last Friday morning’s data sweep, 2,875 are below their 50-day moving average – that’s 57%.
Graphs are for illustrative and discussion purposes only. Please read important disclosures at the end of this commentary.
So, we are at a crossroads. Dwindling volume, weak breadth, the dog days of summer, and a looming election may be more than this market can take. But before you bail and make an emotional decision, we have some good news for you: July is a great month for stocks, historically speaking. Nothing is ever a slam dunk, but the odds are in our favor for a decent July, stock-wise.
A Look at the Last 34 July Markets – Ending in a Winning Streak
Here, we see each July since 1990 and the respective month-long returns for each of the four main stock indexes. The first thing you notice is a lot of green. Green is good! The next thing you’ll notice is the red – the bad Julys – mostly clump around some particularly rough historical periods: 1998-2002 was an especially volatile time for stocks. It encompassed the Internet bubble, 9/11, and the subsequent collapses of some titans of industry. Enron and WorldCom come to mind. Then, 2007 was when cracks appeared again, leading to the Great Financial Crisis. Then we see 2011 and 2014 exhibiting unusual volatility.
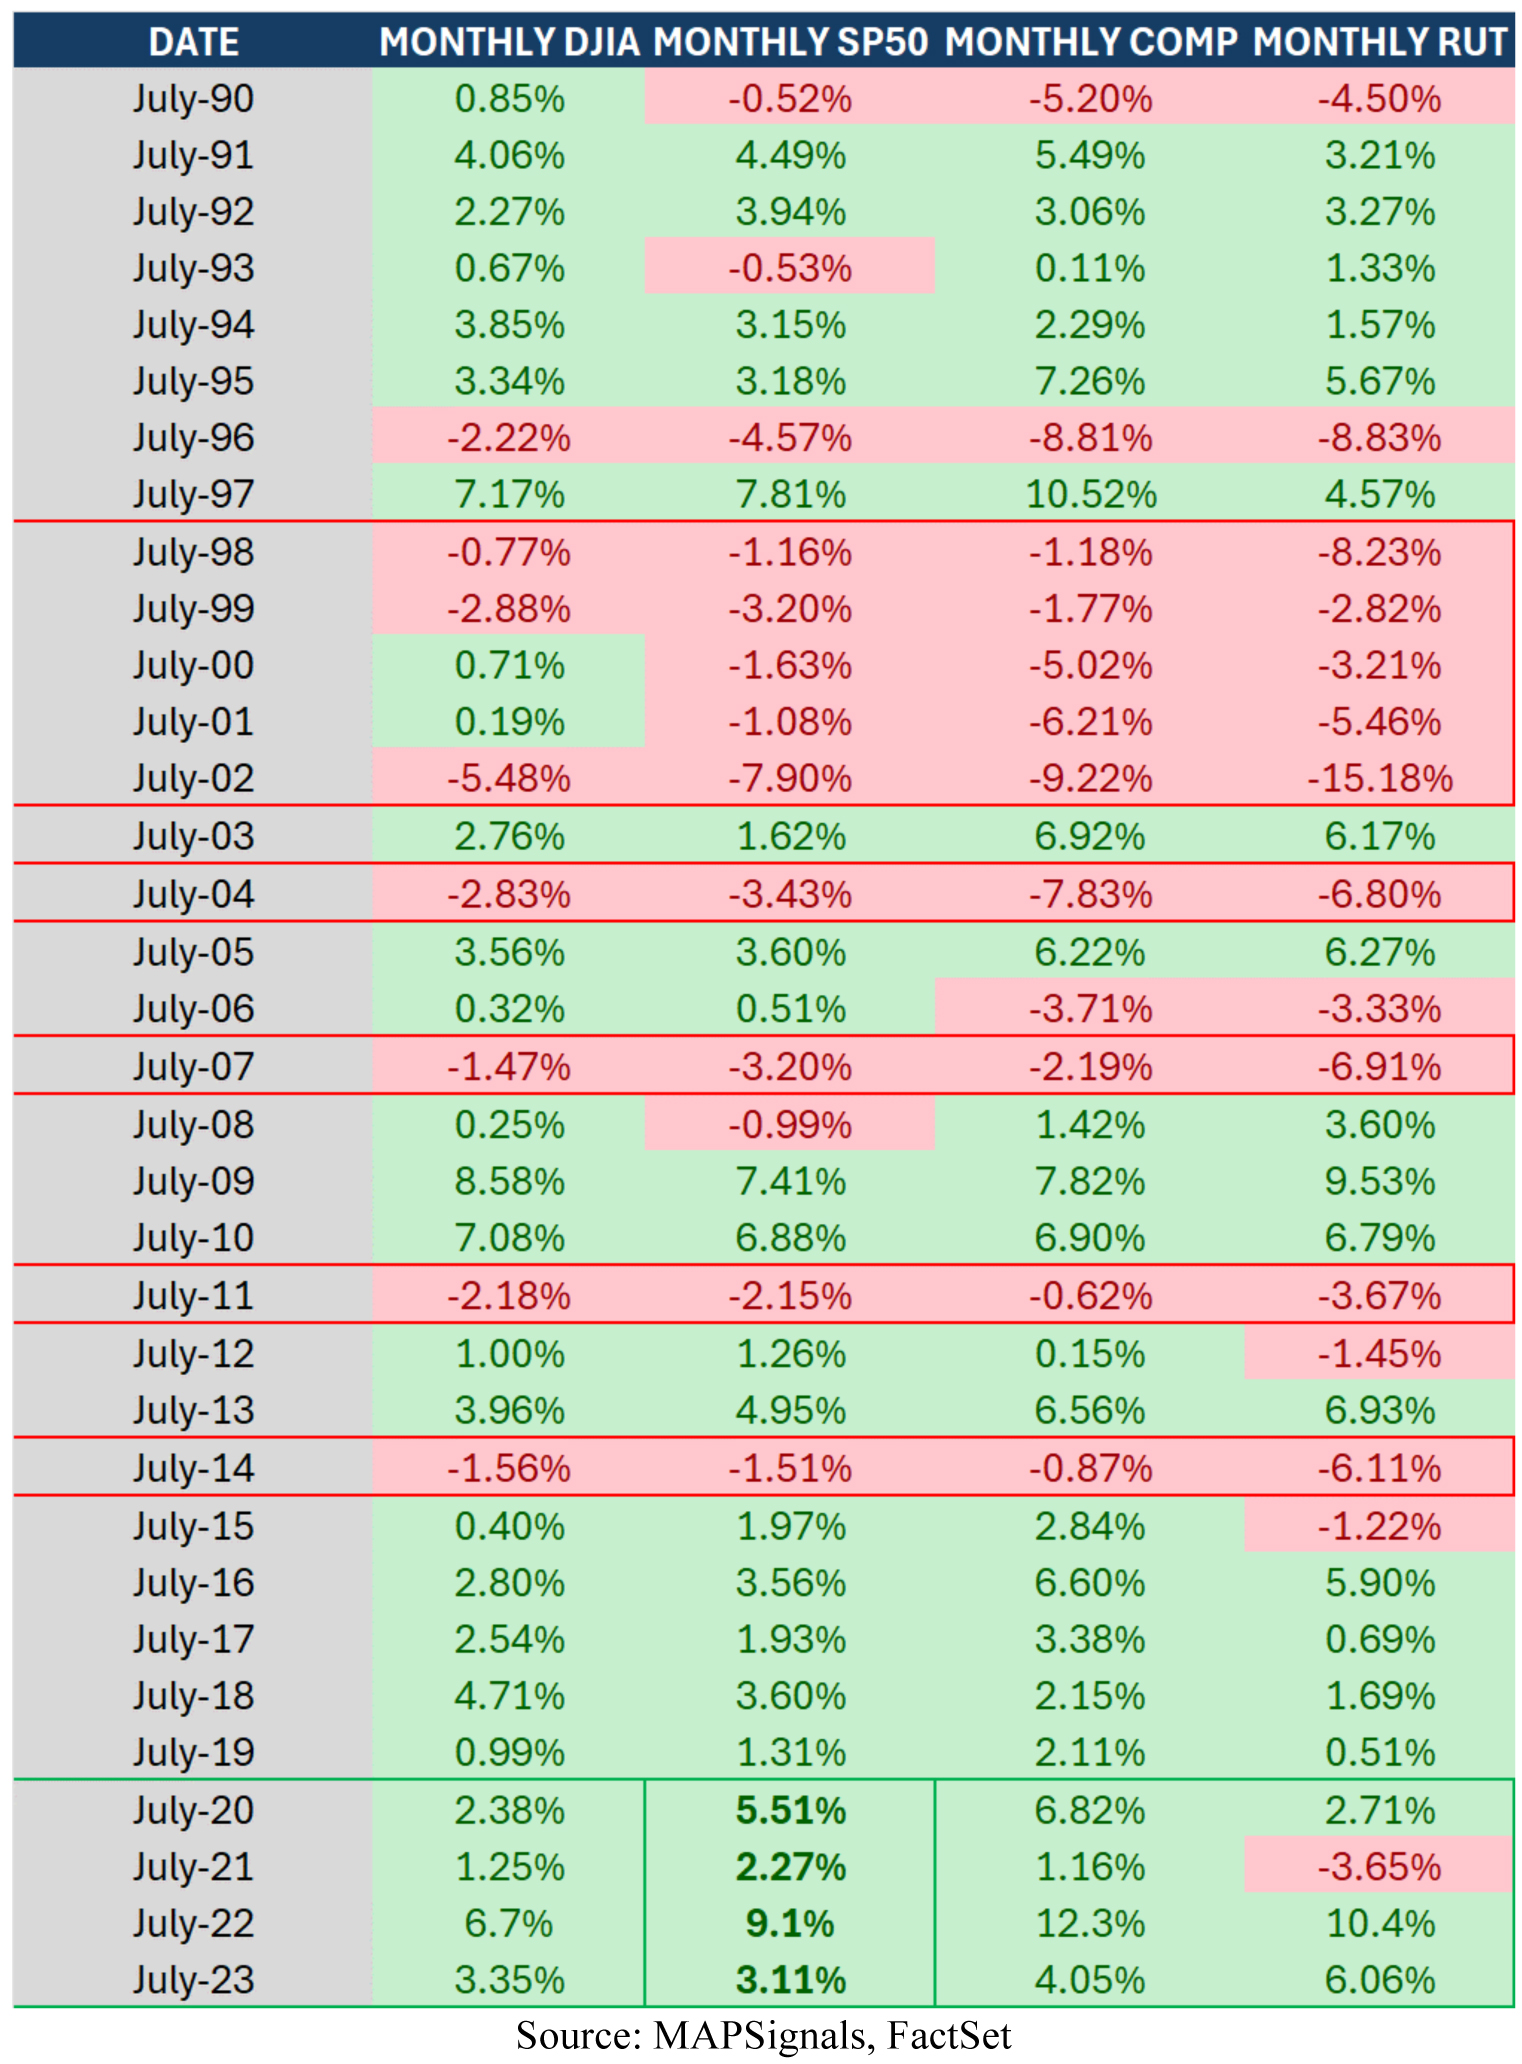
Graphs are for illustrative and discussion purposes only. Please read important disclosures at the end of this commentary.
The last nine July markets have been positive, and I’d like you to notice that the last four Julys have been tremendous, averaging 5% for the S&P 500 and over 6% for the NASDAQ Composite!
Let’s take it one step further… For the past 34 years, July has been a positive month about 65% of the time, with an average return of about 1.5% for the Dow, S&P, and NASDAQ.
Now let’s look at the positive Julys. Naturally we can’t exclude rough patches in the market, but if we have a nearly 70% chance of a good July, the average positive July delivers gains of about 4%.
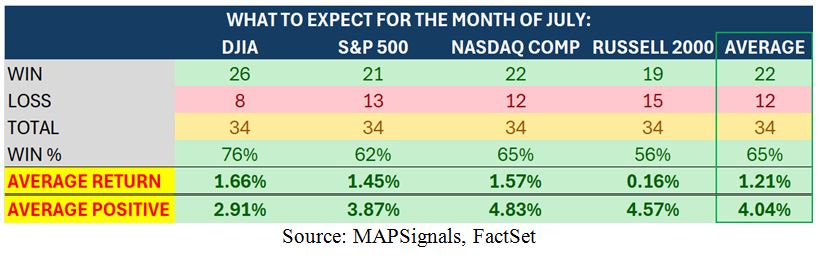
Graphs are for illustrative and discussion purposes only. Please read important disclosures at the end of this commentary.
Now, back to the BMI. If we get any sustained buying, we can expect a ramp in the BMI. And if we get buying in those 274 under-performing stocks in the S&P 500, the average size being $55 billion, breadth will greatly improve. In short, despite the S&P 500 being at highs, there is a case for it to go higher! On the flip-side, should capital flow out of the mega-cap leaders, we could see pressure, as it is cap weighted.
The market is in a lull, under the surface, much like a sailboat that hits a glassy patch of water with no wind. What comes next is anyone’s guess, but using history as our guide, we might expect a solid July.
“External things are not the problem. It’s your assessment of them. Which you can erase right now.”
-– Marcus Aurelius
All content above represents the opinion of Jason Bodner of Navellier & Associates, Inc.
Also In This Issue
A Look Ahead by Louis Navellier
Why the Monthly Jobs Report is Often Misleading (or At Least Premature)
Income Mail by Bryan Perry
Energy-Based Income Provides for High Yield Inflation Hedges
Growth Mail by Gary Alexander
Clear-Eyed Optimists Convene at Freedom Fest This Week
Global Mail by Ivan Martchev
Macron’s Gamble Pays Off
Sector Spotlight by Jason Bodner
July Has Delivered Nine Straight Gains – Will This July Be #10?
View Full Archive
Read Past Issues Here

Jason Bodner
MARKETMAIL EDITOR FOR SECTOR SPOTLIGHT
Jason Bodner writes Sector Spotlight in the weekly Marketmail publication and has authored several white papers for the company. He is also Co-Founder of Macro Analytics for Professionals which produces proprietary equity accumulation/distribution research for its clients. Previously, Mr. Bodner served as Director of European Equity Derivatives for Cantor Fitzgerald Europe in London, then moved to the role of Head of Equity Derivatives North America for the same company in New York. He also served as S.V.P. Equity Derivatives for Jefferies, LLC. He received a B.S. in business administration in 1996, with honors, from Skidmore College as a member of the Periclean Honors Society. All content of “Sector Spotlight” represents the opinion of Jason Bodner
Important Disclosures:
Jason Bodner is a co-founder and co-owner of Mapsignals. Mr. Bodner is an independent contractor who is occasionally hired by Navellier & Associates to write an article and or provide opinions for possible use in articles that appear in Navellier & Associates weekly Market Mail. Mr. Bodner is not employed or affiliated with Louis Navellier, Navellier & Associates, Inc., or any other Navellier owned entity. The opinions and statements made here are those of Mr. Bodner and not necessarily those of any other persons or entities. This is not an endorsement, or solicitation or testimonial or investment advice regarding the BMI Index or any statements or recommendations or analysis in the article or the BMI Index or Mapsignals or its products or strategies.
Although information in these reports has been obtained from and is based upon sources that Navellier believes to be reliable, Navellier does not guarantee its accuracy and it may be incomplete or condensed. All opinions and estimates constitute Navellier’s judgment as of the date the report was created and are subject to change without notice. These reports are for informational purposes only and are not a solicitation for the purchase or sale of a security. Any decision to purchase securities mentioned in these reports must take into account existing public information on such securities or any registered prospectus.To the extent permitted by law, neither Navellier & Associates, Inc., nor any of its affiliates, agents, or service providers assumes any liability or responsibility nor owes any duty of care for any consequences of any person acting or refraining to act in reliance on the information contained in this communication or for any decision based on it.
Past performance is no indication of future results. Investment in securities involves significant risk and has the potential for partial or complete loss of funds invested. It should not be assumed that any securities recommendations made by Navellier. in the future will be profitable or equal the performance of securities made in this report. Dividend payments are not guaranteed. The amount of a dividend payment, if any, can vary over time and issuers may reduce dividends paid on securities in the event of a recession or adverse event affecting a specific industry or issuer.
None of the stock information, data, and company information presented herein constitutes a recommendation by Navellier or a solicitation to buy or sell any securities. Any specific securities identified and described do not represent all of the securities purchased, sold, or recommended for advisory clients. The holdings identified do not represent all of the securities purchased, sold, or recommended for advisory clients and the reader should not assume that investments in the securities identified and discussed were or will be profitable.
Information presented is general information that does not take into account your individual circumstances, financial situation, or needs, nor does it present a personalized recommendation to you. Individual stocks presented may not be suitable for every investor. Investment in securities involves significant risk and has the potential for partial or complete loss of funds invested. Investment in fixed income securities has the potential for the investment return and principal value of an investment to fluctuate so that an investor’s holdings, when redeemed, may be worth less than their original cost.
One cannot invest directly in an index. Index is unmanaged and index performance does not reflect deduction of fees, expenses, or taxes. Presentation of Index data does not reflect a belief by Navellier that any stock index constitutes an investment alternative to any Navellier equity strategy or is necessarily comparable to such strategies. Among the most important differences between the Indices and Navellier strategies are that the Navellier equity strategies may (1) incur material management fees, (2) concentrate its investments in relatively few stocks, industries, or sectors, (3) have significantly greater trading activity and related costs, and (4) be significantly more or less volatile than the Indices.
ETF Risk: We may invest in exchange traded funds (“ETFs”) and some of our investment strategies are generally fully invested in ETFs. Like traditional mutual funds, ETFs charge asset-based fees, but they generally do not charge initial sales charges or redemption fees and investors typically pay only customary brokerage fees to buy and sell ETF shares. The fees and costs charged by ETFs held in client accounts will not be deducted from the compensation the client pays Navellier. ETF prices can fluctuate up or down, and a client account could lose money investing in an ETF if the prices of the securities owned by the ETF go down. ETFs are subject to additional risks:
- ETF shares may trade above or below their net asset value;
- An active trading market for an ETF’s shares may not develop or be maintained;
- The value of an ETF may be more volatile than the underlying portfolio of securities the ETF is designed to track;
- The cost of owning shares of the ETF may exceed those a client would incur by directly investing in the underlying securities; and
- Trading of an ETF’s shares may be halted if the listing exchange’s officials deem it appropriate, the shares are delisted from the exchange, or the activation of market-wide “circuit breakers” (which are tied to large decreases in stock prices) halts stock trading generally.
Grader Disclosures: Investment in equity strategies involves substantial risk and has the potential for partial or complete loss of funds invested. The sample portfolio and any accompanying charts are for informational purposes only and are not to be construed as a solicitation to buy or sell any financial instrument and should not be relied upon as the sole factor in an investment making decision. As a matter of normal and important disclosures to you, as a potential investor, please consider the following: The performance presented is not based on any actual securities trading, portfolio, or accounts, and the reported performance of the A, B, C, D, and F portfolios (collectively the “model portfolios”) should be considered mere “paper” or pro forma performance results based on Navellier’s research.
Investors evaluating any of Navellier & Associates, Inc.’s, (or its affiliates’) Investment Products must not use any information presented here, including the performance figures of the model portfolios, in their evaluation of any Navellier Investment Products. Navellier Investment Products include the firm’s mutual funds and managed accounts. The model portfolios, charts, and other information presented do not represent actual funded trades and are not actual funded portfolios. There are material differences between Navellier Investment Products’ portfolios and the model portfolios, research, and performance figures presented here. The model portfolios and the research results (1) may contain stocks or ETFs that are illiquid and difficult to trade; (2) may contain stock or ETF holdings materially different from actual funded Navellier Investment Product portfolios; (3) include the reinvestment of all dividends and other earnings, estimated trading costs, commissions, or management fees; and, (4) may not reflect prices obtained in an actual funded Navellier Investment Product portfolio. For these and other reasons, the reported performances of model portfolios do not reflect the performance results of Navellier’s actually funded and traded Investment Products. In most cases, Navellier’s Investment Products have materially lower performance results than the performances of the model portfolios presented.
This report contains statements that are, or may be considered to be, forward-looking statements. All statements that are not historical facts, including statements about our beliefs or expectations, are “forward-looking statements” within the meaning of The U.S. Private Securities Litigation Reform Act of 1995. These statements may be identified by such forward-looking terminology as “expect,” “estimate,” “plan,” “intend,” “believe,” “anticipate,” “may,” “will,” “should,” “could,” “continue,” “project,” or similar statements or variations of such terms. Our forward-looking statements are based on a series of expectations, assumptions, and projections, are not guarantees of future results or performance, and involve substantial risks and uncertainty as described in Form ADV Part 2A of our filing with the Securities and Exchange Commission (SEC), which is available at www.adviserinfo.sec.gov or by requesting a copy by emailing info@navellier.com. All of our forward-looking statements are as of the date of this report only. We can give no assurance that such expectations or forward-looking statements will prove to be correct. Actual results may differ materially. You are urged to carefully consider all such factors.
FEDERAL TAX ADVICE DISCLAIMER: As required by U.S. Treasury Regulations, you are informed that, to the extent this presentation includes any federal tax advice, the presentation is not written by Navellier to be used, and cannot be used, for the purpose of avoiding federal tax penalties. Navellier does not advise on any income tax requirements or issues. Use of any information presented by Navellier is for general information only and does not represent tax advice either express or implied. You are encouraged to seek professional tax advice for income tax questions and assistance.
IMPORTANT NEWSLETTER DISCLOSURE:The hypothetical performance results for investment newsletters that are authored or edited by Louis Navellier, including Louis Navellier’s Growth Investor, Louis Navellier’s Breakthrough Stocks, Louis Navellier’s Accelerated Profits, and Louis Navellier’s Platinum Club, are not based on any actual securities trading, portfolio, or accounts, and the newsletters’ reported hypothetical performances should be considered mere “paper” or proforma hypothetical performance results and are not actual performance of real world trades. Navellier & Associates, Inc. does not have any relation to or affiliation with the owner of these newsletters. There are material differences between Navellier Investment Products’ portfolios and the InvestorPlace Media, LLC newsletter portfolios authored by Louis Navellier. The InvestorPlace Media, LLC newsletters contain hypothetical performance that do not include transaction costs, advisory fees, or other fees a client might incur if actual investments and trades were being made by an investor. As a result, newsletter performance should not be used to evaluate Navellier Investment services which are separate and different from the newsletters. The owner of the newsletters is InvestorPlace Media, LLC and any questions concerning the newsletters, including any newsletter advertising or hypothetical Newsletter performance claims, (which are calculated solely by Investor Place Media and not Navellier) should be referred to InvestorPlace Media, LLC at (800) 718-8289.
Please note that Navellier & Associates and the Navellier Private Client Group are managed completely independent of the newsletters owned and published by InvestorPlace Media, LLC and written and edited by Louis Navellier, and investment performance of the newsletters should in no way be considered indicative of potential future investment performance for any Navellier & Associates separately managed account portfolio. Potential investors should consult with their financial advisor before investing in any Navellier Investment Product.
Navellier claims compliance with Global Investment Performance Standards (GIPS). To receive a complete list and descriptions of Navellier’s composites and/or a presentation that adheres to the GIPS standards, please contact Navellier or click here. It should not be assumed that any securities recommendations made by Navellier & Associates, Inc. in the future will be profitable or equal the performance of securities made in this report.
FactSet Disclosure: Navellier does not independently calculate the statistical information included in the attached report. The calculation and the information are provided by FactSet, a company not related to Navellier. Although information contained in the report has been obtained from FactSet and is based on sources Navellier believes to be reliable, Navellier does not guarantee its accuracy, and it may be incomplete or condensed. The report and the related FactSet sourced information are provided on an “as is” basis. The user assumes the entire risk of any use made of this information. Investors should consider the report as only a single factor in making their investment decision. The report is for informational purposes only and is not intended as an offer or solicitation for the purchase or sale of a security. FactSet sourced information is the exclusive property of FactSet. Without prior written permission of FactSet, this information may not be reproduced, disseminated or used to create any financial products. All indices are unmanaged and performance of the indices include reinvestment of dividends and interest income, unless otherwise noted, are not illustrative of any particular investment and an investment cannot be made in any index. Past performance is no guarantee of future results.