by Bryan Perry
July 9, 2024
Following the latest employment data, released last Friday, the S&P 500 and NASDAQ traded to new all-time highs, but the same jobs report also stoked concerns about lower earnings growth in the event that softening labor market conditions translates into lower consumer spending.
Omitting government jobs, private sector payrolls were up just 136,000, and average hourly earnings growth decelerated to 3.9% (from 4.1%) on a year-over-year basis. The unemployment rate pushed up to 4.1% from 4.0%, and those unemployed for 27 weeks or more accounted for 22.2% of the unemployed versus 20.7% in May, suggesting that the job market has made it harder to find suitable work quickly.
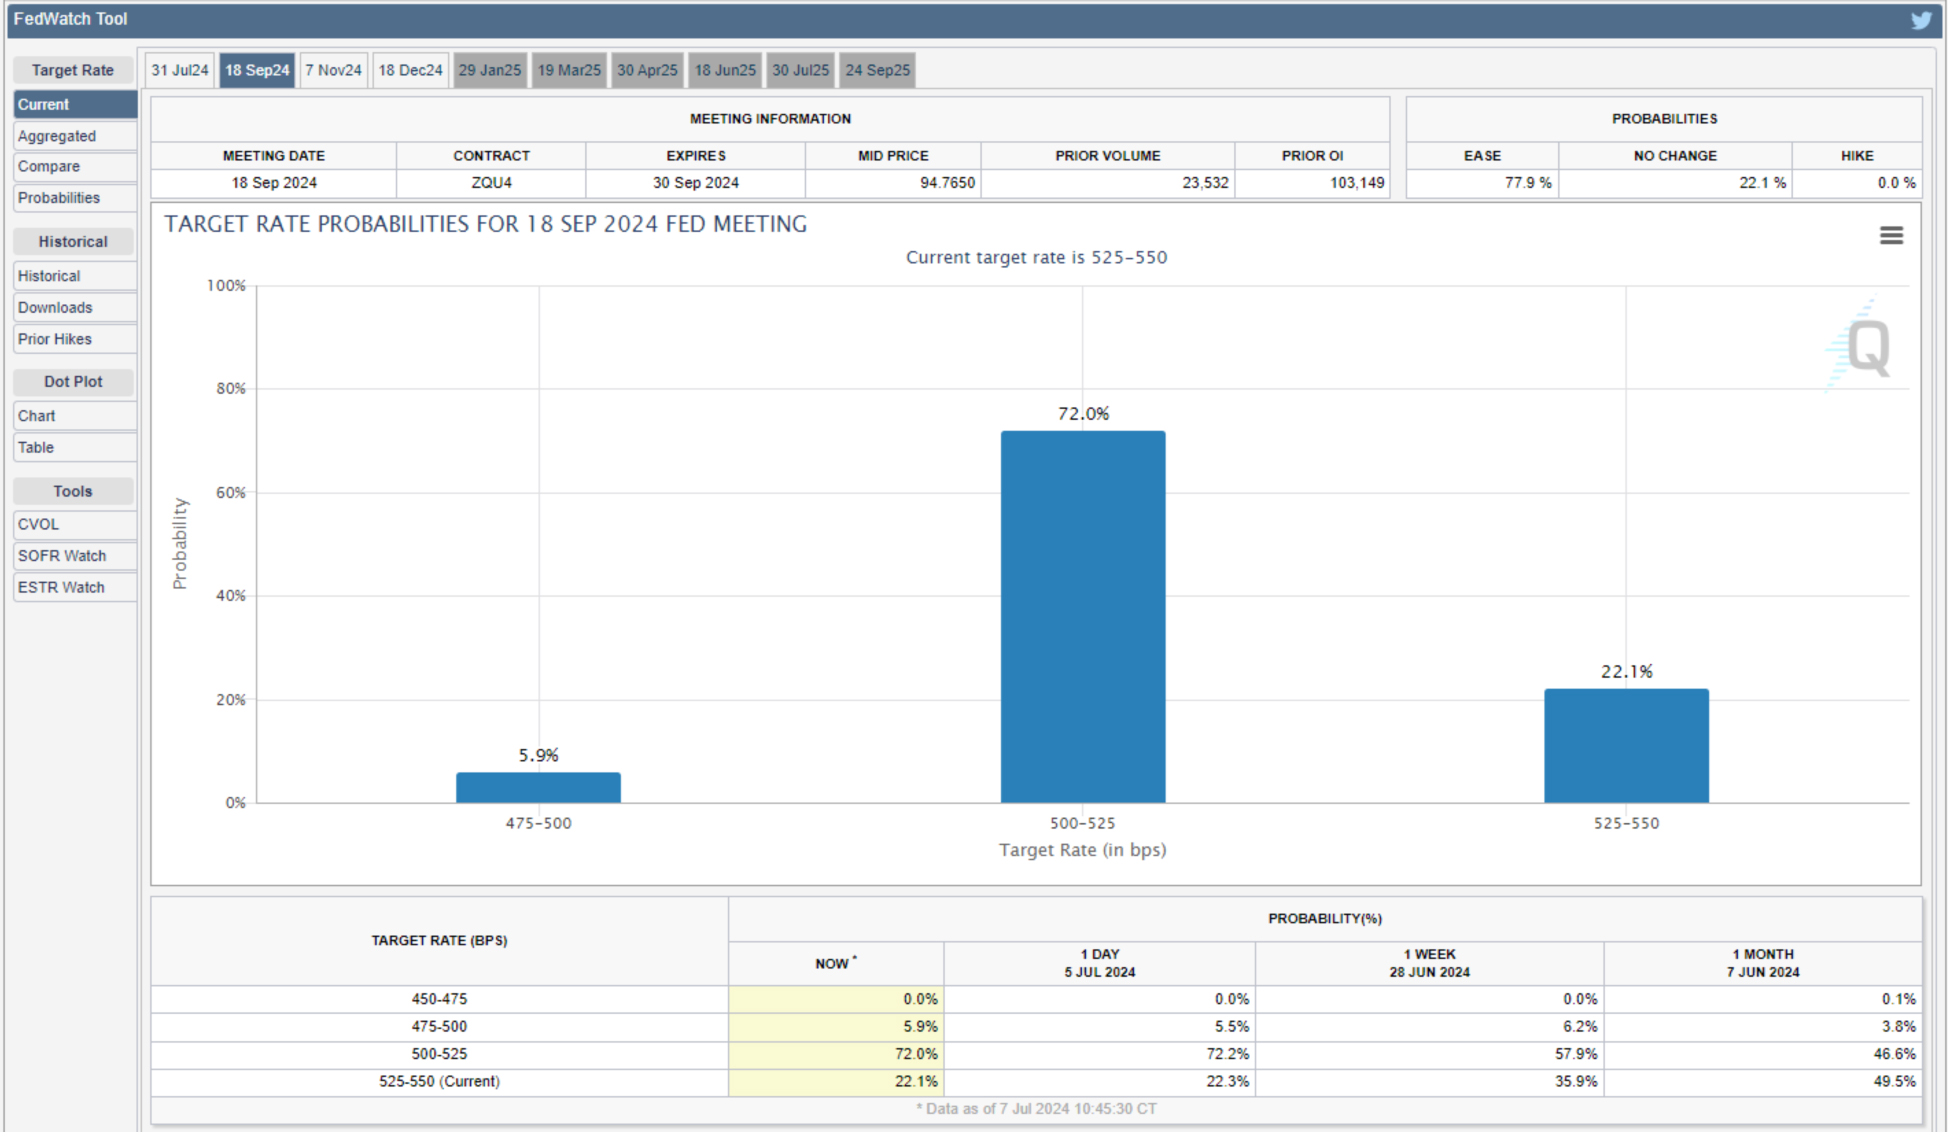
While there is a 92% probability that the Fed will stand pat on interest rates at its July 31 FOMC meeting, the odds of a rate cut in September have jumped to 72% from 58% a week ago. Bond market sentiment is starting to believe the Fed has enough evidence to begin easing, but the September 18 FOMC meeting is not exactly “just around the corner,” and much can happen to derail this hopeful rate cut expectation.
Graphs are for illustrative and discussion purposes only. Please read important disclosures at the end of this commentary.
As of July 5, the price of WTI crude was just over $83 per barrel heading into the heart of the summer travel season. At the beginning of 2024, the price of crude was $71.65, rising over 16% so far this year.
The extended production cuts implemented by OPEC+ amount to a reduction of 2.2 million barrels per day. In addition, attacks on merchant ships in the Red Sea have disrupted supply, forcing tankers to take longer trade routes. Ukrainian attacks on Russia’s refining infrastructure, and a healthy U.S. economy driving strong demand are also contributing to the recent rise in crude oil prices.
As a result of these and other factors, Bank of America energy analysts predict a global oil deficit of up to 450,000 barrels per day during the third quarter. They say that this could push oil prices as high as $95 a barrel as robust demand meets a shrinking supply. BofA is not alone in their assessment of market conditions. Back in late March, the International Energy Agency predicted that worldwide oil supplies could fall short of demand by 300,000 barrels per day this year, making oil trade at $83, today’s price.
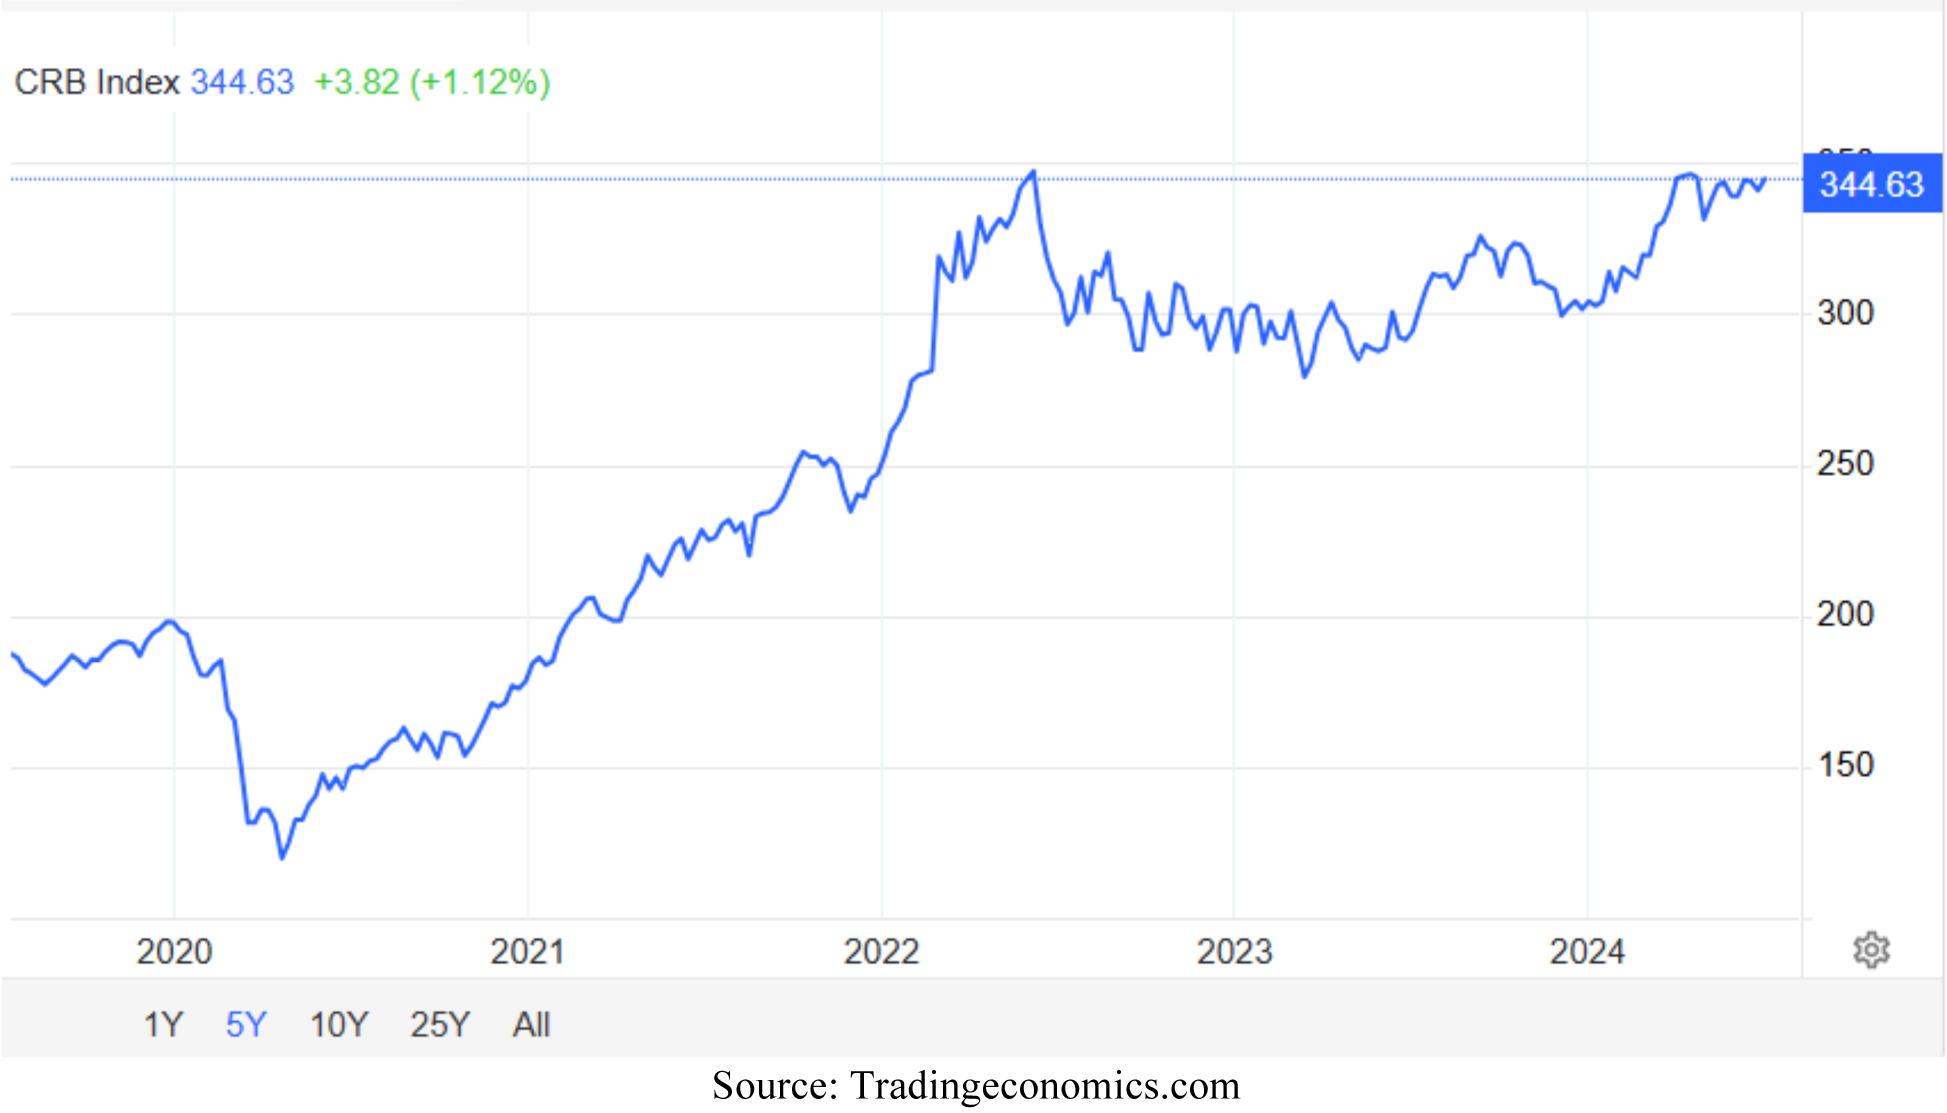
Rising energy prices raise the risk of household inflation remaining stubbornly high going into the fall elections. The Commodities Research Bureau (CRB) index is a representative indicator that measures the aggregate price of various commodity sectors comprising 19 commodities with the following sector allocations: Agriculture (41%), Energy (39%), Industrial Metals (13%) and Precious Metals (7%).
Although not included in the core CPI data, various food groups are rising fast: The year-over-year price of eggs is up 119%, poultry is up by 28%, potatoes by 33%, butter by 42%, tea by 22%, cocoa by 138%, coffee by 42%, orange juice by 52%, milk by 41% and cheese by 27%. Within the headline CPI, food (+13.4%) and energy (+7.0%) account for just 20% of the total weight allocations, while the CRB weights food and energy at 80%. The core CPI excludes food and energy, so to say that inflation is coming down doesn’t line up with the chart of the CRB index that is on the verge of breaking out to a new 5-year high.
Graphs are for illustrative and discussion purposes only. Please read important disclosures at the end of this commentary.
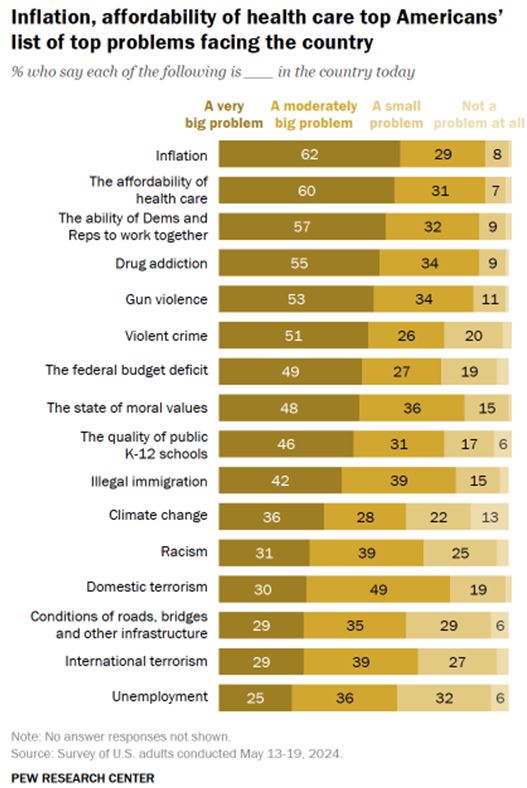
The Bureau of Labor Statistics (BLS) and the Council of Economic Advisors (CEA) that serve the Office of the President may prefer to interpret the recent data as disinflationary, but it is my view they are cherry picking what fits their political goals and thereby fail to lay out the broader range of inflationary pressures and the direct impact it is having on the majority of Americans. A recent survey by Pew Research showed that inflation topped the list of all problems facing the nation, with affordable healthcare not far behind.
Graphs are for illustrative and discussion purposes only. Please read important disclosures at the end of this commentary.
Investors that are of the view that “real inflation” will indeed be “higher for longer” may want to consider the domestic energy infrastructure sector as a way to own U.S. energy assets that pay inflation-beating yields. A simple way to own pipelines, processing plants, and storage facilities that serve the oil, natural gas, and liquids markets is to invest in energy Master Limited Partnership (MLP) ETFs that own a basket of leading MLPs and also convert the K-1 income received into 1099 income that is paid out to shareholders.
The largest of these energy infrastructure ETFs is the Alerian MLP ETF (AMLP), with $8.8 billion in assets. It pays a current yield of $7.33% on a quarterly basis and has returned 18% year to date.
For investors who want monthly income, consider the Infra-Cap MLP ETF (AMZA) with $405 million in assets. It pays a current yield of 7.24% and has returned 23% year to date. Both ETFs have bullish charts, reflecting the bullish fundamentals and reliable distribution coverage. So, while the government is telling us they are winning the battle against inflation, the kitchen table hard data for most Americans would argue otherwise. In the meantime, some high yield energy infrastructure-based income might be just the ticket to help manage through a long hot summer of higher prices for just about everything.
All content above represents the opinion of Bryan Perry of Navellier & Associates, Inc.
Also In This Issue
A Look Ahead by Louis Navellier
Why the Monthly Jobs Report is Often Misleading (or At Least Premature)
Income Mail by Bryan Perry
Energy-Based Income Provides for High Yield Inflation Hedges
Growth Mail by Gary Alexander
Clear-Eyed Optimists Convene at Freedom Fest This Week
Global Mail by Ivan Martchev
Macron’s Gamble Pays Off
Sector Spotlight by Jason Bodner
July Has Delivered Nine Straight Gains – Will This July Be #10?
View Full Archive
Read Past Issues Here

Bryan Perry
SENIOR DIRECTOR
Bryan Perry is a Senior Director with Navellier Private Client Group, advising and facilitating high net worth investors in the pursuit of their financial goals.
Bryan’s financial services career spanning the past three decades includes over 20 years of wealth management experience with Wall Street firms that include Bear Stearns, Lehman Brothers and Paine Webber, working with both retail and institutional clients. Bryan earned a B.A. in Political Science from Virginia Polytechnic Institute & State University and currently holds a Series 65 license. All content of “Income Mail” represents the opinion of Bryan Perry
Important Disclosures:
Although information in these reports has been obtained from and is based upon sources that Navellier believes to be reliable, Navellier does not guarantee its accuracy and it may be incomplete or condensed. All opinions and estimates constitute Navellier’s judgment as of the date the report was created and are subject to change without notice. These reports are for informational purposes only and are not a solicitation for the purchase or sale of a security. Any decision to purchase securities mentioned in these reports must take into account existing public information on such securities or any registered prospectus.To the extent permitted by law, neither Navellier & Associates, Inc., nor any of its affiliates, agents, or service providers assumes any liability or responsibility nor owes any duty of care for any consequences of any person acting or refraining to act in reliance on the information contained in this communication or for any decision based on it.
Past performance is no indication of future results. Investment in securities involves significant risk and has the potential for partial or complete loss of funds invested. It should not be assumed that any securities recommendations made by Navellier. in the future will be profitable or equal the performance of securities made in this report. Dividend payments are not guaranteed. The amount of a dividend payment, if any, can vary over time and issuers may reduce dividends paid on securities in the event of a recession or adverse event affecting a specific industry or issuer.
None of the stock information, data, and company information presented herein constitutes a recommendation by Navellier or a solicitation to buy or sell any securities. Any specific securities identified and described do not represent all of the securities purchased, sold, or recommended for advisory clients. The holdings identified do not represent all of the securities purchased, sold, or recommended for advisory clients and the reader should not assume that investments in the securities identified and discussed were or will be profitable.
Information presented is general information that does not take into account your individual circumstances, financial situation, or needs, nor does it present a personalized recommendation to you. Individual stocks presented may not be suitable for every investor. Investment in securities involves significant risk and has the potential for partial or complete loss of funds invested. Investment in fixed income securities has the potential for the investment return and principal value of an investment to fluctuate so that an investor’s holdings, when redeemed, may be worth less than their original cost.
One cannot invest directly in an index. Index is unmanaged and index performance does not reflect deduction of fees, expenses, or taxes. Presentation of Index data does not reflect a belief by Navellier that any stock index constitutes an investment alternative to any Navellier equity strategy or is necessarily comparable to such strategies. Among the most important differences between the Indices and Navellier strategies are that the Navellier equity strategies may (1) incur material management fees, (2) concentrate its investments in relatively few stocks, industries, or sectors, (3) have significantly greater trading activity and related costs, and (4) be significantly more or less volatile than the Indices.
ETF Risk: We may invest in exchange traded funds (“ETFs”) and some of our investment strategies are generally fully invested in ETFs. Like traditional mutual funds, ETFs charge asset-based fees, but they generally do not charge initial sales charges or redemption fees and investors typically pay only customary brokerage fees to buy and sell ETF shares. The fees and costs charged by ETFs held in client accounts will not be deducted from the compensation the client pays Navellier. ETF prices can fluctuate up or down, and a client account could lose money investing in an ETF if the prices of the securities owned by the ETF go down. ETFs are subject to additional risks:
- ETF shares may trade above or below their net asset value;
- An active trading market for an ETF’s shares may not develop or be maintained;
- The value of an ETF may be more volatile than the underlying portfolio of securities the ETF is designed to track;
- The cost of owning shares of the ETF may exceed those a client would incur by directly investing in the underlying securities; and
- Trading of an ETF’s shares may be halted if the listing exchange’s officials deem it appropriate, the shares are delisted from the exchange, or the activation of market-wide “circuit breakers” (which are tied to large decreases in stock prices) halts stock trading generally.
Grader Disclosures: Investment in equity strategies involves substantial risk and has the potential for partial or complete loss of funds invested. The sample portfolio and any accompanying charts are for informational purposes only and are not to be construed as a solicitation to buy or sell any financial instrument and should not be relied upon as the sole factor in an investment making decision. As a matter of normal and important disclosures to you, as a potential investor, please consider the following: The performance presented is not based on any actual securities trading, portfolio, or accounts, and the reported performance of the A, B, C, D, and F portfolios (collectively the “model portfolios”) should be considered mere “paper” or pro forma performance results based on Navellier’s research.
Investors evaluating any of Navellier & Associates, Inc.’s, (or its affiliates’) Investment Products must not use any information presented here, including the performance figures of the model portfolios, in their evaluation of any Navellier Investment Products. Navellier Investment Products include the firm’s mutual funds and managed accounts. The model portfolios, charts, and other information presented do not represent actual funded trades and are not actual funded portfolios. There are material differences between Navellier Investment Products’ portfolios and the model portfolios, research, and performance figures presented here. The model portfolios and the research results (1) may contain stocks or ETFs that are illiquid and difficult to trade; (2) may contain stock or ETF holdings materially different from actual funded Navellier Investment Product portfolios; (3) include the reinvestment of all dividends and other earnings, estimated trading costs, commissions, or management fees; and, (4) may not reflect prices obtained in an actual funded Navellier Investment Product portfolio. For these and other reasons, the reported performances of model portfolios do not reflect the performance results of Navellier’s actually funded and traded Investment Products. In most cases, Navellier’s Investment Products have materially lower performance results than the performances of the model portfolios presented.
This report contains statements that are, or may be considered to be, forward-looking statements. All statements that are not historical facts, including statements about our beliefs or expectations, are “forward-looking statements” within the meaning of The U.S. Private Securities Litigation Reform Act of 1995. These statements may be identified by such forward-looking terminology as “expect,” “estimate,” “plan,” “intend,” “believe,” “anticipate,” “may,” “will,” “should,” “could,” “continue,” “project,” or similar statements or variations of such terms. Our forward-looking statements are based on a series of expectations, assumptions, and projections, are not guarantees of future results or performance, and involve substantial risks and uncertainty as described in Form ADV Part 2A of our filing with the Securities and Exchange Commission (SEC), which is available at www.adviserinfo.sec.gov or by requesting a copy by emailing info@navellier.com. All of our forward-looking statements are as of the date of this report only. We can give no assurance that such expectations or forward-looking statements will prove to be correct. Actual results may differ materially. You are urged to carefully consider all such factors.
FEDERAL TAX ADVICE DISCLAIMER: As required by U.S. Treasury Regulations, you are informed that, to the extent this presentation includes any federal tax advice, the presentation is not written by Navellier to be used, and cannot be used, for the purpose of avoiding federal tax penalties. Navellier does not advise on any income tax requirements or issues. Use of any information presented by Navellier is for general information only and does not represent tax advice either express or implied. You are encouraged to seek professional tax advice for income tax questions and assistance.
IMPORTANT NEWSLETTER DISCLOSURE:The hypothetical performance results for investment newsletters that are authored or edited by Louis Navellier, including Louis Navellier’s Growth Investor, Louis Navellier’s Breakthrough Stocks, Louis Navellier’s Accelerated Profits, and Louis Navellier’s Platinum Club, are not based on any actual securities trading, portfolio, or accounts, and the newsletters’ reported hypothetical performances should be considered mere “paper” or proforma hypothetical performance results and are not actual performance of real world trades. Navellier & Associates, Inc. does not have any relation to or affiliation with the owner of these newsletters. There are material differences between Navellier Investment Products’ portfolios and the InvestorPlace Media, LLC newsletter portfolios authored by Louis Navellier. The InvestorPlace Media, LLC newsletters contain hypothetical performance that do not include transaction costs, advisory fees, or other fees a client might incur if actual investments and trades were being made by an investor. As a result, newsletter performance should not be used to evaluate Navellier Investment services which are separate and different from the newsletters. The owner of the newsletters is InvestorPlace Media, LLC and any questions concerning the newsletters, including any newsletter advertising or hypothetical Newsletter performance claims, (which are calculated solely by Investor Place Media and not Navellier) should be referred to InvestorPlace Media, LLC at (800) 718-8289.
Please note that Navellier & Associates and the Navellier Private Client Group are managed completely independent of the newsletters owned and published by InvestorPlace Media, LLC and written and edited by Louis Navellier, and investment performance of the newsletters should in no way be considered indicative of potential future investment performance for any Navellier & Associates separately managed account portfolio. Potential investors should consult with their financial advisor before investing in any Navellier Investment Product.
Navellier claims compliance with Global Investment Performance Standards (GIPS). To receive a complete list and descriptions of Navellier’s composites and/or a presentation that adheres to the GIPS standards, please contact Navellier or click here. It should not be assumed that any securities recommendations made by Navellier & Associates, Inc. in the future will be profitable or equal the performance of securities made in this report.
FactSet Disclosure: Navellier does not independently calculate the statistical information included in the attached report. The calculation and the information are provided by FactSet, a company not related to Navellier. Although information contained in the report has been obtained from FactSet and is based on sources Navellier believes to be reliable, Navellier does not guarantee its accuracy, and it may be incomplete or condensed. The report and the related FactSet sourced information are provided on an “as is” basis. The user assumes the entire risk of any use made of this information. Investors should consider the report as only a single factor in making their investment decision. The report is for informational purposes only and is not intended as an offer or solicitation for the purchase or sale of a security. FactSet sourced information is the exclusive property of FactSet. Without prior written permission of FactSet, this information may not be reproduced, disseminated or used to create any financial products. All indices are unmanaged and performance of the indices include reinvestment of dividends and interest income, unless otherwise noted, are not illustrative of any particular investment and an investment cannot be made in any index. Past performance is no guarantee of future results.