
by Gary Alexander
July 28, 2026
During this annual mid-summer stretch of market doldrums – usually running from mid-July to Labor Day – we can anticipate some depressing days watching our portfolio totals sleep, or plunge, as the Dog Days are often punctuated by big scares on light volume as traders take their long holidays at the beach or at a plush mountain resort. So, during this mid-summer siesta season, I hope to avoid obsessing over any market gyrations by seeking historical insights about how we needn’t worry so much about August scares.
This week, I’d like to help honor America’s 250th birthday by comparing the bitter end of the gold standard some 55-years ago next month (on the weekend of August 14-15, 1971) and then cover gold’s central bank romance starting 15-years ago, during the first week of August 2011. It’s an astonishing tale.
First, let me set the stage with a few golden moments falling on this date – July 28 – in financial history.
- On July 28, 1841, we narrowly avoided creating a Federal Reserve bank when the Senate passed a Whig-backed bill led by Senator Henry Clay to establish a “national fiscal corporation,” to be called the Bank of the United States, shortly after the demise of the Second Bank of the United States. The Senate passed the bill 26-23 on July 28, but President John Tyler threatened a veto, so the plan failed.
- On July 28, 1914, stock markets all over Europe (and soon America) shut down on the same day the world’s largest-ever gold shipment was launched out of New York harbor. Our allies needed gold to fight the war. On July 31, 5,000 Brits patiently lined up outside the Bank of England, waiting to swap their 5-pound notes for 22-karat gold Sovereigns. The Bank met the demand that day, but they could not keep hemorrhaging gold until a shipment of $10 million in gold reached London. Eventually $5 million reached London, plus $2 million to Paris – but Britain ditched the gold standard on August 5.
- On July 28, 1933, an exhausting 45-day financial summit in London broke up, torpedoed by our new President Franklin D. Roosevelt’s determination to defend the dollar. This “London Monetary and Economic Conference” hosted representatives of 66-nations. They met from June 12 to July 27 in the Geological Museum in London. Their goal was to revive trade, stabilize currency values and halt the Depression, but our rookie President’s dollar defense scuttled the best-laid plans of the Old Guard.
- On July 28, 1978, gold first topped $200 per ounce after a previous peak of $190 on the last day of 1974, the first day since mid-1933 gold was legal for Americans to own. Then, gold fell to $104 on August 23, 1976, due in large part to IMF gold auctions, closing 1978 at $235, on its way to $850.
- And – to introduce my main story – on July 28, 2011, the S&P 500 closed at 1,300, and gold traded at a lofty $1,613, but then gold soared and stocks sank. Just 40-days later, on September 6, the S&P was off 12%, to 1,140 and gold was up 18% to $1,911. What happened to cause this huge market reversal?
The Gold Standard Died in 1971 … But it Was Reborn in 2011
Gold began the 21st Century at barely $260 per ounce. On this date 25 years ago, gold was mired near a 23-year low at around $275 per ounce, but it was about to begin a 7-fold gain in the next decade. The first stirring came after 9/11, then came the wars in Afghanistan and Iraq, and then the 2008 financial crisis.
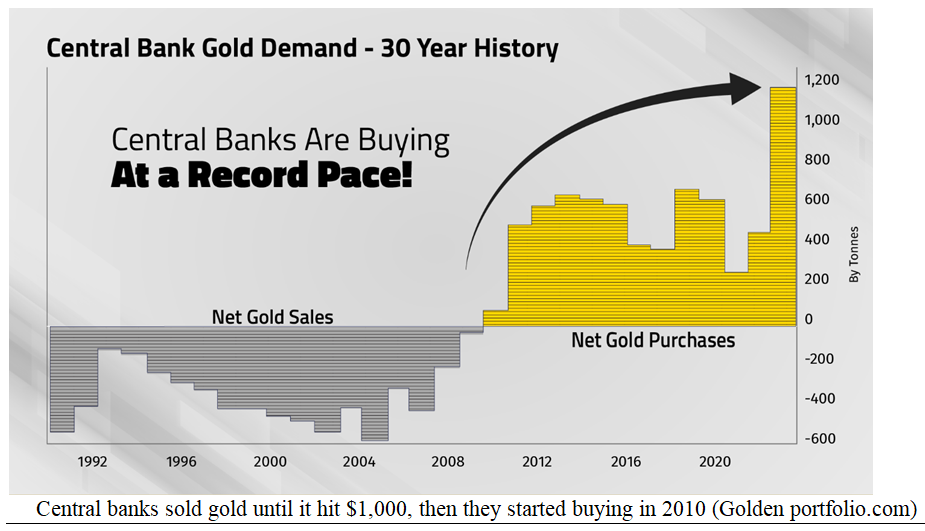
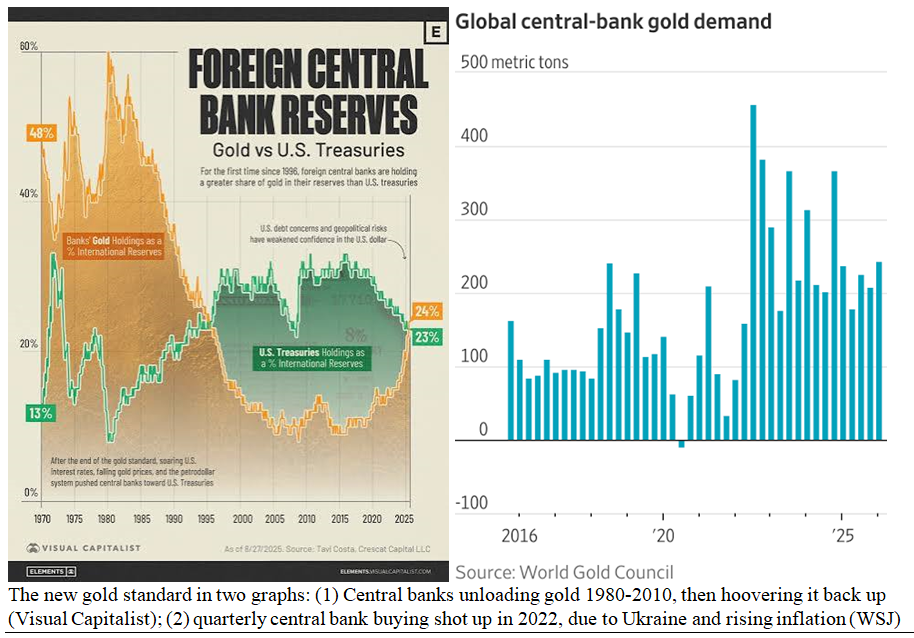
Throughout the first decade of this century, central banks kept unloading gold – as they had since 1971 – but something made central banks wake up after 2010. For the first 40 years after President Nixon closed the gold window in 1971, central banks mostly unloaded their gold to exercise their faith in fiat money, but in 2011, the U.S. Treasury was suffering the third of four straight trillion-dollar budget deficits in President Obama’s first term. Congress was meeting in emergency sessions to raise the debt ceiling, and on Tuesday, August 2, Congress passed the Budget Control Act of 2011, which raised the debt ceiling by $2.4 trillion through 2012. As a direct result of that move, Standard & Poor’s downgraded Treasury credit debt from AAA to AA+, the first time since the 1980s U.S. debt was rated below the top (AAA) rating.
That’s when the “new gold standard” began with central banks, 15-years ago, in 2011. From 2011 to 2021, net central bank buying averaged around 500 metric tons (16-million Troy ounces) per year. That pace doubled in the last five-years, with over 1,000-tons of gold purchases added each year from 2022 to 2024, followed by 850-tons last year. Central banks bought more gold in four-years than in the previous eight.
The main impetus of this big gold buying binge since 2022 was the war in Ukraine, plus a strong spurt of new inflation after President Biden’s massive stimulus (vote buying) programs during a strong economy.
Graphs are for illustrative and discussion purposes only. Please read important disclosures at the end of this commentary.
Where does this central bank gold buying spree stand now? After a hot first quarter (2026) of 244-metric tons of gold buying, that pace tapered off sharply in April, then picked up some pace in May, according to the World Gold Council (WGC) and London Gold Exchange. Full second-quarter accounting (adding June) is not yet available, but WGC says gold buying dipped to 19-metric tons in April and 41-tons in May, making 304-tons in the first five-months of 2026. The WGC projects 700-900 tons for the full year.
The Wall Street Journal said last week Turkey sold 81 tons of gold in the first half of 2026 and Russia sold 34-tons to fund its ongoing war with Ukraine, but all these totals for central bank gold buying are net purchases – buying minus selling. Among recent big buyers, Poland is a standout — its gold reserves have reached 614-tons, on the way to a goal of 700-tons. Poland bought 18-tons in May, its fourth-straight month of double-digit (tonnage) purchases. China bought 10-tons of gold in May, running its gold buying streak to 20-straight months, with lots of room for growth, as gold is only 8.3% of its foreign exchange.
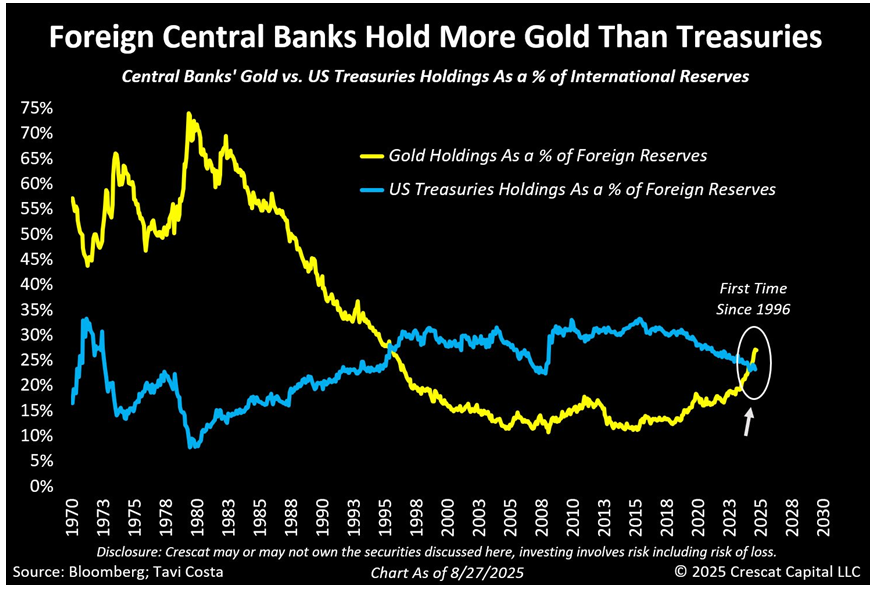
For the first five-months of 2026, China’s central bank bought $5.7 billion in gold, mostly in the second-quarter, when gold prices were consolidating near $4,000. This constant flow of central bank buying is effectively putting a new floor under the price of gold. Even though foreign central banks own almost $10 trillion in U.S. Treasuries, they own more in gold than in U.S. Treasury securities. That, to me, looks like a new gold standard – better even than the last gold standard, as it reflects voluntary purchases in a free market, not fixed to currency values. This time, central banks are “voting” for gold over paper money.
Graphs are for illustrative and discussion purposes only. Please read important disclosures at the end of this commentary.
Total central bank gold buying has averaged over 900-tons a year since 2022, pushing gold up since then:
| Investment | Jan. 1, 2022 | July 24, 2026 | Changes since 2022 | ||
| Gold | $1,827 | $4,095 | +124% | ||
| Silver | $23.24 | $59.70 | +157% | ||
| S&P 500 | 4,766 | 7,412 | +55.5% | ||
| Dollar (DXY) | 105.04 | 101.19 | -3.7% | ||
| (Data source: Yahoo Finance: | |||||
The reason gold has more than doubled since 2022 is simply supply and demand: The world’s gold mines produce about 3,600-tons of gold per year, almost entirely consumed privately, namely in demand for gold jewelry (about 2,000-tons), investment demand (1,180-tons a year) and industrial demand (325-tons).
Putting these numbers together, you’re talking 3,500-tons of established private sector demand per year vs. 3,600-tons from mines, so adding 500 to 1,000-tons of central bank demand each year puts gold’s overall supply-demand balance into a deficit situation, thereby pushing gold prices up to new highs.
Where next? The WGC’s annual survey of central banks in 2026 revealed nearly half (a record 45%) of all central banks plan to add more gold over the next year, and – even more shocking – nearly three of four (74%) of central banks expect to sell U.S. dollars in the coming year, and an astonishing 89% of central banks polled by WGC expect gold prices to rise in the next year. Meanwhile, the dollar’s share of global foreign exchange reserves has fallen from 72% in 2000 to around 58% in 2025, while gold’s share of central bank reserves has risen to 24%, eclipsing U.S. Treasury bonds (23%), with T-bonds as a subset of dollar demand. This is creating an unofficial (stealth) gold standard, as nations swap dollars for gold.
Graphs are for illustrative and discussion purposes only. Please read important disclosures at the end of this commentary.
Nearly all currencies (all but the Swiss franc, it seems) are staging a “race to the bottom” to gain trade advantages, so central bankers have woken up to the fact that gold remains the gold standard for money.
All content above represents the opinion of Gary Alexander of Navellier & Associates, Inc.
Also In This Issue
A Look Ahead by Louis Navellier
What Some Early Earnings Announcements Portend for the Market
Income Mail by Bryan Perry
Growth Stocks Are Hit by Deleveraging and Higher Interest Rates
Growth Mail by Gary Alexander
An Undeclared New Gold Standard Has Quietly Returned
Global Mail by Ivan Martchev
Will Oil at (or near) $100 Generate a “Diplomatic Offramp”?
Sector Spotlight by Jason Bodner
Using a Market Sextant to Plot Your Course
View Full Archive
Read Past Issues Here
About The Author

Gary Alexander
SENIOR EDITOR
Gary Alexander has been Senior Writer at Navellier since 2009. He edits Navellier’s weekly Marketmail and writes a weekly Growth Mail column, in which he uses market history to support the case for growth stocks. For the previous 20-years before joining Navellier, he was Senior Executive Editor at InvestorPlace Media (formerly Phillips Publishing), where he worked with several leading investment analysts, including Louis Navellier (since 1997), helping launch Louis Navellier’s Blue Chip Growth and Global Growth newsletters.
Prior to that, Gary edited Wealth Magazine and Gold Newsletter and wrote various investment research reports for Jefferson Financial in New Orleans in the 1980s. He began his financial newsletter career with KCI Communications in 1980, where he served as consulting editor for Personal Finance newsletter while serving as general manager of KCI’s Alexandria House book division. Before that, he covered the economics beat for news magazines. All content of “Growth Mail” represents the opinion of Gary Alexander
Important Disclosures:
Although information in these reports has been obtained from and is based upon sources that Navellier believes to be reliable, Navellier does not guarantee its accuracy and it may be incomplete or condensed. All opinions and estimates constitute Navellier’s judgment as of the date the report was created and are subject to change without notice. These reports are for informational purposes only and are not a solicitation for the purchase or sale of a security. Any decision to purchase securities mentioned in these reports must take into account existing public information on such securities or any registered prospectus.To the extent permitted by law, neither Navellier & Associates, Inc., nor any of its affiliates, agents, or service providers assumes any liability or responsibility nor owes any duty of care for any consequences of any person acting or refraining to act in reliance on the information contained in this communication or for any decision based on it.
Past performance is no indication of future results. Investment in securities involves significant risk and has the potential for partial or complete loss of funds invested. It should not be assumed that any securities recommendations made by Navellier. in the future will be profitable or equal the performance of securities made in this report. Dividend payments are not guaranteed. The amount of a dividend payment, if any, can vary over time and issuers may reduce dividends paid on securities in the event of a recession or adverse event affecting a specific industry or issuer.
None of the stock information, data, and company information presented herein constitutes a recommendation by Navellier or a solicitation to buy or sell any securities. Any specific securities identified and described do not represent all of the securities purchased, sold, or recommended for advisory clients. The holdings identified do not represent all of the securities purchased, sold, or recommended for advisory clients and the reader should not assume that investments in the securities identified and discussed were or will be profitable.
Information presented is general information that does not take into account your individual circumstances, financial situation, or needs, nor does it present a personalized recommendation to you. Individual stocks presented may not be suitable for every investor. Investment in securities involves significant risk and has the potential for partial or complete loss of funds invested. Investment in fixed income securities has the potential for the investment return and principal value of an investment to fluctuate so that an investor’s holdings, when redeemed, may be worth less than their original cost.
One cannot invest directly in an index. Index is unmanaged and index performance does not reflect deduction of fees, expenses, or taxes. Presentation of Index data does not reflect a belief by Navellier that any stock index constitutes an investment alternative to any Navellier equity strategy or is necessarily comparable to such strategies. Among the most important differences between the Indices and Navellier strategies are that the Navellier equity strategies may (1) incur material management fees, (2) concentrate its investments in relatively few stocks, industries, or sectors, (3) have significantly greater trading activity and related costs, and (4) be significantly more or less volatile than the Indices.
ETF Risk: We may invest in exchange traded funds (“ETFs”) and some of our investment strategies are generally fully invested in ETFs. Like traditional mutual funds, ETFs charge asset-based fees, but they generally do not charge initial sales charges or redemption fees and investors typically pay only customary brokerage fees to buy and sell ETF shares. The fees and costs charged by ETFs held in client accounts will not be deducted from the compensation the client pays Navellier. ETF prices can fluctuate up or down, and a client account could lose money investing in an ETF if the prices of the securities owned by the ETF go down. ETFs are subject to additional risks:
- ETF shares may trade above or below their net asset value;
- An active trading market for an ETF’s shares may not develop or be maintained;
- The value of an ETF may be more volatile than the underlying portfolio of securities the ETF is designed to track;
- The cost of owning shares of the ETF may exceed those a client would incur by directly investing in the underlying securities; and
- Trading of an ETF’s shares may be halted if the listing exchange’s officials deem it appropriate, the shares are delisted from the exchange, or the activation of market-wide “circuit breakers” (which are tied to large decreases in stock prices) halts stock trading generally.
Grader Disclosures: Investment in equity strategies involves substantial risk and has the potential for partial or complete loss of funds invested. The sample portfolio and any accompanying charts are for informational purposes only and are not to be construed as a solicitation to buy or sell any financial instrument and should not be relied upon as the sole factor in an investment making decision. As a matter of normal and important disclosures to you, as a potential investor, please consider the following: The performance presented is not based on any actual securities trading, portfolio, or accounts, and the reported performance of the A, B, C, D, and F portfolios (collectively the “model portfolios”) should be considered mere “paper” or pro forma performance results based on Navellier’s research.
Investors evaluating any of Navellier & Associates, Inc.’s, (or its affiliates’) Investment Products must not use any information presented here, including the performance figures of the model portfolios, in their evaluation of any Navellier Investment Products. Navellier Investment Products include the firm’s mutual funds and managed accounts. The model portfolios, charts, and other information presented do not represent actual funded trades and are not actual funded portfolios. There are material differences between Navellier Investment Products’ portfolios and the model portfolios, research, and performance figures presented here. The model portfolios and the research results (1) may contain stocks or ETFs that are illiquid and difficult to trade; (2) may contain stock or ETF holdings materially different from actual funded Navellier Investment Product portfolios; (3) include the reinvestment of all dividends and other earnings, estimated trading costs, commissions, or management fees; and, (4) may not reflect prices obtained in an actual funded Navellier Investment Product portfolio. For these and other reasons, the reported performances of model portfolios do not reflect the performance results of Navellier’s actually funded and traded Investment Products. In most cases, Navellier’s Investment Products have materially lower performance results than the performances of the model portfolios presented.
This report contains statements that are, or may be considered to be, forward-looking statements. All statements that are not historical facts, including statements about our beliefs or expectations, are “forward-looking statements” within the meaning of The U.S. Private Securities Litigation Reform Act of 1995. These statements may be identified by such forward-looking terminology as “expect,” “estimate,” “plan,” “intend,” “believe,” “anticipate,” “may,” “will,” “should,” “could,” “continue,” “project,” or similar statements or variations of such terms. Our forward-looking statements are based on a series of expectations, assumptions, and projections, are not guarantees of future results or performance, and involve substantial risks and uncertainty as described in Form ADV Part 2A of our filing with the Securities and Exchange Commission (SEC), which is available at www.adviserinfo.sec.gov or by requesting a copy by emailing info@navellier.com. All of our forward-looking statements are as of the date of this report only. We can give no assurance that such expectations or forward-looking statements will prove to be correct. Actual results may differ materially. You are urged to carefully consider all such factors.
FEDERAL TAX ADVICE DISCLAIMER: As required by U.S. Treasury Regulations, you are informed that, to the extent this presentation includes any federal tax advice, the presentation is not written by Navellier to be used, and cannot be used, for the purpose of avoiding federal tax penalties. Navellier does not advise on any income tax requirements or issues. Use of any information presented by Navellier is for general information only and does not represent tax advice either express or implied. You are encouraged to seek professional tax advice for income tax questions and assistance.
IMPORTANT NEWSLETTER DISCLOSURE:The hypothetical performance results for investment newsletters that are authored or edited by Louis Navellier, including Louis Navellier’s Growth Investor, Louis Navellier’s Breakthrough Stocks, Louis Navellier’s Accelerated Profits, and Louis Navellier’s Platinum Club, are not based on any actual securities trading, portfolio, or accounts, and the newsletters’ reported hypothetical performances should be considered mere “paper” or proforma hypothetical performance results and are not actual performance of real world trades. Navellier & Associates, Inc. does not have any relation to or affiliation with the owner of these newsletters. There are material differences between Navellier Investment Products’ portfolios and the InvestorPlace Media, LLC newsletter portfolios authored by Louis Navellier. The InvestorPlace Media, LLC newsletters contain hypothetical performance that do not include transaction costs, advisory fees, or other fees a client might incur if actual investments and trades were being made by an investor. As a result, newsletter performance should not be used to evaluate Navellier Investment services which are separate and different from the newsletters. The owner of the newsletters is InvestorPlace Media, LLC and any questions concerning the newsletters, including any newsletter advertising or hypothetical Newsletter performance claims, (which are calculated solely by Investor Place Media and not Navellier) should be referred to InvestorPlace Media, LLC at (800) 718-8289.
Please note that Navellier & Associates and the Navellier Private Client Group are managed completely independent of the newsletters owned and published by InvestorPlace Media, LLC and written and edited by Louis Navellier, and investment performance of the newsletters should in no way be considered indicative of potential future investment performance for any Navellier & Associates separately managed account portfolio. Potential investors should consult with their financial advisor before investing in any Navellier Investment Product.
Navellier claims compliance with Global Investment Performance Standards (GIPS). To receive a complete list and descriptions of Navellier’s composites and/or a presentation that adheres to the GIPS standards, please contact Navellier or click here. It should not be assumed that any securities recommendations made by Navellier & Associates, Inc. in the future will be profitable or equal the performance of securities made in this report.
FactSet Disclosure: Navellier does not independently calculate the statistical information included in the attached report. The calculation and the information are provided by FactSet, a company not related to Navellier. Although information contained in the report has been obtained from FactSet and is based on sources Navellier believes to be reliable, Navellier does not guarantee its accuracy, and it may be incomplete or condensed. The report and the related FactSet sourced information are provided on an “as is” basis. The user assumes the entire risk of any use made of this information. Investors should consider the report as only a single factor in making their investment decision. The report is for informational purposes only and is not intended as an offer or solicitation for the purchase or sale of a security. FactSet sourced information is the exclusive property of FactSet. Without prior written permission of FactSet, this information may not be reproduced, disseminated or used to create any financial products. All indices are unmanaged and performance of the indices include reinvestment of dividends and interest income, unless otherwise noted, are not illustrative of any particular investment and an investment cannot be made in any index. Past performance is no guarantee of future results.