by Gary Alexander
July 2, 2024
Two top stock indexes hit new all-time highs on Friday morning after the Fed’s favorite inflation indicator – the Personal Consumption Expenditures (PCE) index – indicated slower price gains. The core PCE index rose by just 0.1% in May, its lowest rate in over three years, bringing the total rise to 2.6% over the last 12 months. Including food and energy, the PCE was flat in May. This lifted investor expectations of a rate cut in September up to 59.5%, according to the CME Group FedWatch Tool.
Also, consumer sentiment for June rose to 68.2 from the preliminary level of 65.6, so most Americans are telling pollsters that they still have a lot to be thankful for going into the July 4th break – but that poll was taken before Thursday night’s Presidential Debate – when Lincoln and Reagan were noticeably absent.
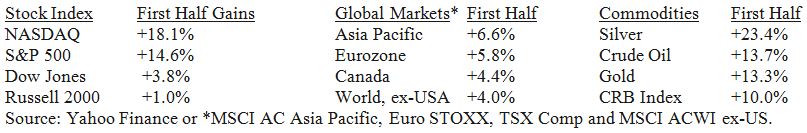
The markets didn’t care about two old guys throwing insults at each other. Instead, traders sent the S&P 500 and NASDAQ to opening all-time highs, although they settled down later on. In global markets, so far in 2024, America’s top three indexes averaged 12%, vs. 4% for the rest of the world. Happy July 4th!
Now, let’s indulge in an intoxicating dose of truth serum for candidates Biden and Trump, plus CNN.
A 90-Minute Fact-Free Presidential Debate!
I haven’t watched a Presidential debate in over 30 years – and this one was a struggle to endure – but in checking the transcript I don’t think I heard one accurate statistic from either candidate all night long, and that is a low barrier of entry. Even a blind pitcher can throw a strike across the plate once in a while
I’ll be as brief as possible. Here’s President Biden’s opening statement, taken directly from the transcript:
““We’ve got to take a look at what I was left when I became president, what Mr. Trump left me. We had an economy that was in freefall.…There were no jobs. The unemployment rate rose to 15 percent. It was terrible. And so, what we had to do is try to put things back together again. And that’s exactly what we began to do. We created 15,000 new jobs…we have 800,000 new manufacturing jobs.”
—-President Biden’s opening debate remarks, June 27, 2024
Later on, Biden doubled down on those claims, saying that, when he was elected, “The economy was flat on its back: 15% unemployment, he decimated the economy, absolutely decimated the economy. That’s why there was no inflation at the time. There were no jobs. We provided thousands of millions of jobs.”
Biden had two obvious brain burps there – he actually said “15,000 jobs” and “thousands of millions of jobs,” when his ads say he “created 15 million jobs” (adding, “I’m Joe Biden and I approved this ad.”)
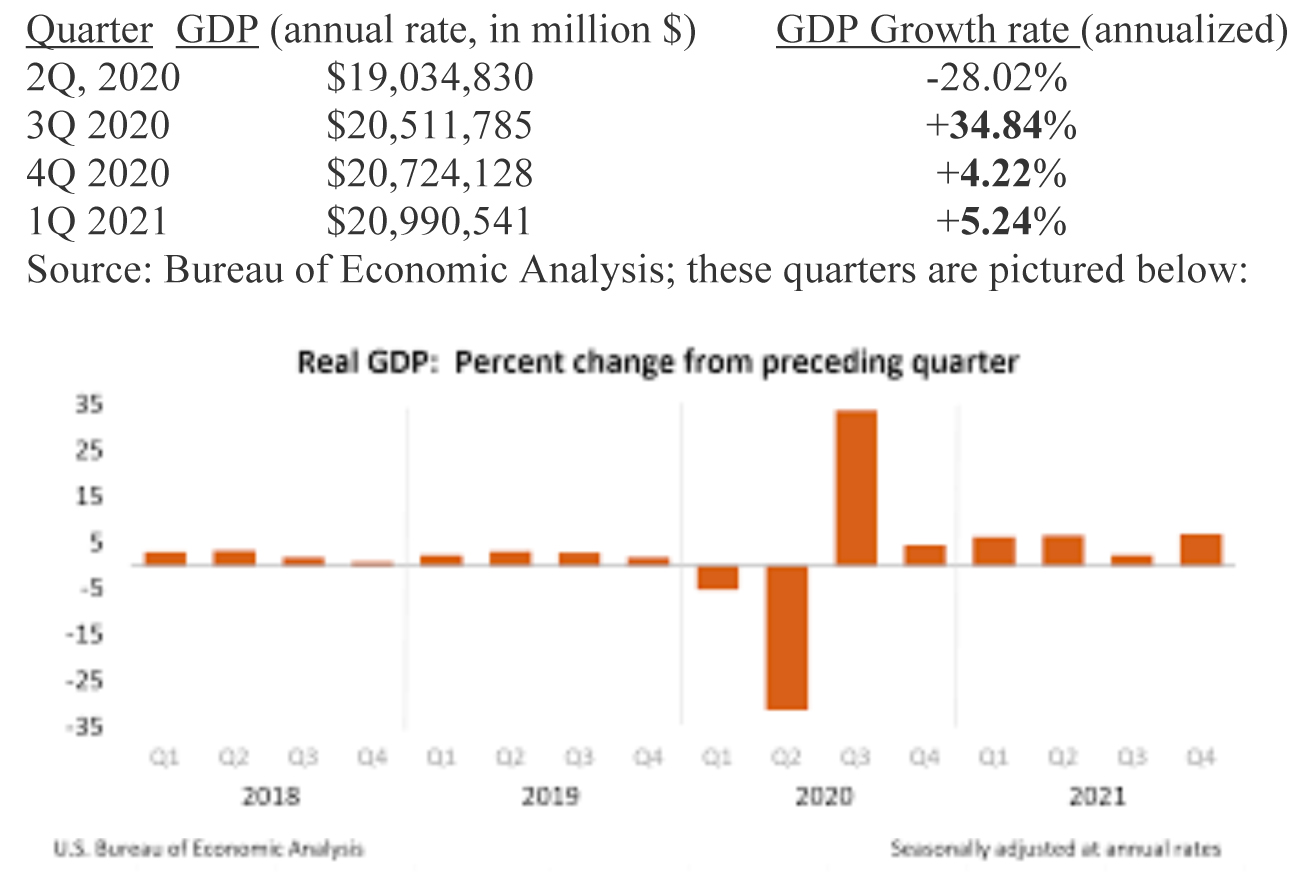
The truth is that the economy was growing strongly in the second half of 2020, when Biden was elected.
Graphs are for illustrative and discussion purposes only. Please read important disclosures at the end of this commentary.
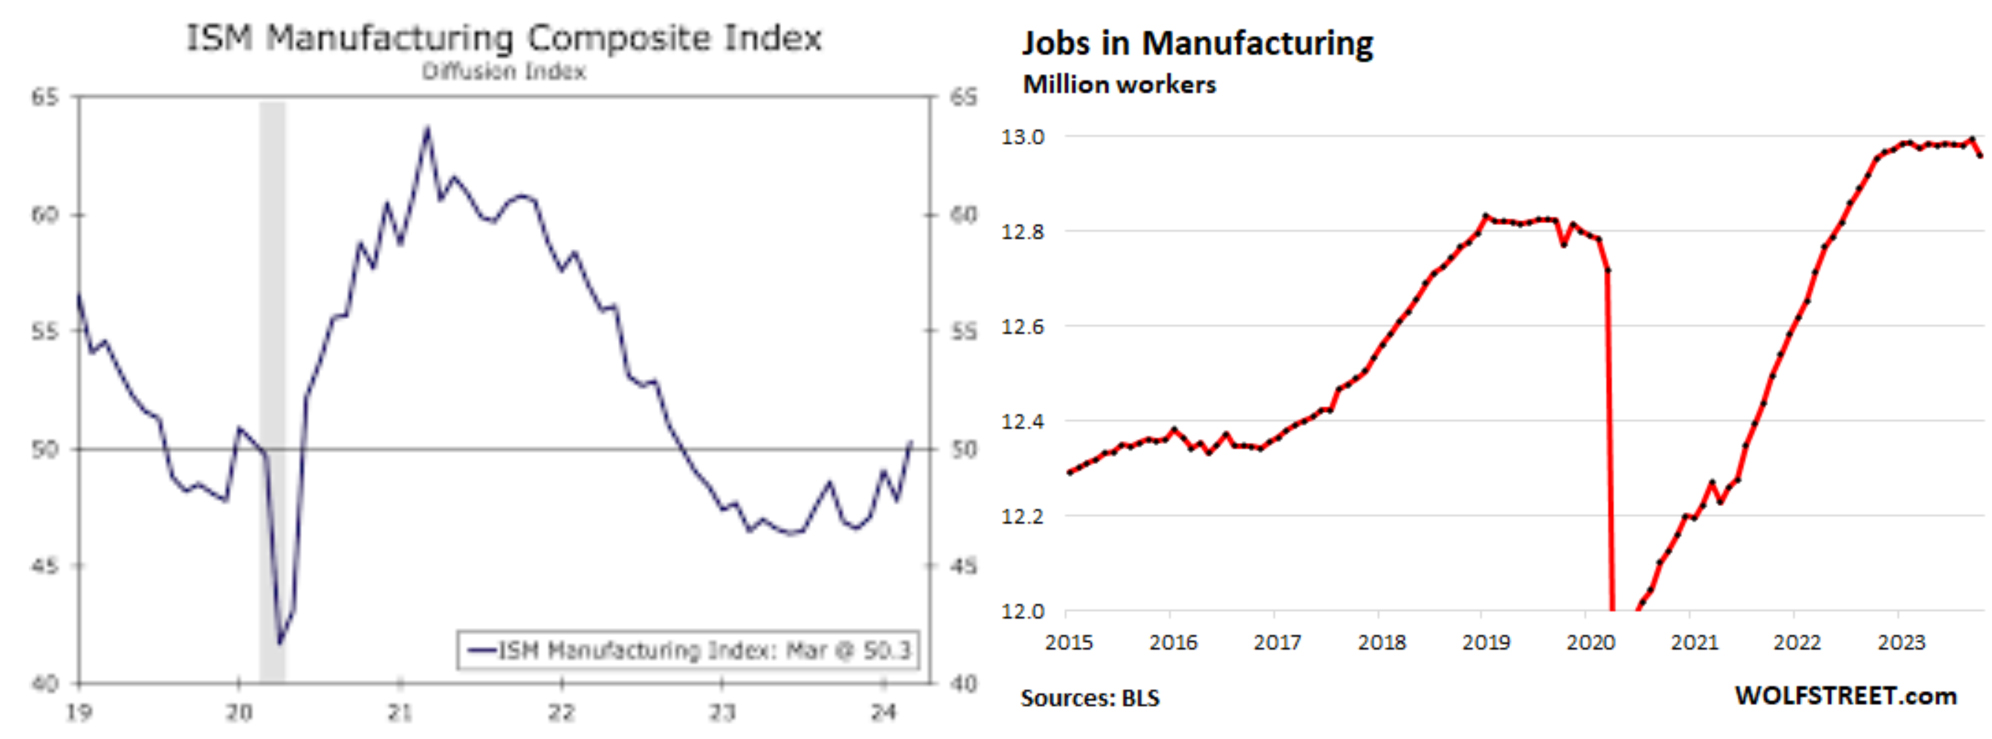
Manufacturing jobs under Biden were primarily hire-backs of lost jobs during lock-down. There were 12,780,000 U.S. manufacturing jobs in February 2020, before COVID. Total manufacturing jobs in May 2024, the latest data available, are 12,965,000, a negligible gain of 185,000 jobs in 4.3 years. How can the President create manufacturing jobs when the ISM manufacturing index has been in retreat since 2021?
Graphs are for illustrative and discussion purposes only. Please read important disclosures at the end of this commentary.
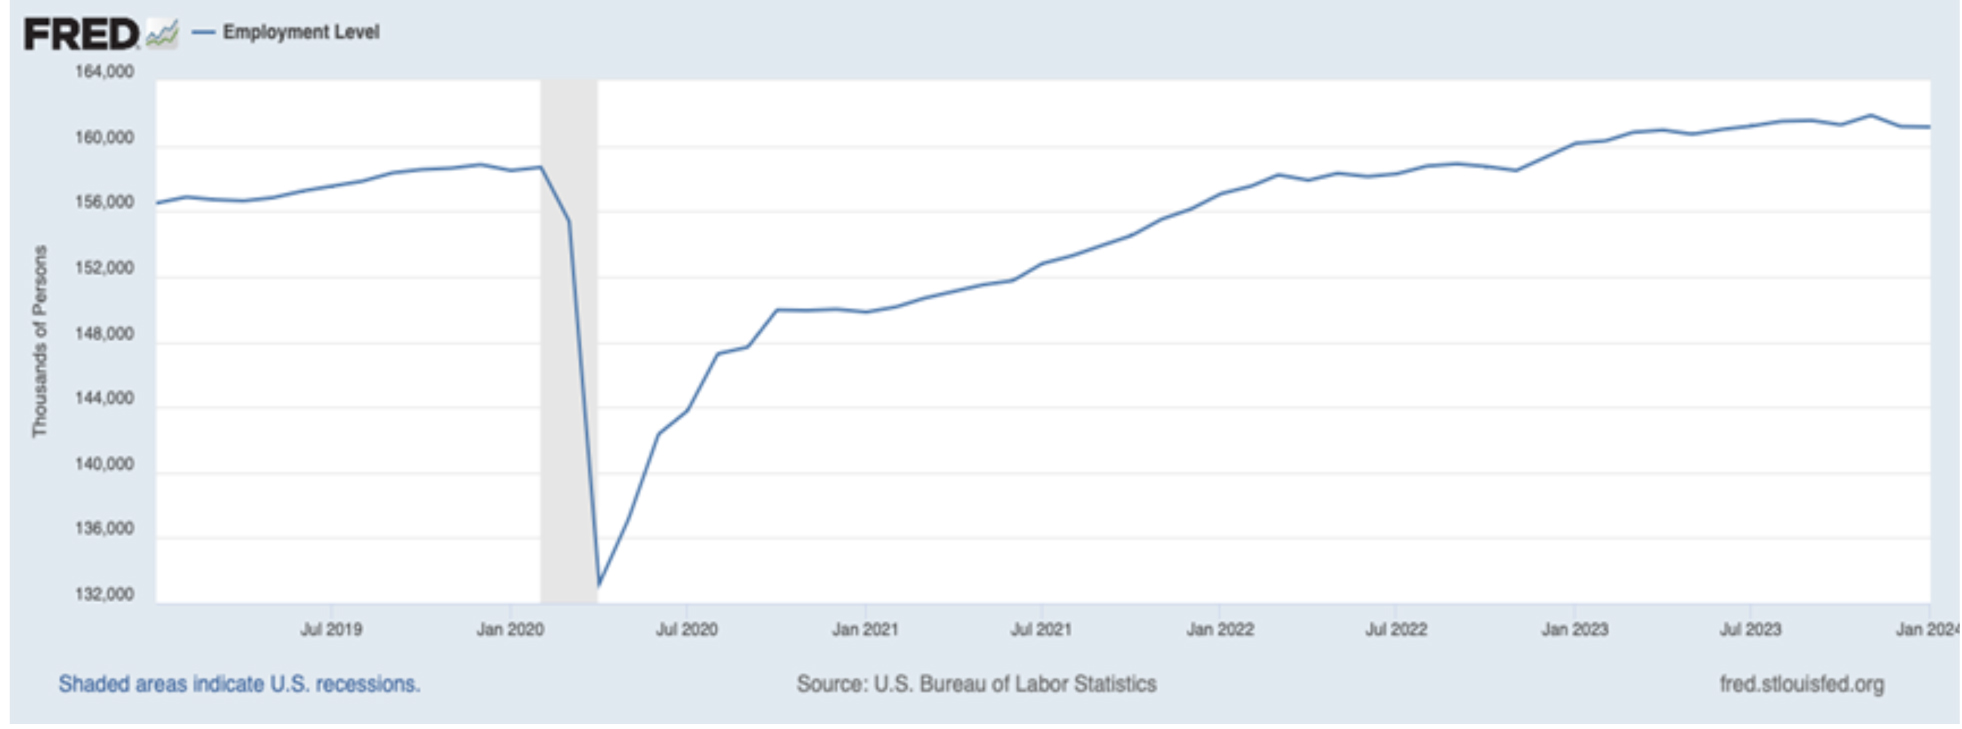
Manufacturing jobs are up less than 200,000 since early 2020 (above, right), and total jobs are up about three million (below), mostly service jobs. Biden says he “created” 15 million jobs, but these jobs already existed before COVID.
Graphs are for illustrative and discussion purposes only. Please read important disclosures at the end of this commentary.
I was hoping former President Trump would correct some of Biden’s blunders, but Trump went on an unrelated rant. Later, he invented inflated figures of his own, multiplying true statistics five to 10-fold.
Trump: “Look at the cost of food, where it’s doubled and tripled and quadrupled. … He [Biden] wants to raise your taxes by four times. He wants to raise everybody’s taxes by four times. He wants the Trump tax cuts to expire so everybody, including the two of you [CNN hosts] are going to pay four to five times.”
The truth: Inflation is up about 20% in the aggregate under Biden and maybe 30% in some key food groups and energy, but certainly not four-fold in anything. And my tax advisor tells me my tax bite will likely go up 25% if the Trump tax cuts are repealed in 2026 and Biden imposes some new tax penalties. That’s bad enough, but it’s not four-fold, so why would Trump invent such outrageously high numbers?
I would advise Mr. Trump to memorize a simple mantra: “(1) Inflation was less than 2% per year during my four years and now it’s over 6% per year under my successor, or +20% overall; (2) there were about 600,000 immigrants crossing our southern border each year in my four years and now over two million per year – by direct invitation of my successor – “Y’ALL COME!” he told them! And (3) he will raise your taxes 20% by letting my tax cuts expire, and the burden falls mostly on small businesses and the middle class, on nearly everyone earning $50,000 to $400,000. That’s what you’re voting for with Biden.”
The CNN hosts are to be congratulated for their fair questions and for not interrupting, but Jake Tapper told a whopper of his own by saying to Trump, “Your administration approved $8.4 trillion in new debt, while so far President Biden has approved $4.3 trillion in new debt.” But Tapper’s math quotes only part of a study – the part that puts the COVID crisis year (2020) under Trump, plus all of Fiscal 2021, which includes Biden’s stimulus bills, starting with the America Rescue Plan Act (ARPA) in March 2021.
More than any other Act, ARPA launched the rising debt load of 2021 and inflation in 2022. Democrat Party economist Larry Summers rightly warned that ARPA would fuel the worst inflation in a generation. Tapper calls the 2021 budget Trump’s, only because it had to be approved before September 30, 2020, so if you blame all COVID costs and all of Biden’s 2021 stimulus spending on Trump, his debts topped Biden’s, but if you compare their first three years, ignoring COVID costs, here’s how the two compare:
• Trump’s first three years of deficits, 2017 to 2019: $2.428 trillion
• Biden’s first three years of deficits, 2021 to 2023: $5.832 trillion (140% more)
Overall, what we saw last Thursday were two candidates out of touch with the facts, but that’s not what makes them unfit. They have aides who can provide them with data. Instead, what we saw were a senile-man who can’t help himself, and a blustery businessman with a penchant for making stuff up. No bevy of aides can cure those tendencies. Age is not to blame, in either case. I just saw former Texas Senator Phil Gramm, older than either candidate (turning 82 on July 8) talk for 45 minutes without notes about his new book, “The Myth of Income Inequality,” including Q&A, all with wit, historical insights and wisdom after he and his co-author won The Manhattan Institute’s Hayek “Book of the Year’ Award.
Also, Bernie Sanders, at 82, is older than both candidates and still sharp as a tack. I disagree with him, but he was denied the candidacy while leading in delegate counts in 2016 and 2020, so in 2024 we’re stuck with a Trump vs. Biden re-run. Louis Navellier has said that Biden may be replaced by Gavin Newsom at the Democratic Convention. That’s a real possibility – so maybe Phil Gramm can replace Trump, too!
Whoever wins, it’s what we 335,893,237 other Americans do in the other 1,460 days of a four-year cycle that matters most. That’s what July 4th is all about, celebrating freedom – long before Presidents existed.
All content above represents the opinion of Gary Alexander of Navellier & Associates, Inc.
Also In This Issue
A Look Ahead by Louis Navellier
Will Election Year Chaos Torpedo This Bull Market?
Income Mail by Bryan Perry
Leveraged High Yield Bond Closed-End Funds Look Attractive
Growth Mail by Gary Alexander
There’s a Lot for Americans to Celebrate This July 4th
Global Mail by Ivan Martchev
The Stock Market is Acting a Little Tired
Sector Spotlight by Jason Bodner
As July Dawns, The Market’s “Silly Season” Begins
View Full Archive
Read Past Issues Here
About The Author

Gary Alexander
SENIOR EDITOR
Gary Alexander has been Senior Writer at Navellier since 2009. He edits Navellier’s weekly Marketmail and writes a weekly Growth Mail column, in which he uses market history to support the case for growth stocks. For the previous 20 years before joining Navellier, he was Senior Executive Editor at InvestorPlace Media (formerly Phillips Publishing), where he worked with several leading investment analysts, including Louis Navellier (since 1997), helping launch Louis Navellier’s Blue Chip Growth and Global Growth newsletters.
Prior to that, Gary edited Wealth Magazine and Gold Newsletter and wrote various investment research reports for Jefferson Financial in New Orleans in the 1980s. He began his financial newsletter career with KCI Communications in 1980, where he served as consulting editor for Personal Finance newsletter while serving as general manager of KCI’s Alexandria House book division. Before that, he covered the economics beat for news magazines. All content of “Growth Mail” represents the opinion of Gary Alexander
Important Disclosures:
Although information in these reports has been obtained from and is based upon sources that Navellier believes to be reliable, Navellier does not guarantee its accuracy and it may be incomplete or condensed. All opinions and estimates constitute Navellier’s judgment as of the date the report was created and are subject to change without notice. These reports are for informational purposes only and are not a solicitation for the purchase or sale of a security. Any decision to purchase securities mentioned in these reports must take into account existing public information on such securities or any registered prospectus.To the extent permitted by law, neither Navellier & Associates, Inc., nor any of its affiliates, agents, or service providers assumes any liability or responsibility nor owes any duty of care for any consequences of any person acting or refraining to act in reliance on the information contained in this communication or for any decision based on it.
Past performance is no indication of future results. Investment in securities involves significant risk and has the potential for partial or complete loss of funds invested. It should not be assumed that any securities recommendations made by Navellier. in the future will be profitable or equal the performance of securities made in this report. Dividend payments are not guaranteed. The amount of a dividend payment, if any, can vary over time and issuers may reduce dividends paid on securities in the event of a recession or adverse event affecting a specific industry or issuer.
None of the stock information, data, and company information presented herein constitutes a recommendation by Navellier or a solicitation to buy or sell any securities. Any specific securities identified and described do not represent all of the securities purchased, sold, or recommended for advisory clients. The holdings identified do not represent all of the securities purchased, sold, or recommended for advisory clients and the reader should not assume that investments in the securities identified and discussed were or will be profitable.
Information presented is general information that does not take into account your individual circumstances, financial situation, or needs, nor does it present a personalized recommendation to you. Individual stocks presented may not be suitable for every investor. Investment in securities involves significant risk and has the potential for partial or complete loss of funds invested. Investment in fixed income securities has the potential for the investment return and principal value of an investment to fluctuate so that an investor’s holdings, when redeemed, may be worth less than their original cost.
One cannot invest directly in an index. Index is unmanaged and index performance does not reflect deduction of fees, expenses, or taxes. Presentation of Index data does not reflect a belief by Navellier that any stock index constitutes an investment alternative to any Navellier equity strategy or is necessarily comparable to such strategies. Among the most important differences between the Indices and Navellier strategies are that the Navellier equity strategies may (1) incur material management fees, (2) concentrate its investments in relatively few stocks, industries, or sectors, (3) have significantly greater trading activity and related costs, and (4) be significantly more or less volatile than the Indices.
ETF Risk: We may invest in exchange traded funds (“ETFs”) and some of our investment strategies are generally fully invested in ETFs. Like traditional mutual funds, ETFs charge asset-based fees, but they generally do not charge initial sales charges or redemption fees and investors typically pay only customary brokerage fees to buy and sell ETF shares. The fees and costs charged by ETFs held in client accounts will not be deducted from the compensation the client pays Navellier. ETF prices can fluctuate up or down, and a client account could lose money investing in an ETF if the prices of the securities owned by the ETF go down. ETFs are subject to additional risks:
- ETF shares may trade above or below their net asset value;
- An active trading market for an ETF’s shares may not develop or be maintained;
- The value of an ETF may be more volatile than the underlying portfolio of securities the ETF is designed to track;
- The cost of owning shares of the ETF may exceed those a client would incur by directly investing in the underlying securities; and
- Trading of an ETF’s shares may be halted if the listing exchange’s officials deem it appropriate, the shares are delisted from the exchange, or the activation of market-wide “circuit breakers” (which are tied to large decreases in stock prices) halts stock trading generally.
Grader Disclosures: Investment in equity strategies involves substantial risk and has the potential for partial or complete loss of funds invested. The sample portfolio and any accompanying charts are for informational purposes only and are not to be construed as a solicitation to buy or sell any financial instrument and should not be relied upon as the sole factor in an investment making decision. As a matter of normal and important disclosures to you, as a potential investor, please consider the following: The performance presented is not based on any actual securities trading, portfolio, or accounts, and the reported performance of the A, B, C, D, and F portfolios (collectively the “model portfolios”) should be considered mere “paper” or pro forma performance results based on Navellier’s research.
Investors evaluating any of Navellier & Associates, Inc.’s, (or its affiliates’) Investment Products must not use any information presented here, including the performance figures of the model portfolios, in their evaluation of any Navellier Investment Products. Navellier Investment Products include the firm’s mutual funds and managed accounts. The model portfolios, charts, and other information presented do not represent actual funded trades and are not actual funded portfolios. There are material differences between Navellier Investment Products’ portfolios and the model portfolios, research, and performance figures presented here. The model portfolios and the research results (1) may contain stocks or ETFs that are illiquid and difficult to trade; (2) may contain stock or ETF holdings materially different from actual funded Navellier Investment Product portfolios; (3) include the reinvestment of all dividends and other earnings, estimated trading costs, commissions, or management fees; and, (4) may not reflect prices obtained in an actual funded Navellier Investment Product portfolio. For these and other reasons, the reported performances of model portfolios do not reflect the performance results of Navellier’s actually funded and traded Investment Products. In most cases, Navellier’s Investment Products have materially lower performance results than the performances of the model portfolios presented.
This report contains statements that are, or may be considered to be, forward-looking statements. All statements that are not historical facts, including statements about our beliefs or expectations, are “forward-looking statements” within the meaning of The U.S. Private Securities Litigation Reform Act of 1995. These statements may be identified by such forward-looking terminology as “expect,” “estimate,” “plan,” “intend,” “believe,” “anticipate,” “may,” “will,” “should,” “could,” “continue,” “project,” or similar statements or variations of such terms. Our forward-looking statements are based on a series of expectations, assumptions, and projections, are not guarantees of future results or performance, and involve substantial risks and uncertainty as described in Form ADV Part 2A of our filing with the Securities and Exchange Commission (SEC), which is available at www.adviserinfo.sec.gov or by requesting a copy by emailing info@navellier.com. All of our forward-looking statements are as of the date of this report only. We can give no assurance that such expectations or forward-looking statements will prove to be correct. Actual results may differ materially. You are urged to carefully consider all such factors.
FEDERAL TAX ADVICE DISCLAIMER: As required by U.S. Treasury Regulations, you are informed that, to the extent this presentation includes any federal tax advice, the presentation is not written by Navellier to be used, and cannot be used, for the purpose of avoiding federal tax penalties. Navellier does not advise on any income tax requirements or issues. Use of any information presented by Navellier is for general information only and does not represent tax advice either express or implied. You are encouraged to seek professional tax advice for income tax questions and assistance.
IMPORTANT NEWSLETTER DISCLOSURE:The hypothetical performance results for investment newsletters that are authored or edited by Louis Navellier, including Louis Navellier’s Growth Investor, Louis Navellier’s Breakthrough Stocks, Louis Navellier’s Accelerated Profits, and Louis Navellier’s Platinum Club, are not based on any actual securities trading, portfolio, or accounts, and the newsletters’ reported hypothetical performances should be considered mere “paper” or proforma hypothetical performance results and are not actual performance of real world trades. Navellier & Associates, Inc. does not have any relation to or affiliation with the owner of these newsletters. There are material differences between Navellier Investment Products’ portfolios and the InvestorPlace Media, LLC newsletter portfolios authored by Louis Navellier. The InvestorPlace Media, LLC newsletters contain hypothetical performance that do not include transaction costs, advisory fees, or other fees a client might incur if actual investments and trades were being made by an investor. As a result, newsletter performance should not be used to evaluate Navellier Investment services which are separate and different from the newsletters. The owner of the newsletters is InvestorPlace Media, LLC and any questions concerning the newsletters, including any newsletter advertising or hypothetical Newsletter performance claims, (which are calculated solely by Investor Place Media and not Navellier) should be referred to InvestorPlace Media, LLC at (800) 718-8289.
Please note that Navellier & Associates and the Navellier Private Client Group are managed completely independent of the newsletters owned and published by InvestorPlace Media, LLC and written and edited by Louis Navellier, and investment performance of the newsletters should in no way be considered indicative of potential future investment performance for any Navellier & Associates separately managed account portfolio. Potential investors should consult with their financial advisor before investing in any Navellier Investment Product.
Navellier claims compliance with Global Investment Performance Standards (GIPS). To receive a complete list and descriptions of Navellier’s composites and/or a presentation that adheres to the GIPS standards, please contact Navellier or click here. It should not be assumed that any securities recommendations made by Navellier & Associates, Inc. in the future will be profitable or equal the performance of securities made in this report.
FactSet Disclosure: Navellier does not independently calculate the statistical information included in the attached report. The calculation and the information are provided by FactSet, a company not related to Navellier. Although information contained in the report has been obtained from FactSet and is based on sources Navellier believes to be reliable, Navellier does not guarantee its accuracy, and it may be incomplete or condensed. The report and the related FactSet sourced information are provided on an “as is” basis. The user assumes the entire risk of any use made of this information. Investors should consider the report as only a single factor in making their investment decision. The report is for informational purposes only and is not intended as an offer or solicitation for the purchase or sale of a security. FactSet sourced information is the exclusive property of FactSet. Without prior written permission of FactSet, this information may not be reproduced, disseminated or used to create any financial products. All indices are unmanaged and performance of the indices include reinvestment of dividends and interest income, unless otherwise noted, are not illustrative of any particular investment and an investment cannot be made in any index. Past performance is no guarantee of future results.