by Jason Bodner
July 2, 2024
As a hockey fan, I’m overjoyed that my secondary favorite (after the Rangers) won the Stanley Cup. But that also means the season is over. Let the silly season begin. Trade rumors heat up, roster moves happen, and other shenanigans. Nerds like me – those who know that “hockey” derives from the French word hoquet, meaning shepherd’s stick – find fun in rumor and innuendo, but daily nonsense has little value.
Historically, stock rumors carry the same value this time of year. Q1 earnings are over. School is out. Summer breezes are here, and things aren’t really “back-to-business-as-usual” until September.
That means some silliness can happen. Stocks will gyrate more in the summer, on lower liquidity. We can see lower liquidity in the form of average big money trading (left) coupled with dwindling breadth (right). The number of stocks making news three-month highs, or lows on abnormal volume, is trending closer to zero as you can see in the yellow wedge pattern (right chart):
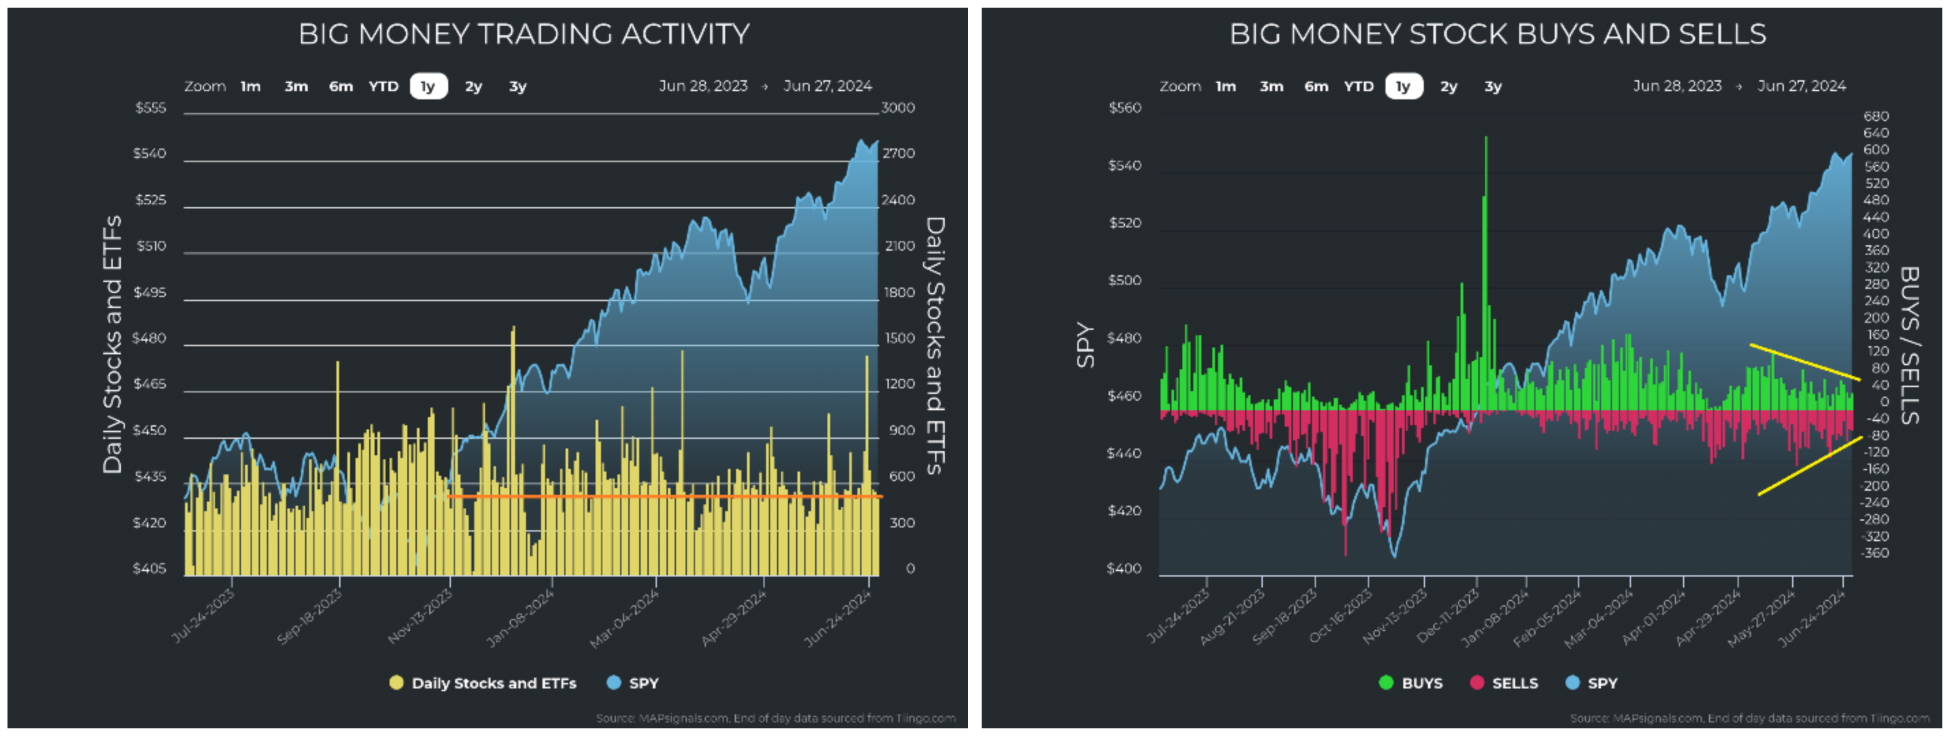
Graphs are for illustrative and discussion purposes only. Please read important disclosures at the end of this commentary.
These lower breadth and liquidity conditions can make for jittery markets, both up and down. For instance, on Friday morning, the market was up nicely with all main indexes up, then it dropped back down. One reason for the rise is that PCE rose at its slowest level since March 2021, which indicates that inflation is moving back towards the Fed’s preferred range, meaning that the path to rate cuts is clearer.
Another reason is that the first presidential debate is now behind us. That debate was not a moment to be proud of in American history, as President Biden appeared a bit frail, which indicates a greater likelihood of a Trump victory. Things may change in the upcoming months, but for now markets love anything implying a trend towards certainty. June 30 is also the end of a quarter, a time for tallying up some profits.
The good news is that most sectors are holding up relatively well. Tech remains our top-ranked sector, which is usually bullish. When a growth-heavy sector leads, that shows strength in the market and the economy. Energy, Industrials, and Financials round out the top four. Discretionary continues its slow rise from the depths of the table, which also bodes well. Utilities are softening after a parabolic rise in the AI universe. The story was that AI will require so much power that utility companies will go into overdrive.
One area I would like to see higher in the table is Healthcare. The sector currently reflects a real tug of war, with mediocre fundamentals and weak technicals dragging down the sector:
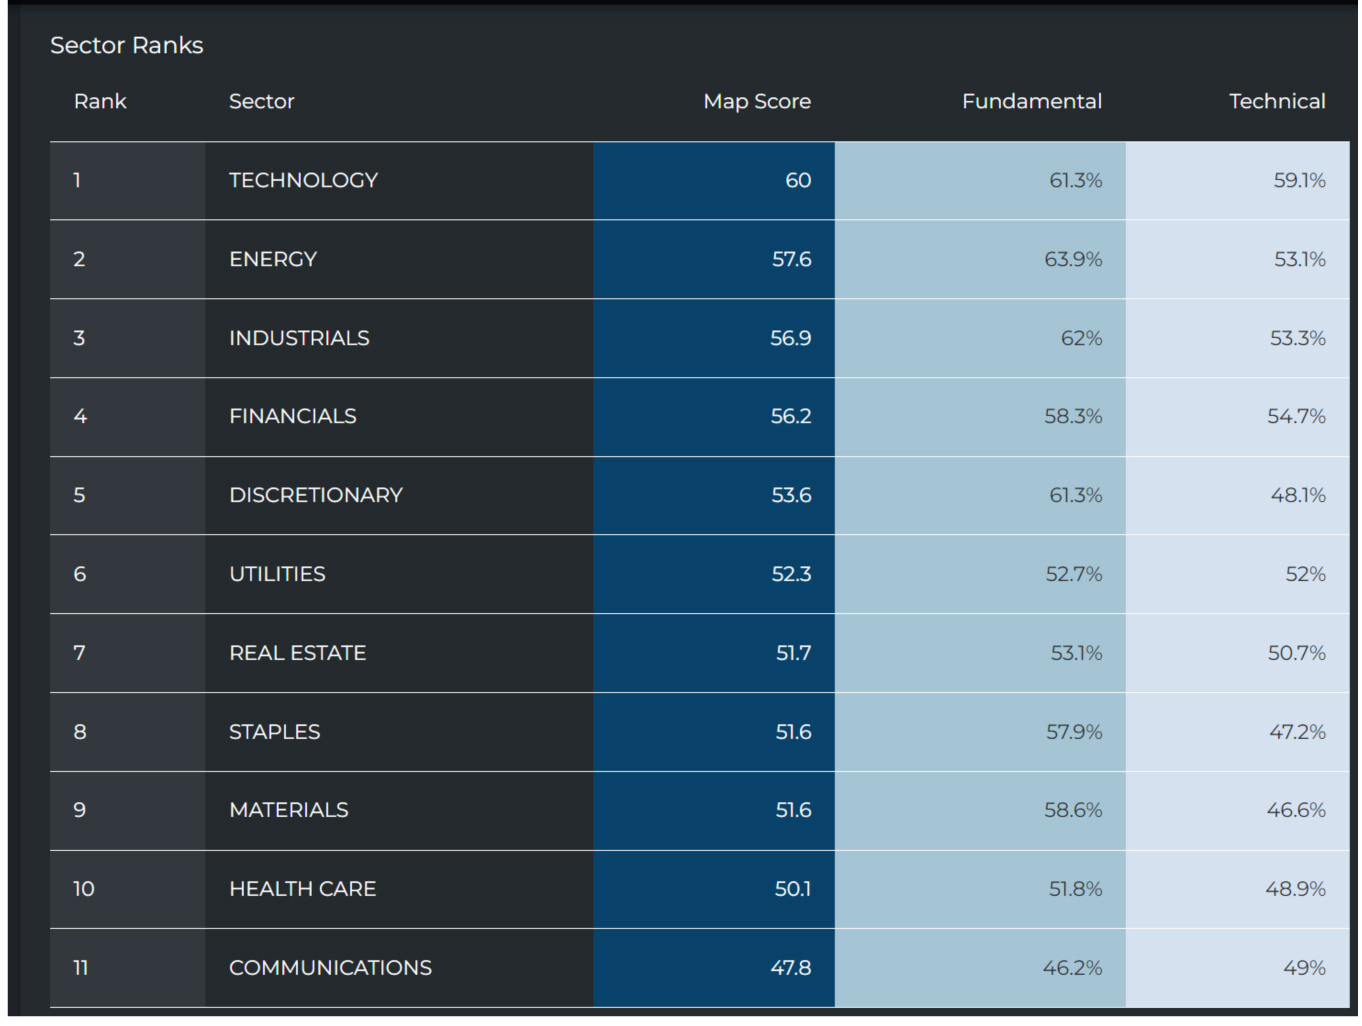
Graphs are for illustrative and discussion purposes only. Please read important disclosures at the end of this commentary.
The bad news is that the price action shows stalling on a sector level. Despite markets hitting new highs, it’s not convincing for a few reasons. The first, as we discussed earlier, is that breadth is weakening. That translates to lower conviction and a few mega-cap stocks hogging up much of the capital. Just around half of the stocks in the S&P 500 remain below their 50-day moving averages:
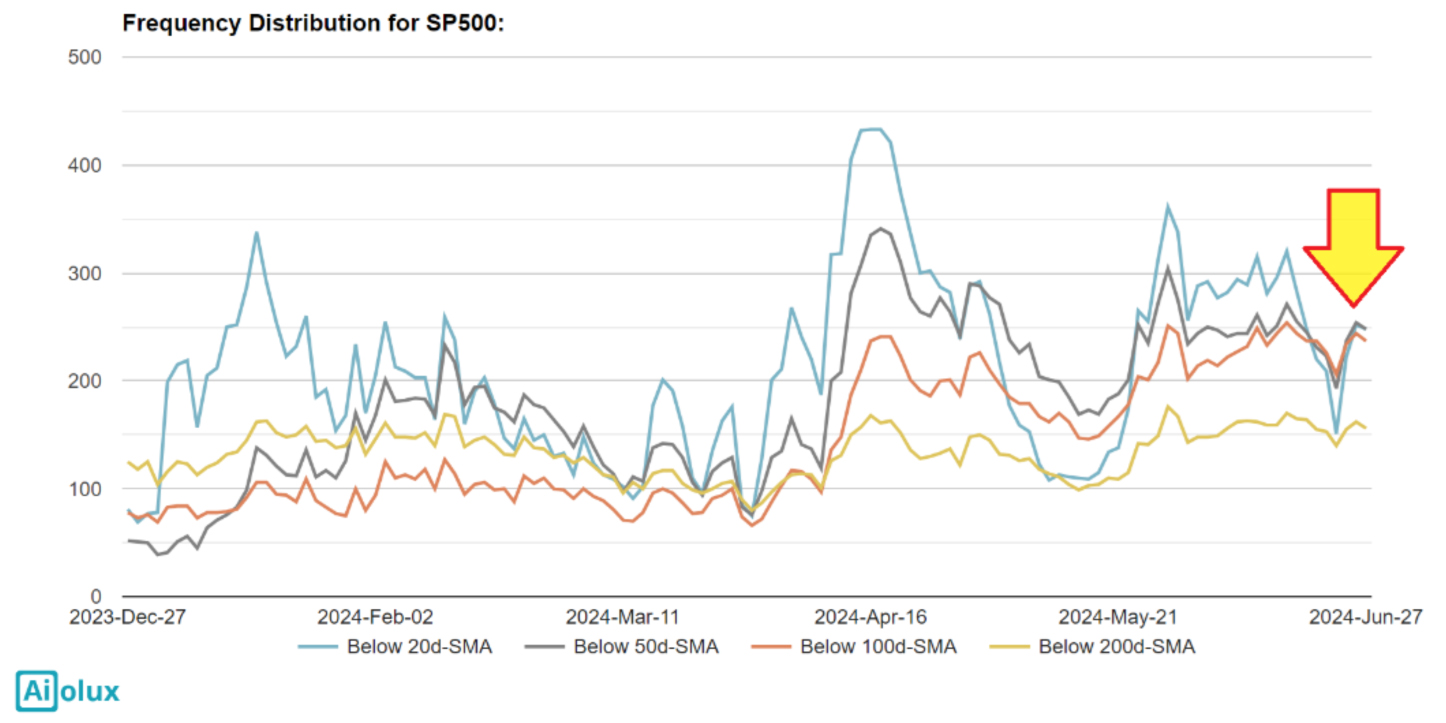
Graphs are for illustrative and discussion purposes only. Please read important disclosures at the end of this commentary.
Price action on a sector level shows no decisive leadership. Tech and discretionary are showing recent technical strength but not much else. Energy is tired, Industrials and Financial are sideways. Utilities are falling back after being heavily overbought. Real Estate is struggling to rise, as are Materials. In fact, the strongest looking sectors for technicals are Staples and Communications, hardly a reason for excitement:
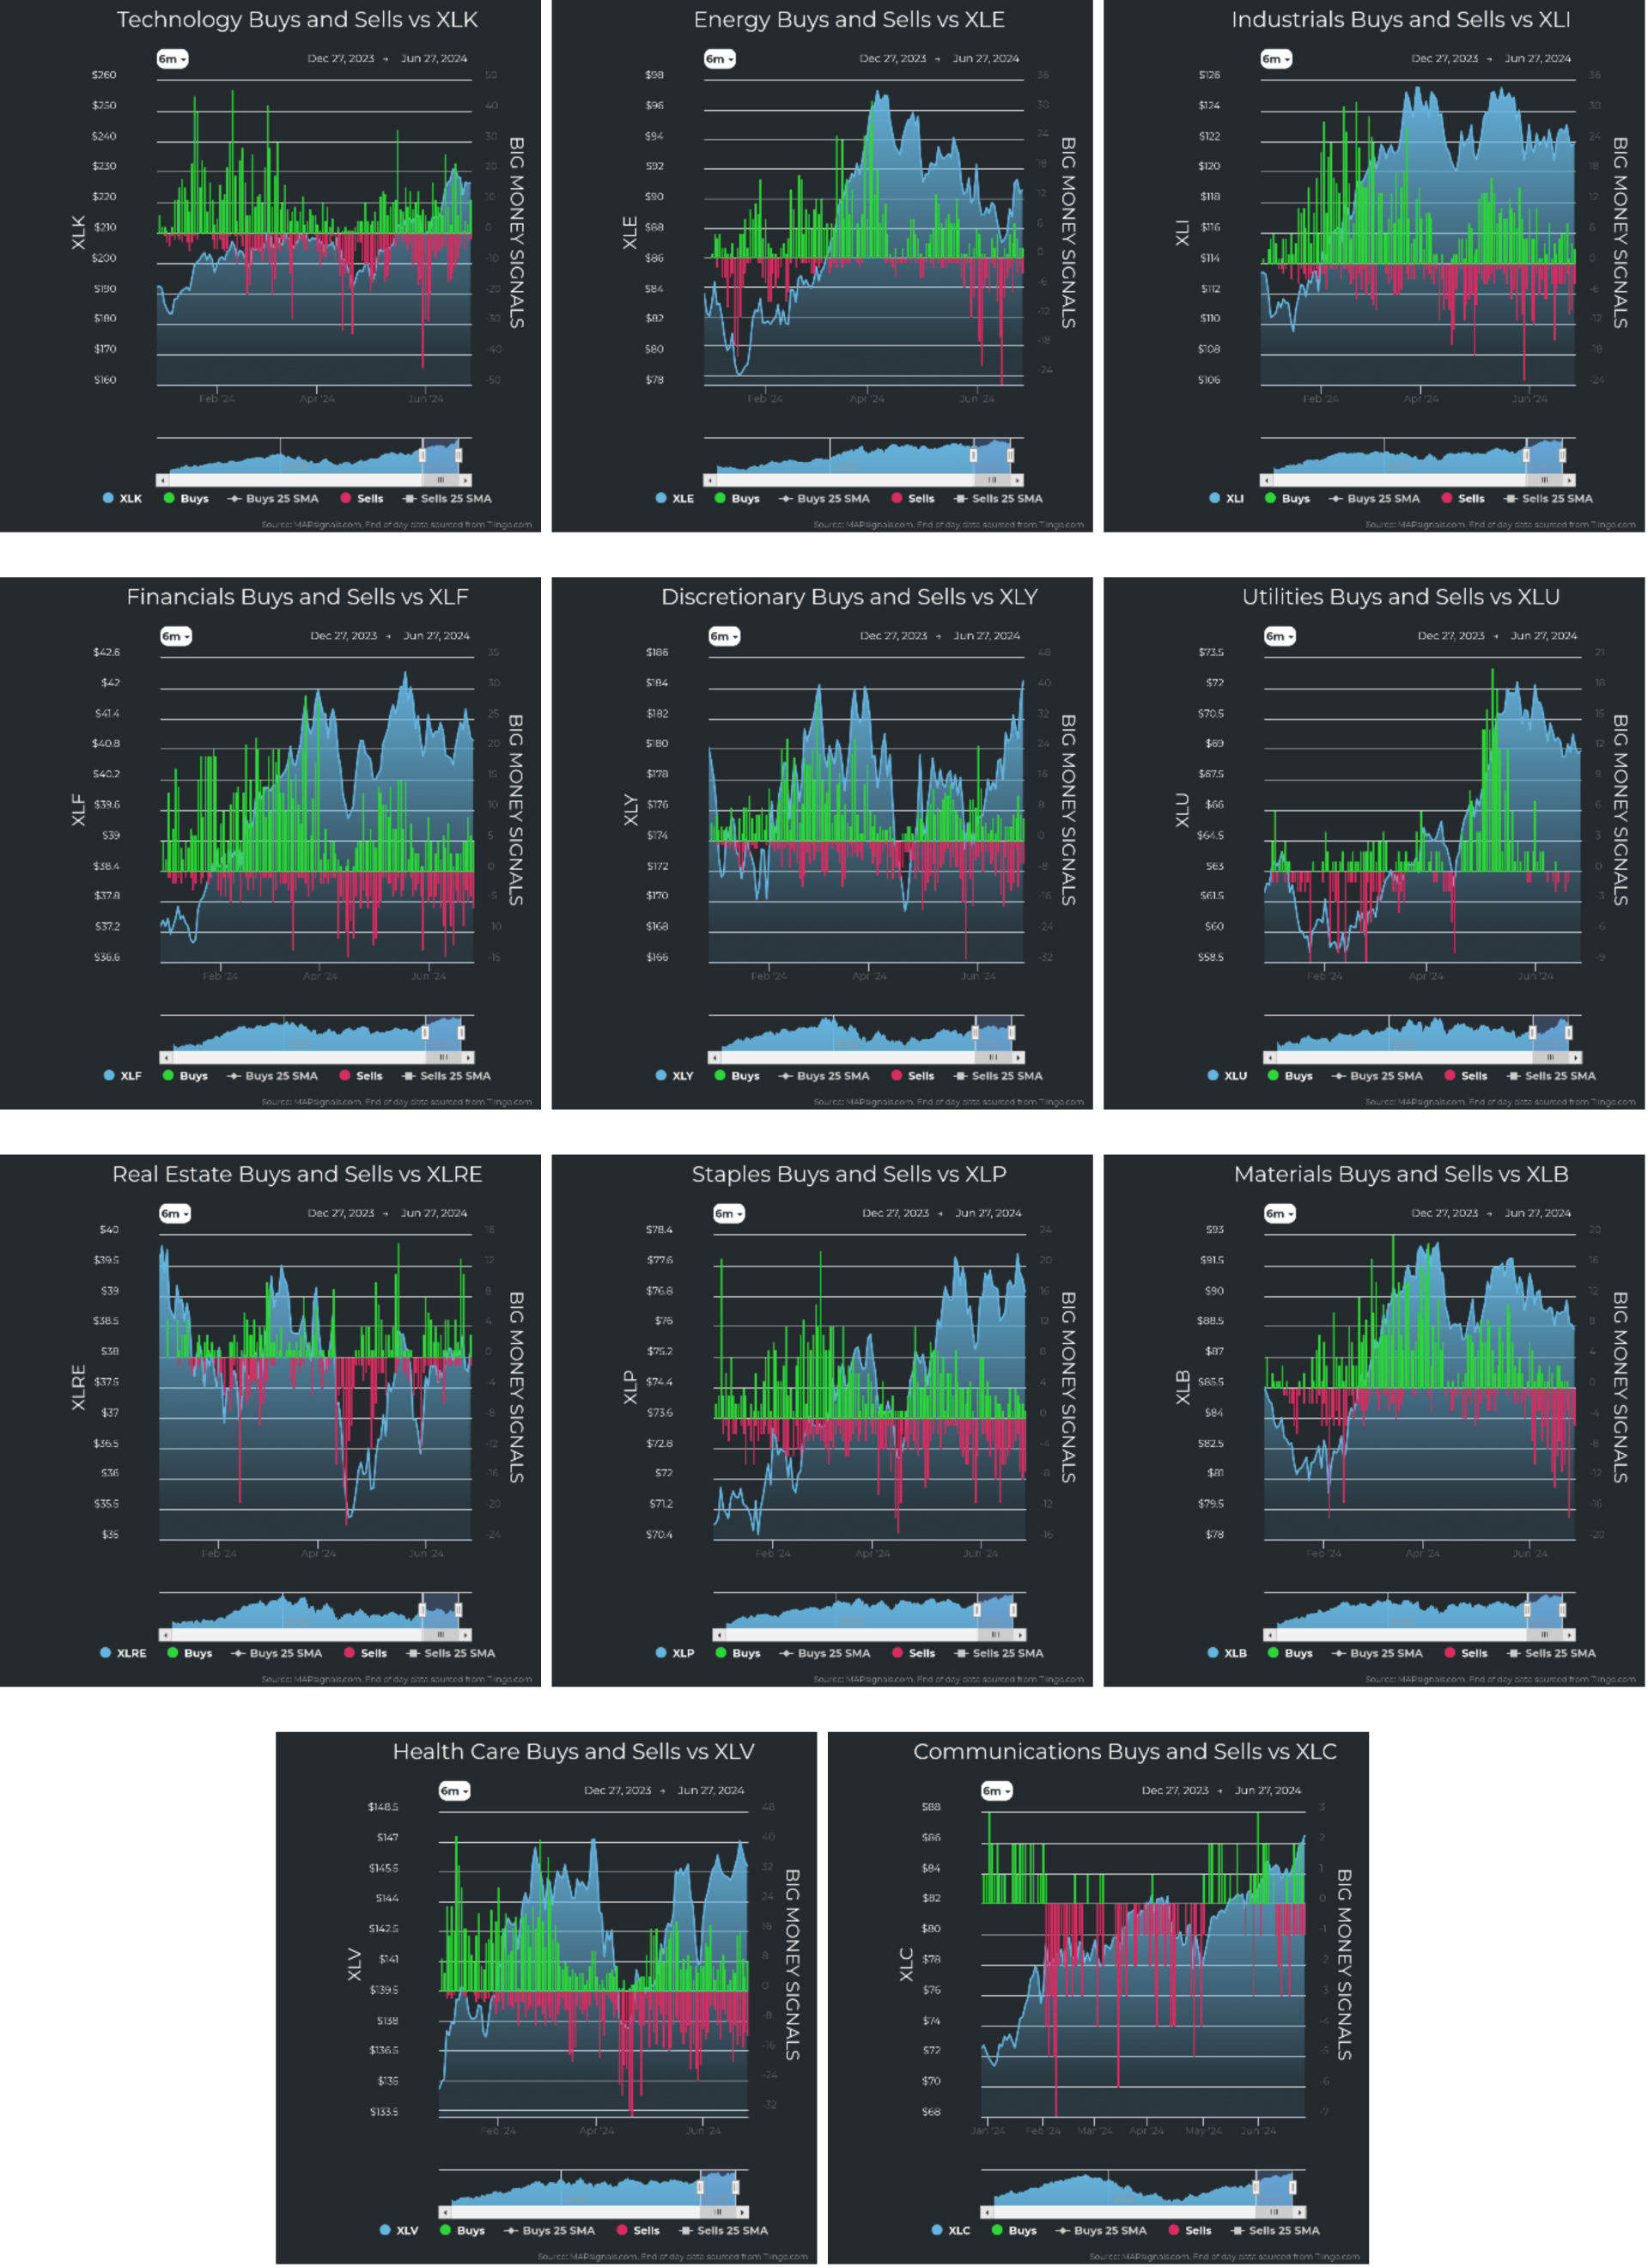
Graphs are for illustrative and discussion purposes only. Please read important disclosures at the end of this commentary.
This all means that, despite a rising index, we see an indecisive market under the surface.
Then there’s the problem of the Big Money Index (BMI). As the market rises (which we now know is powered by mega-cap stocks), the BMI falls. Our first instinct might be to worry as a falling BMI must mean money is gushing out of the market. That could mean the market would crack and fall apart soon.
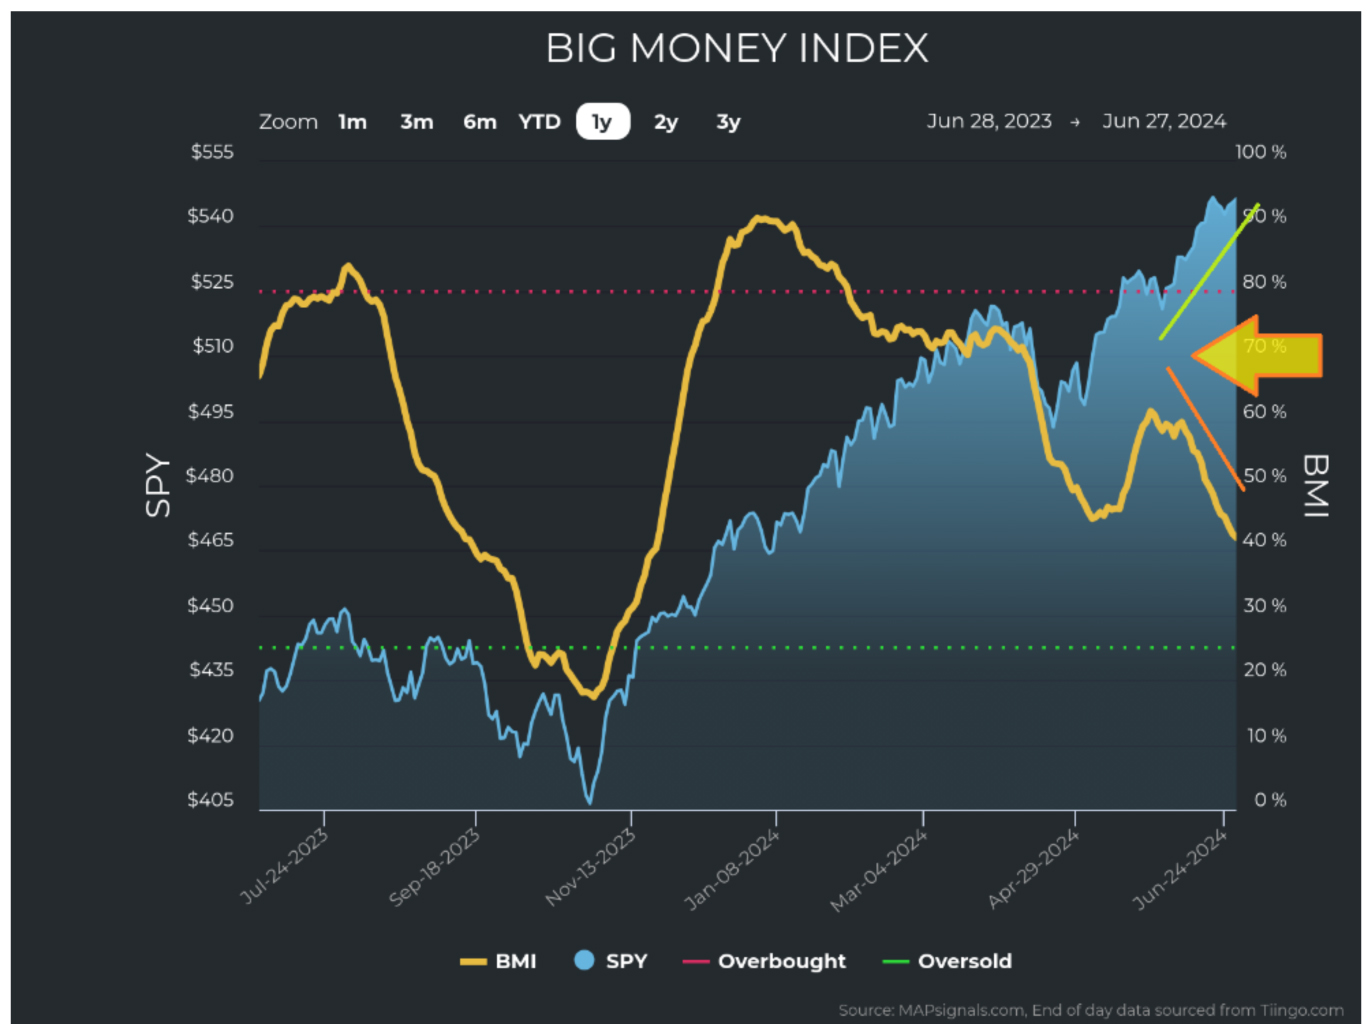
Graphs are for illustrative and discussion purposes only. Please read important disclosures at the end of this commentary.
But that isn’t necessarily true. Since 2005, buying accounts on average for 55% of all signals. That slight imbalance helps explain the long-term up-trend in markets. After all, the Vegas casinos only need slightly more than 50% winning percentages to make enough to fund their staff, real estate and billions in profits.
That slight imbalance would also account for a rising BMI. Therefore, a falling BMI means that selling is increasing, right? The answer, once again, is not necessarily. The BMI can fall when buying slows, even with selling staying level. This is because it is constructed from a 25-day moving average. As the old big buys roll off, the BMI can fall, just because there is less buying pressure.
That is the current case, as seen in the wedge pattern of buying versus selling, but the fall in the BMI has been dramatic. Since its peak at 91 on January 3rd, it has fallen 54% (49 points) to 42, a drastic drop.
I wanted to see what that means for the future. I already mentioned that heavy selling can pressure a BMI to drop, but so can a slowdown in buying. As this is the case, I wanted to compare similar times in history to the current situation, so I took data starting in 1990 and looked for all the times that this happened:
- Whenever the BMI dropped from overbought (from 80 or above), and:
- It dropped between 45 and 55 points (like the recent 49-point drop).
I found 58 such instances: The forward returns were quite good, and the frequency of wins was high:
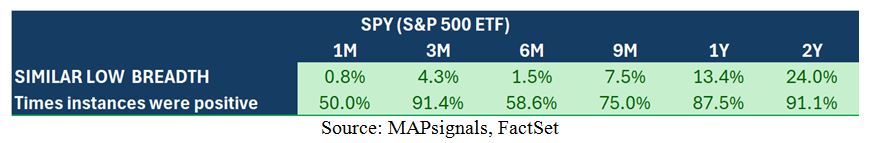
Graphs are for illustrative and discussion purposes only. Please read important disclosures at the end of this commentary.
Knowing this, I wanted to refine the search further, given that currently breadth is low. Stocks are neither getting bought nor sold convincingly, so I added an extra layer of filtering to find times that buying and selling, while low in number, were also balanced closely. In other words, if buys and sells came close to cancelling each other out. There were 30 instances. Again, future returns were good, with high frequency:
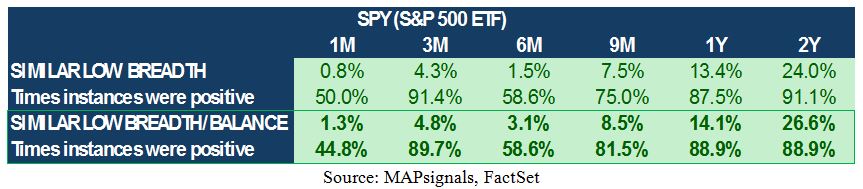
Graphs are for illustrative and discussion purposes only. Please read important disclosures at the end of this commentary.
It will be interesting to see how this turns out, but the current data tell me not to overreact by preparing for Armageddon. July should be strong, followed by the usual bumpy August and September.
To know where we might be headed, it helps to know where we’ve been.
“If a man knows not to which port he sails, no wind is favorable.” – Seneca

All content above represents the opinion of Jason Bodner of Navellier & Associates, Inc.
Also In This Issue
A Look Ahead by Louis Navellier
Will Election Year Chaos Torpedo This Bull Market?
Income Mail by Bryan Perry
Leveraged High Yield Bond Closed-End Funds Look Attractive
Growth Mail by Gary Alexander
There’s a Lot for Americans to Celebrate This July 4th
Global Mail by Ivan Martchev
The Stock Market is Acting a Little Tired
Sector Spotlight by Jason Bodner
As July Dawns, The Market’s “Silly Season” Begins
View Full Archive
Read Past Issues Here

Jason Bodner
MARKETMAIL EDITOR FOR SECTOR SPOTLIGHT
Jason Bodner writes Sector Spotlight in the weekly Marketmail publication and has authored several white papers for the company. He is also Co-Founder of Macro Analytics for Professionals which produces proprietary equity accumulation/distribution research for its clients. Previously, Mr. Bodner served as Director of European Equity Derivatives for Cantor Fitzgerald Europe in London, then moved to the role of Head of Equity Derivatives North America for the same company in New York. He also served as S.V.P. Equity Derivatives for Jefferies, LLC. He received a B.S. in business administration in 1996, with honors, from Skidmore College as a member of the Periclean Honors Society. All content of “Sector Spotlight” represents the opinion of Jason Bodner
Important Disclosures:
Jason Bodner is a co-founder and co-owner of Mapsignals. Mr. Bodner is an independent contractor who is occasionally hired by Navellier & Associates to write an article and or provide opinions for possible use in articles that appear in Navellier & Associates weekly Market Mail. Mr. Bodner is not employed or affiliated with Louis Navellier, Navellier & Associates, Inc., or any other Navellier owned entity. The opinions and statements made here are those of Mr. Bodner and not necessarily those of any other persons or entities. This is not an endorsement, or solicitation or testimonial or investment advice regarding the BMI Index or any statements or recommendations or analysis in the article or the BMI Index or Mapsignals or its products or strategies.
Although information in these reports has been obtained from and is based upon sources that Navellier believes to be reliable, Navellier does not guarantee its accuracy and it may be incomplete or condensed. All opinions and estimates constitute Navellier’s judgment as of the date the report was created and are subject to change without notice. These reports are for informational purposes only and are not a solicitation for the purchase or sale of a security. Any decision to purchase securities mentioned in these reports must take into account existing public information on such securities or any registered prospectus.To the extent permitted by law, neither Navellier & Associates, Inc., nor any of its affiliates, agents, or service providers assumes any liability or responsibility nor owes any duty of care for any consequences of any person acting or refraining to act in reliance on the information contained in this communication or for any decision based on it.
Past performance is no indication of future results. Investment in securities involves significant risk and has the potential for partial or complete loss of funds invested. It should not be assumed that any securities recommendations made by Navellier. in the future will be profitable or equal the performance of securities made in this report. Dividend payments are not guaranteed. The amount of a dividend payment, if any, can vary over time and issuers may reduce dividends paid on securities in the event of a recession or adverse event affecting a specific industry or issuer.
None of the stock information, data, and company information presented herein constitutes a recommendation by Navellier or a solicitation to buy or sell any securities. Any specific securities identified and described do not represent all of the securities purchased, sold, or recommended for advisory clients. The holdings identified do not represent all of the securities purchased, sold, or recommended for advisory clients and the reader should not assume that investments in the securities identified and discussed were or will be profitable.
Information presented is general information that does not take into account your individual circumstances, financial situation, or needs, nor does it present a personalized recommendation to you. Individual stocks presented may not be suitable for every investor. Investment in securities involves significant risk and has the potential for partial or complete loss of funds invested. Investment in fixed income securities has the potential for the investment return and principal value of an investment to fluctuate so that an investor’s holdings, when redeemed, may be worth less than their original cost.
One cannot invest directly in an index. Index is unmanaged and index performance does not reflect deduction of fees, expenses, or taxes. Presentation of Index data does not reflect a belief by Navellier that any stock index constitutes an investment alternative to any Navellier equity strategy or is necessarily comparable to such strategies. Among the most important differences between the Indices and Navellier strategies are that the Navellier equity strategies may (1) incur material management fees, (2) concentrate its investments in relatively few stocks, industries, or sectors, (3) have significantly greater trading activity and related costs, and (4) be significantly more or less volatile than the Indices.
ETF Risk: We may invest in exchange traded funds (“ETFs”) and some of our investment strategies are generally fully invested in ETFs. Like traditional mutual funds, ETFs charge asset-based fees, but they generally do not charge initial sales charges or redemption fees and investors typically pay only customary brokerage fees to buy and sell ETF shares. The fees and costs charged by ETFs held in client accounts will not be deducted from the compensation the client pays Navellier. ETF prices can fluctuate up or down, and a client account could lose money investing in an ETF if the prices of the securities owned by the ETF go down. ETFs are subject to additional risks:
- ETF shares may trade above or below their net asset value;
- An active trading market for an ETF’s shares may not develop or be maintained;
- The value of an ETF may be more volatile than the underlying portfolio of securities the ETF is designed to track;
- The cost of owning shares of the ETF may exceed those a client would incur by directly investing in the underlying securities; and
- Trading of an ETF’s shares may be halted if the listing exchange’s officials deem it appropriate, the shares are delisted from the exchange, or the activation of market-wide “circuit breakers” (which are tied to large decreases in stock prices) halts stock trading generally.
Grader Disclosures: Investment in equity strategies involves substantial risk and has the potential for partial or complete loss of funds invested. The sample portfolio and any accompanying charts are for informational purposes only and are not to be construed as a solicitation to buy or sell any financial instrument and should not be relied upon as the sole factor in an investment making decision. As a matter of normal and important disclosures to you, as a potential investor, please consider the following: The performance presented is not based on any actual securities trading, portfolio, or accounts, and the reported performance of the A, B, C, D, and F portfolios (collectively the “model portfolios”) should be considered mere “paper” or pro forma performance results based on Navellier’s research.
Investors evaluating any of Navellier & Associates, Inc.’s, (or its affiliates’) Investment Products must not use any information presented here, including the performance figures of the model portfolios, in their evaluation of any Navellier Investment Products. Navellier Investment Products include the firm’s mutual funds and managed accounts. The model portfolios, charts, and other information presented do not represent actual funded trades and are not actual funded portfolios. There are material differences between Navellier Investment Products’ portfolios and the model portfolios, research, and performance figures presented here. The model portfolios and the research results (1) may contain stocks or ETFs that are illiquid and difficult to trade; (2) may contain stock or ETF holdings materially different from actual funded Navellier Investment Product portfolios; (3) include the reinvestment of all dividends and other earnings, estimated trading costs, commissions, or management fees; and, (4) may not reflect prices obtained in an actual funded Navellier Investment Product portfolio. For these and other reasons, the reported performances of model portfolios do not reflect the performance results of Navellier’s actually funded and traded Investment Products. In most cases, Navellier’s Investment Products have materially lower performance results than the performances of the model portfolios presented.
This report contains statements that are, or may be considered to be, forward-looking statements. All statements that are not historical facts, including statements about our beliefs or expectations, are “forward-looking statements” within the meaning of The U.S. Private Securities Litigation Reform Act of 1995. These statements may be identified by such forward-looking terminology as “expect,” “estimate,” “plan,” “intend,” “believe,” “anticipate,” “may,” “will,” “should,” “could,” “continue,” “project,” or similar statements or variations of such terms. Our forward-looking statements are based on a series of expectations, assumptions, and projections, are not guarantees of future results or performance, and involve substantial risks and uncertainty as described in Form ADV Part 2A of our filing with the Securities and Exchange Commission (SEC), which is available at www.adviserinfo.sec.gov or by requesting a copy by emailing info@navellier.com. All of our forward-looking statements are as of the date of this report only. We can give no assurance that such expectations or forward-looking statements will prove to be correct. Actual results may differ materially. You are urged to carefully consider all such factors.
FEDERAL TAX ADVICE DISCLAIMER: As required by U.S. Treasury Regulations, you are informed that, to the extent this presentation includes any federal tax advice, the presentation is not written by Navellier to be used, and cannot be used, for the purpose of avoiding federal tax penalties. Navellier does not advise on any income tax requirements or issues. Use of any information presented by Navellier is for general information only and does not represent tax advice either express or implied. You are encouraged to seek professional tax advice for income tax questions and assistance.
IMPORTANT NEWSLETTER DISCLOSURE:The hypothetical performance results for investment newsletters that are authored or edited by Louis Navellier, including Louis Navellier’s Growth Investor, Louis Navellier’s Breakthrough Stocks, Louis Navellier’s Accelerated Profits, and Louis Navellier’s Platinum Club, are not based on any actual securities trading, portfolio, or accounts, and the newsletters’ reported hypothetical performances should be considered mere “paper” or proforma hypothetical performance results and are not actual performance of real world trades. Navellier & Associates, Inc. does not have any relation to or affiliation with the owner of these newsletters. There are material differences between Navellier Investment Products’ portfolios and the InvestorPlace Media, LLC newsletter portfolios authored by Louis Navellier. The InvestorPlace Media, LLC newsletters contain hypothetical performance that do not include transaction costs, advisory fees, or other fees a client might incur if actual investments and trades were being made by an investor. As a result, newsletter performance should not be used to evaluate Navellier Investment services which are separate and different from the newsletters. The owner of the newsletters is InvestorPlace Media, LLC and any questions concerning the newsletters, including any newsletter advertising or hypothetical Newsletter performance claims, (which are calculated solely by Investor Place Media and not Navellier) should be referred to InvestorPlace Media, LLC at (800) 718-8289.
Please note that Navellier & Associates and the Navellier Private Client Group are managed completely independent of the newsletters owned and published by InvestorPlace Media, LLC and written and edited by Louis Navellier, and investment performance of the newsletters should in no way be considered indicative of potential future investment performance for any Navellier & Associates separately managed account portfolio. Potential investors should consult with their financial advisor before investing in any Navellier Investment Product.
Navellier claims compliance with Global Investment Performance Standards (GIPS). To receive a complete list and descriptions of Navellier’s composites and/or a presentation that adheres to the GIPS standards, please contact Navellier or click here. It should not be assumed that any securities recommendations made by Navellier & Associates, Inc. in the future will be profitable or equal the performance of securities made in this report.
FactSet Disclosure: Navellier does not independently calculate the statistical information included in the attached report. The calculation and the information are provided by FactSet, a company not related to Navellier. Although information contained in the report has been obtained from FactSet and is based on sources Navellier believes to be reliable, Navellier does not guarantee its accuracy, and it may be incomplete or condensed. The report and the related FactSet sourced information are provided on an “as is” basis. The user assumes the entire risk of any use made of this information. Investors should consider the report as only a single factor in making their investment decision. The report is for informational purposes only and is not intended as an offer or solicitation for the purchase or sale of a security. FactSet sourced information is the exclusive property of FactSet. Without prior written permission of FactSet, this information may not be reproduced, disseminated or used to create any financial products. All indices are unmanaged and performance of the indices include reinvestment of dividends and interest income, unless otherwise noted, are not illustrative of any particular investment and an investment cannot be made in any index. Past performance is no guarantee of future results.