by Ivan Martchev
June 6, 2023
The stock market, as represented by its most widely followed benchmark, the S&P 500, made a new high for 2023 last Friday. There are a lot of problems with this rally, but a new high is still a new high. The fact that only 10 stocks – mainly the tech mega-caps driven by the AI mania – make up over 90% of the gains for the year is not important for holders of index funds, which are seeing appreciation.
On Friday, though, something important happened: The rally broadened out. Techs underperformed and small caps, financials, and all kinds of cyclical groups were on fire. Can this continue all summer long?
That would depend a lot on the economic data, which has been mixed of late but is still not indicating an imminent recession. The weird part is that indicators for the service part of the economy are accelerating while manufacturing indexes indicate an imminent recession, but since the economy is ⅔ services, the whole is actually holding up. The Fed already signaled a pause, which should in theory be the end of the Fed rate hiking cycle. If inflation starts to decline precipitously, which should be the case due to the lags of monetary policy kicking in, and the overall shrinkage of money supply, and we don’t go into a recession in 2023, Fed Chair Jerome Powell will look very good, given the litany of major policy mistakes he has made so far in two terms as Fed Chairman. He may yet save his legacy.
Graphs are for illustrative and discussion purposes only. Please read important disclosures at the end of this commentary.
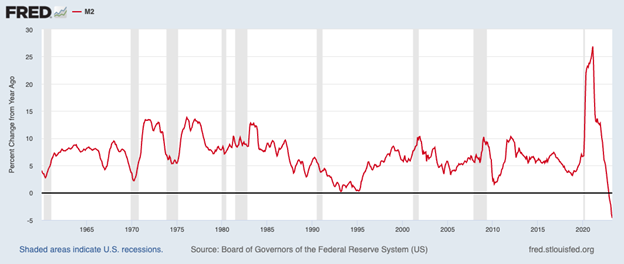
The shrinkage in M2 money supply is unprecedented. It had never shrunk on a year-over-year basis since records have been kept (since 1959), and now it has shrunk five months in a row, declining by 4.6% for April, the latest reported month. I am sure that inflation will decline precipitously by the end of 2023. I just don’t know the exact number. I would not be surprised if we see 2%-3% inflation by the end of 2023.
Graphs are for illustrative and discussion purposes only. Please read important disclosures at the end of this commentary.
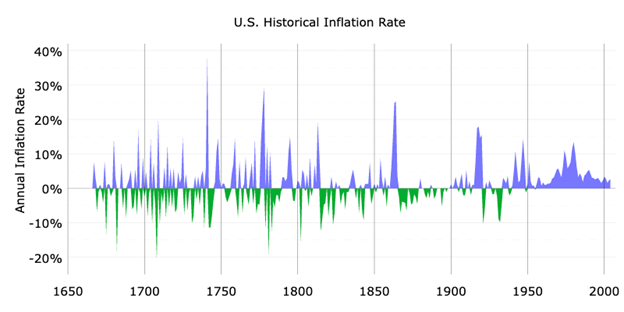
Officialdata.org has inflation numbers going back to 1635, using old colonial sources, which clearly show some swings of 10% to 15% deflation (per year) for a significant period of time, as well as similar spikes of inflation. All that is smoothed out after 1913, after the creation of the Federal Reserve, which gets a grip on money supply growth and hence inflation. Based just on the horrific swings between inflation and deflation before the Fed was created, I am pretty sure we had surges and shrinkages in money supply, where the dollar at the time was mostly on the gold standard. Due to numerous banking failures during the Great Depression, we probably had a shrinkage in money supply too, especially from 1930 to 1932. After the Great Depression, however, the present shrinkage in M2 money supply is unprecedented.
The Pure Technicals Point to Another 9% Surge in the Stock Market
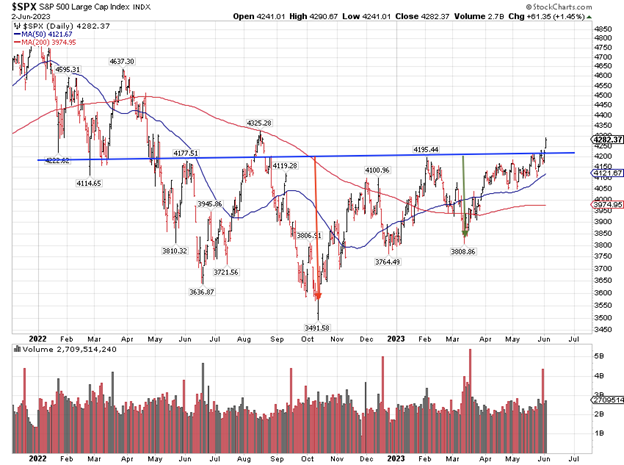
Technically, we see a bottoming formation, in the form of a series of rising lows and slightly rising highs. The February 2023 highs to the March 2023 lows is roughly 400 SPX points. We just took out the February highs, so a measured move is +400 SPX points or thereabouts, to 4600 by the end of the year.
A bigger move is between the neckline near 4200 and the October 2022 lows near 3600 (much lower intraday), that is about 600 points. That puts a target for the rally at 4800 or so for the S&P 500.
Graphs are for illustrative and discussion purposes only. Please read important disclosures at the end of this commentary.
The only way the more realistic target of 4600 – or the more ambitious target of 4800 – is achievable is if we avoid a recession and the rally broadens out. The other necessary requirements are for the Fed to be done, and inflation to decline meaningfully by the end of 2023, giving the market a reason to celebrate.
I know there are plenty of reasons to worry, but looking at pure technicals now, the glass looks half full.
All content above represents the opinion of Ivan Martchev of Navellier & Associates, Inc.
Also In This Issue
A Look Ahead by Louis Navellier
“AI” Is Hot, But Don’t Get Burned
Income Mail by Bryan Perry
The Market Breaks Out as Debt Increases and Money Supply Decreases
Growth Mail by Gary Alexander
Ideology is Limiting Growth in the World’s Top 3 Economies
Global Mail by Ivan Martchev
Recession is Still Nowhere to be Seen
Sector Spotlight by Jason Bodner
How is Your Team (of Stocks) Doing?
View Full Archive
Read Past Issues Here

Ivan Martchev
INVESTMENT STRATEGIST
Ivan Martchev is an investment strategist with Navellier. Previously, Ivan served as editorial director at InvestorPlace Media. Ivan was editor of Louis Rukeyser’s Mutual Funds and associate editor of Personal Finance. Ivan is also co-author of The Silk Road to Riches (Financial Times Press). The book provided analysis of geopolitical issues and investment strategy in natural resources and emerging markets with an emphasis on Asia. The book also correctly predicted the collapse in the U.S. real estate market, the rise of precious metals, and the resulting increased investor interest in emerging markets. Ivan’s commentaries have been published by MSNBC, The Motley Fool, MarketWatch, and others. All content of “Global Mail” represents the opinion of Ivan Martchev