by Jason Bodner
May 7, 2024
Music is powerful.
Think of how many times in your life, a great song came into your mind, and you were instantly transported to a memory, or a mood, or even an imaginary place.
For me, there’s always music on, and it’s not just in the air. It’s in my head; I can’t turn it off. I dream music. In fact, I need music playing while I work, otherwise I get distracted by the music inside my head.
As far as afflictions go, it’s one I welcome, so, as I write this, my Spotify playlist is spinning. It picks new stuff I’ve never heard based on what I’ve been listening to. I highly recommend it if you’ve never tried it.
I see markets the same way I see music, like notes on a page making sense. To the non-musician, notes on a page can look like chaotic meaningless hieroglyphs, random dots and lines. But to those who can decipher them, a sheet of music is code for what can come out as sublime mood-altering stuff.
Market movements also can also look like gobbledygook. To the informed however, there’s decipherable code revealing pictures not evident to the untrained. Patterns are everywhere.
Illustrating the point, I found two recent studies showing a strong correlation between what music people are listening to and market performance. Here is an abstract of a 2012 study by Phillip Maymin:
Popular music may presage market conditions because people contemplating complex future economic behavior prefer simpler music, and vice versa. In comparing the annual average beat variance of the songs in the U.S. Billboard Top 100 since its inception in 1958 through 2007 to the standard deviation of returns of the S&P 500 for the same or the subsequent year, a significant negative correlation is observed. Furthermore, the beat variance appears able to predict future market volatility, producing 2.5 volatility points of profit per year on average.
Whoa!
And this is from the Harvard Business Review:
Alex Edmans of London Business School and three coauthors gathered data on the positivity of songs that people in 40 nations listened to on Spotify. The researchers then compared that data with the performance of each country’s national stock market over the same period. They wanted to see if there was a correlation between mood, as reflected by the music played, and financial returns. There was. The conclusion: When people listen to happy songs, the market outperforms.
Historically, markets outperform from November to April, so I guess investors were listening to some crazy happy music in winter. Then tax time rolled around and killed everyone’s mood. It would be interesting to see what’s trending in May, because it seems like the market stayed positive in early May.
First on this week’s hit parade, I’ll discuss the Fed’s influence on markets last week, and then we will look at some of the market’s latest sheet music to tell us what might be happening next…
The Fed’s Music Maestro Takes to the Podium on May Day
Naturally, there was a lot of cheer in stocks in the first few days of May, coming on the heels of the Fed meeting. I listened to Jerome Powell’s statement and subsequent Q&A period. Here’s how I interpreted it:
- The Target rate remains unchanged at 5.25 to 5.5%. The Fed is continuing to reduce securities holdings. The economy made progress, and inflation eased in the past month, with the PCE (Personal Consumption Expenditures) inflation index at 2.7%. Consumer spending is strong, as is the labor market.
- The short-term is less certain, but long-term inflation looks better. Treasuries purchases are slowing from $60 billion to $25 billion per month in June. In short, the Fed is patient, and the statement was dovish.
The Q&A was even more dovish, with the Fed chair making these bullish points:
- The job market is getting closer to pre-pandemic levels.
- Hikes are unlikely; the question is how long will the Fed stay restrictive?
- Cuts are coming if inflation continues to trend toward 2%.
- Housing was a bit sticky, but that data lags and takes a long time to work through the system.
- Stagflation isn’t a risk. Usually that term implies near-double-digit inflation and jobless rates.
- The Fed doesn’t get involved in politics near the election, so I say they make two rate cuts before then.
- Other countries are cutting because they have no growth and inflation. We have growth with inflation.
Now, if we decipher the market code, we can get a clearer picture: Reading between the lines, Powell’s comments were positive, so stocks continued cheering on Friday, despite a weak jobs report, since that signals a higher probability of a rate cut. The sooner we get that cut, the sooner the rally will accelerate.
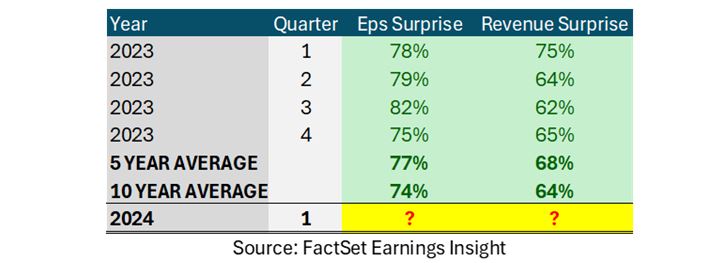
First-quarter earnings are working. As of May 3, 80% of S&P 500 companies have reported and 77% reported earnings above estimates, which is above the 10-year average of 74%, and 61% have beaten revenue estimates, which is below the 10-year average of 64%, according to FactSet Earnings Insights.
Graphs are for illustrative and discussion purposes only. Please read important disclosures at the end of this commentary.
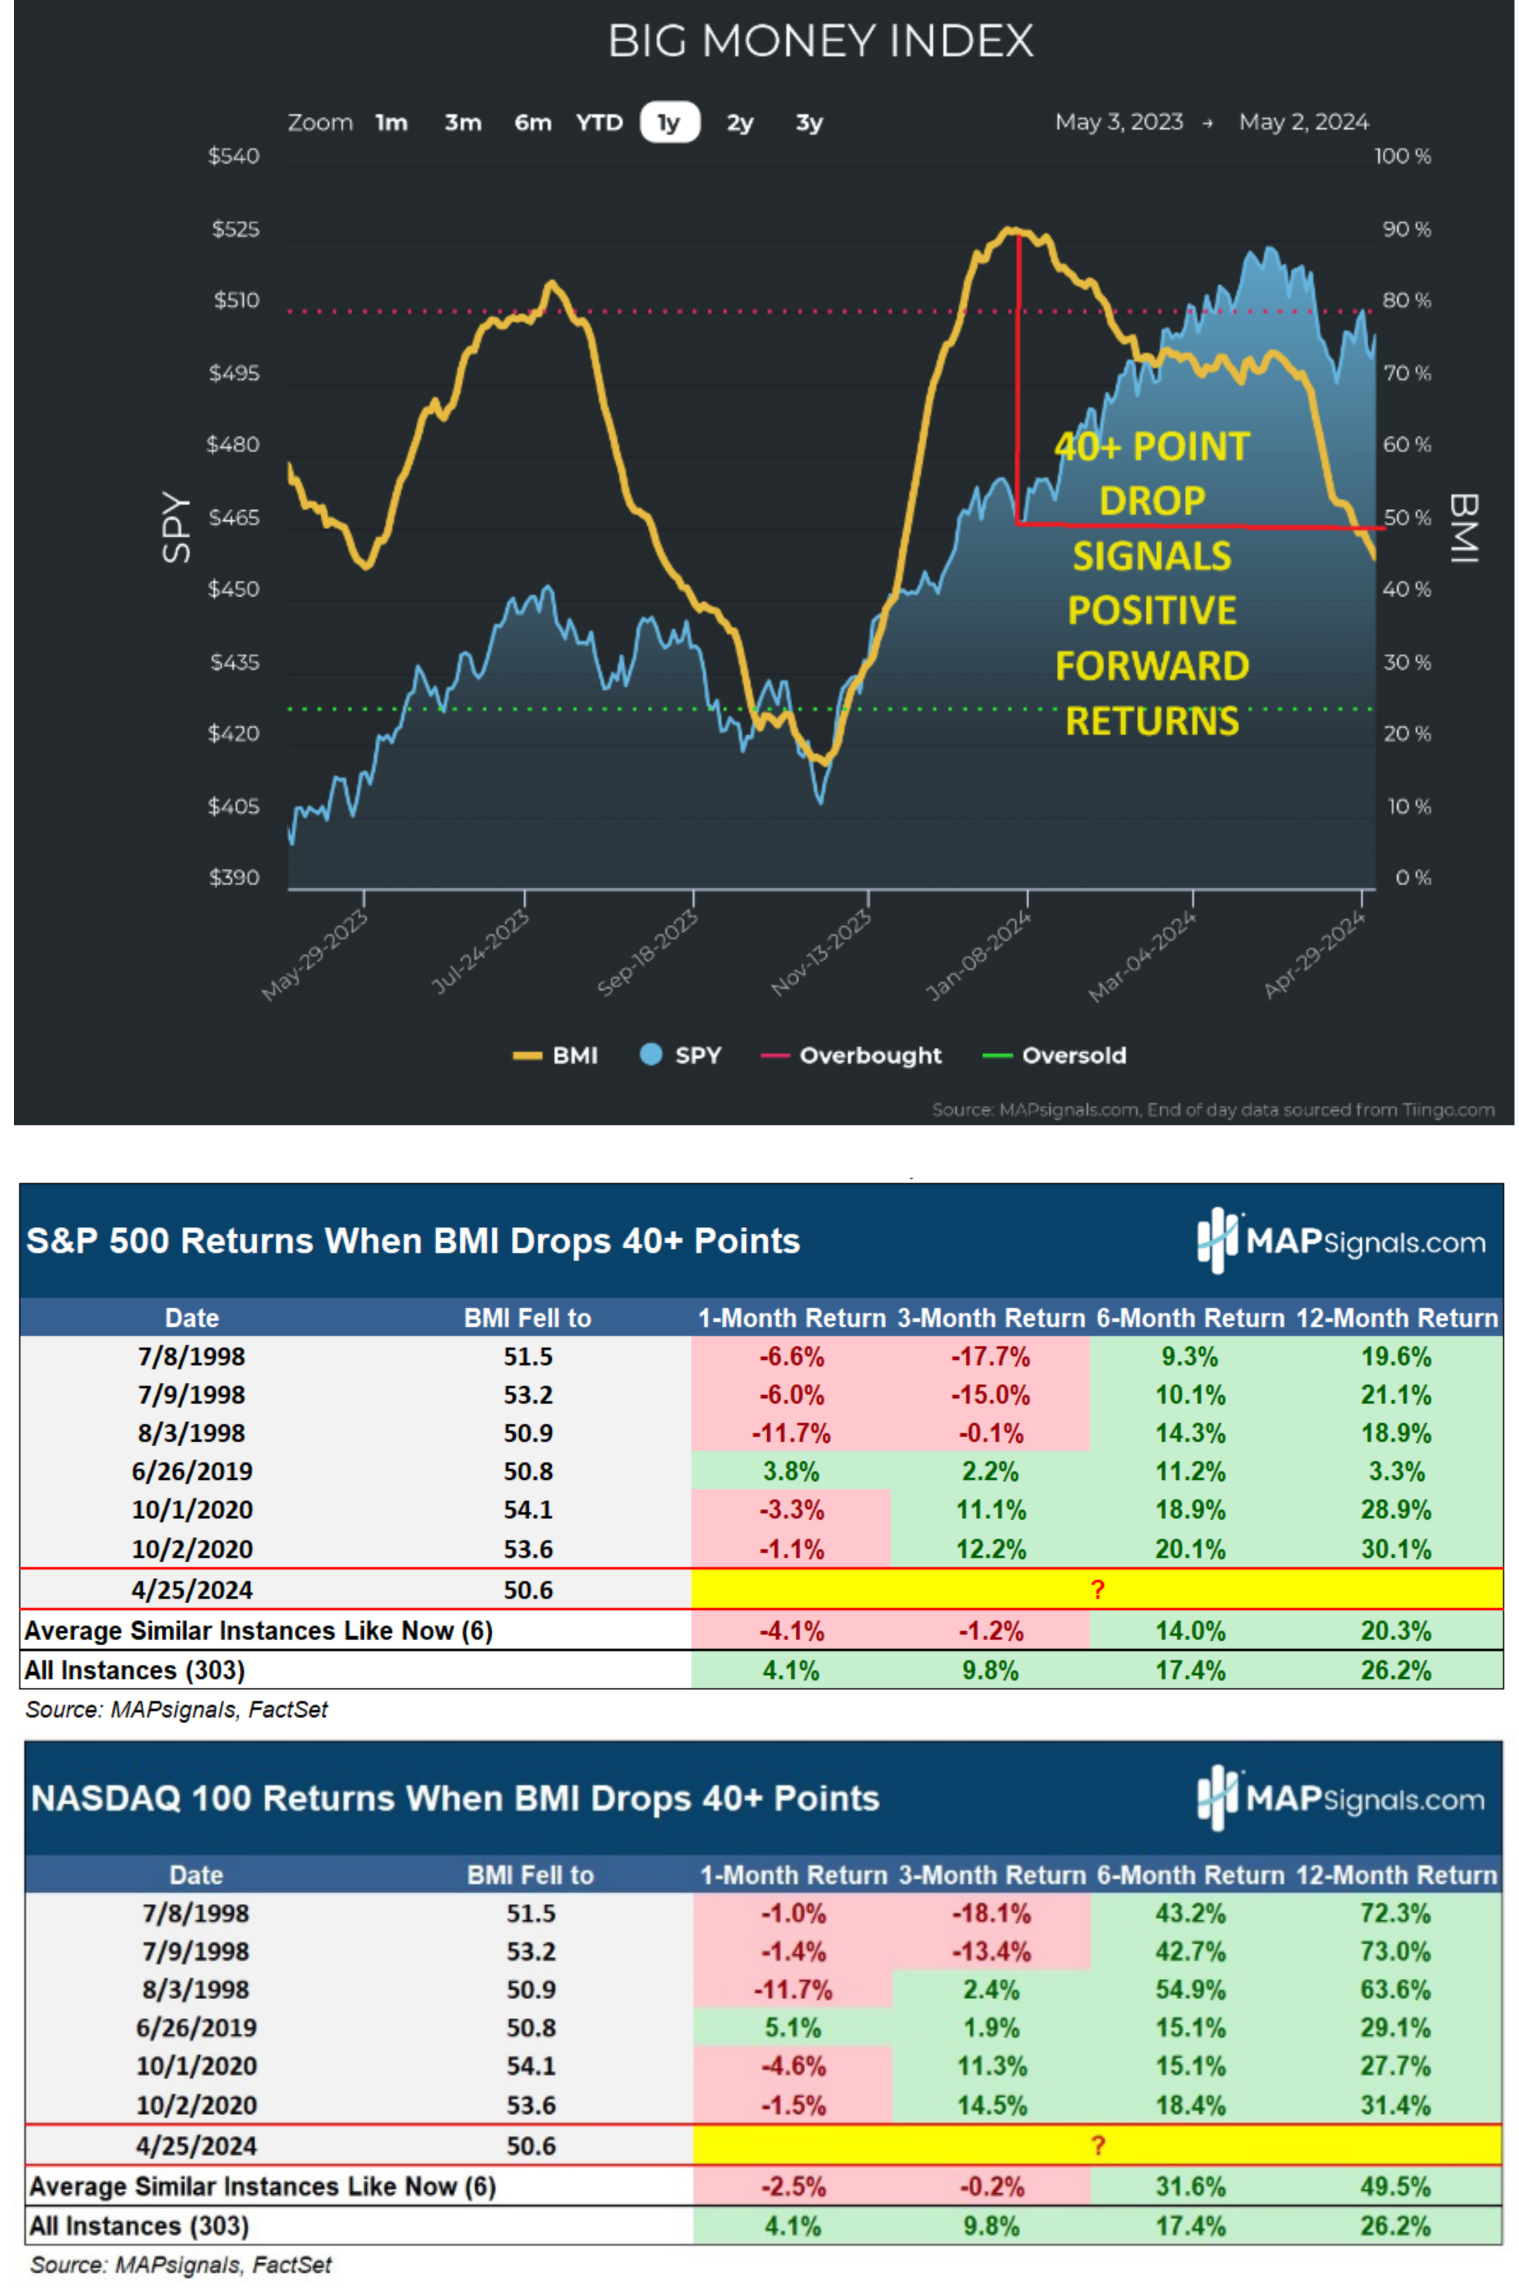
It’s clear the market doesn’t like the idea of higher rates for longer. In April, those fears resurfaced and were a perfect excuse to trigger profit taking. The SPY fell -5% from its March 27th peak to its April 19th trough. This pressured the Big Money Index (BMI) to fall over 40 points from its overbought peak in December. Looking at the code, historically, when this happens it means huge positive forward returns:
Graphs are for illustrative and discussion purposes only. Please read important disclosures at the end of this commentary.
Reading the 6-12 month returns, I wonder if anyone is starting to hum some happy tunes now.
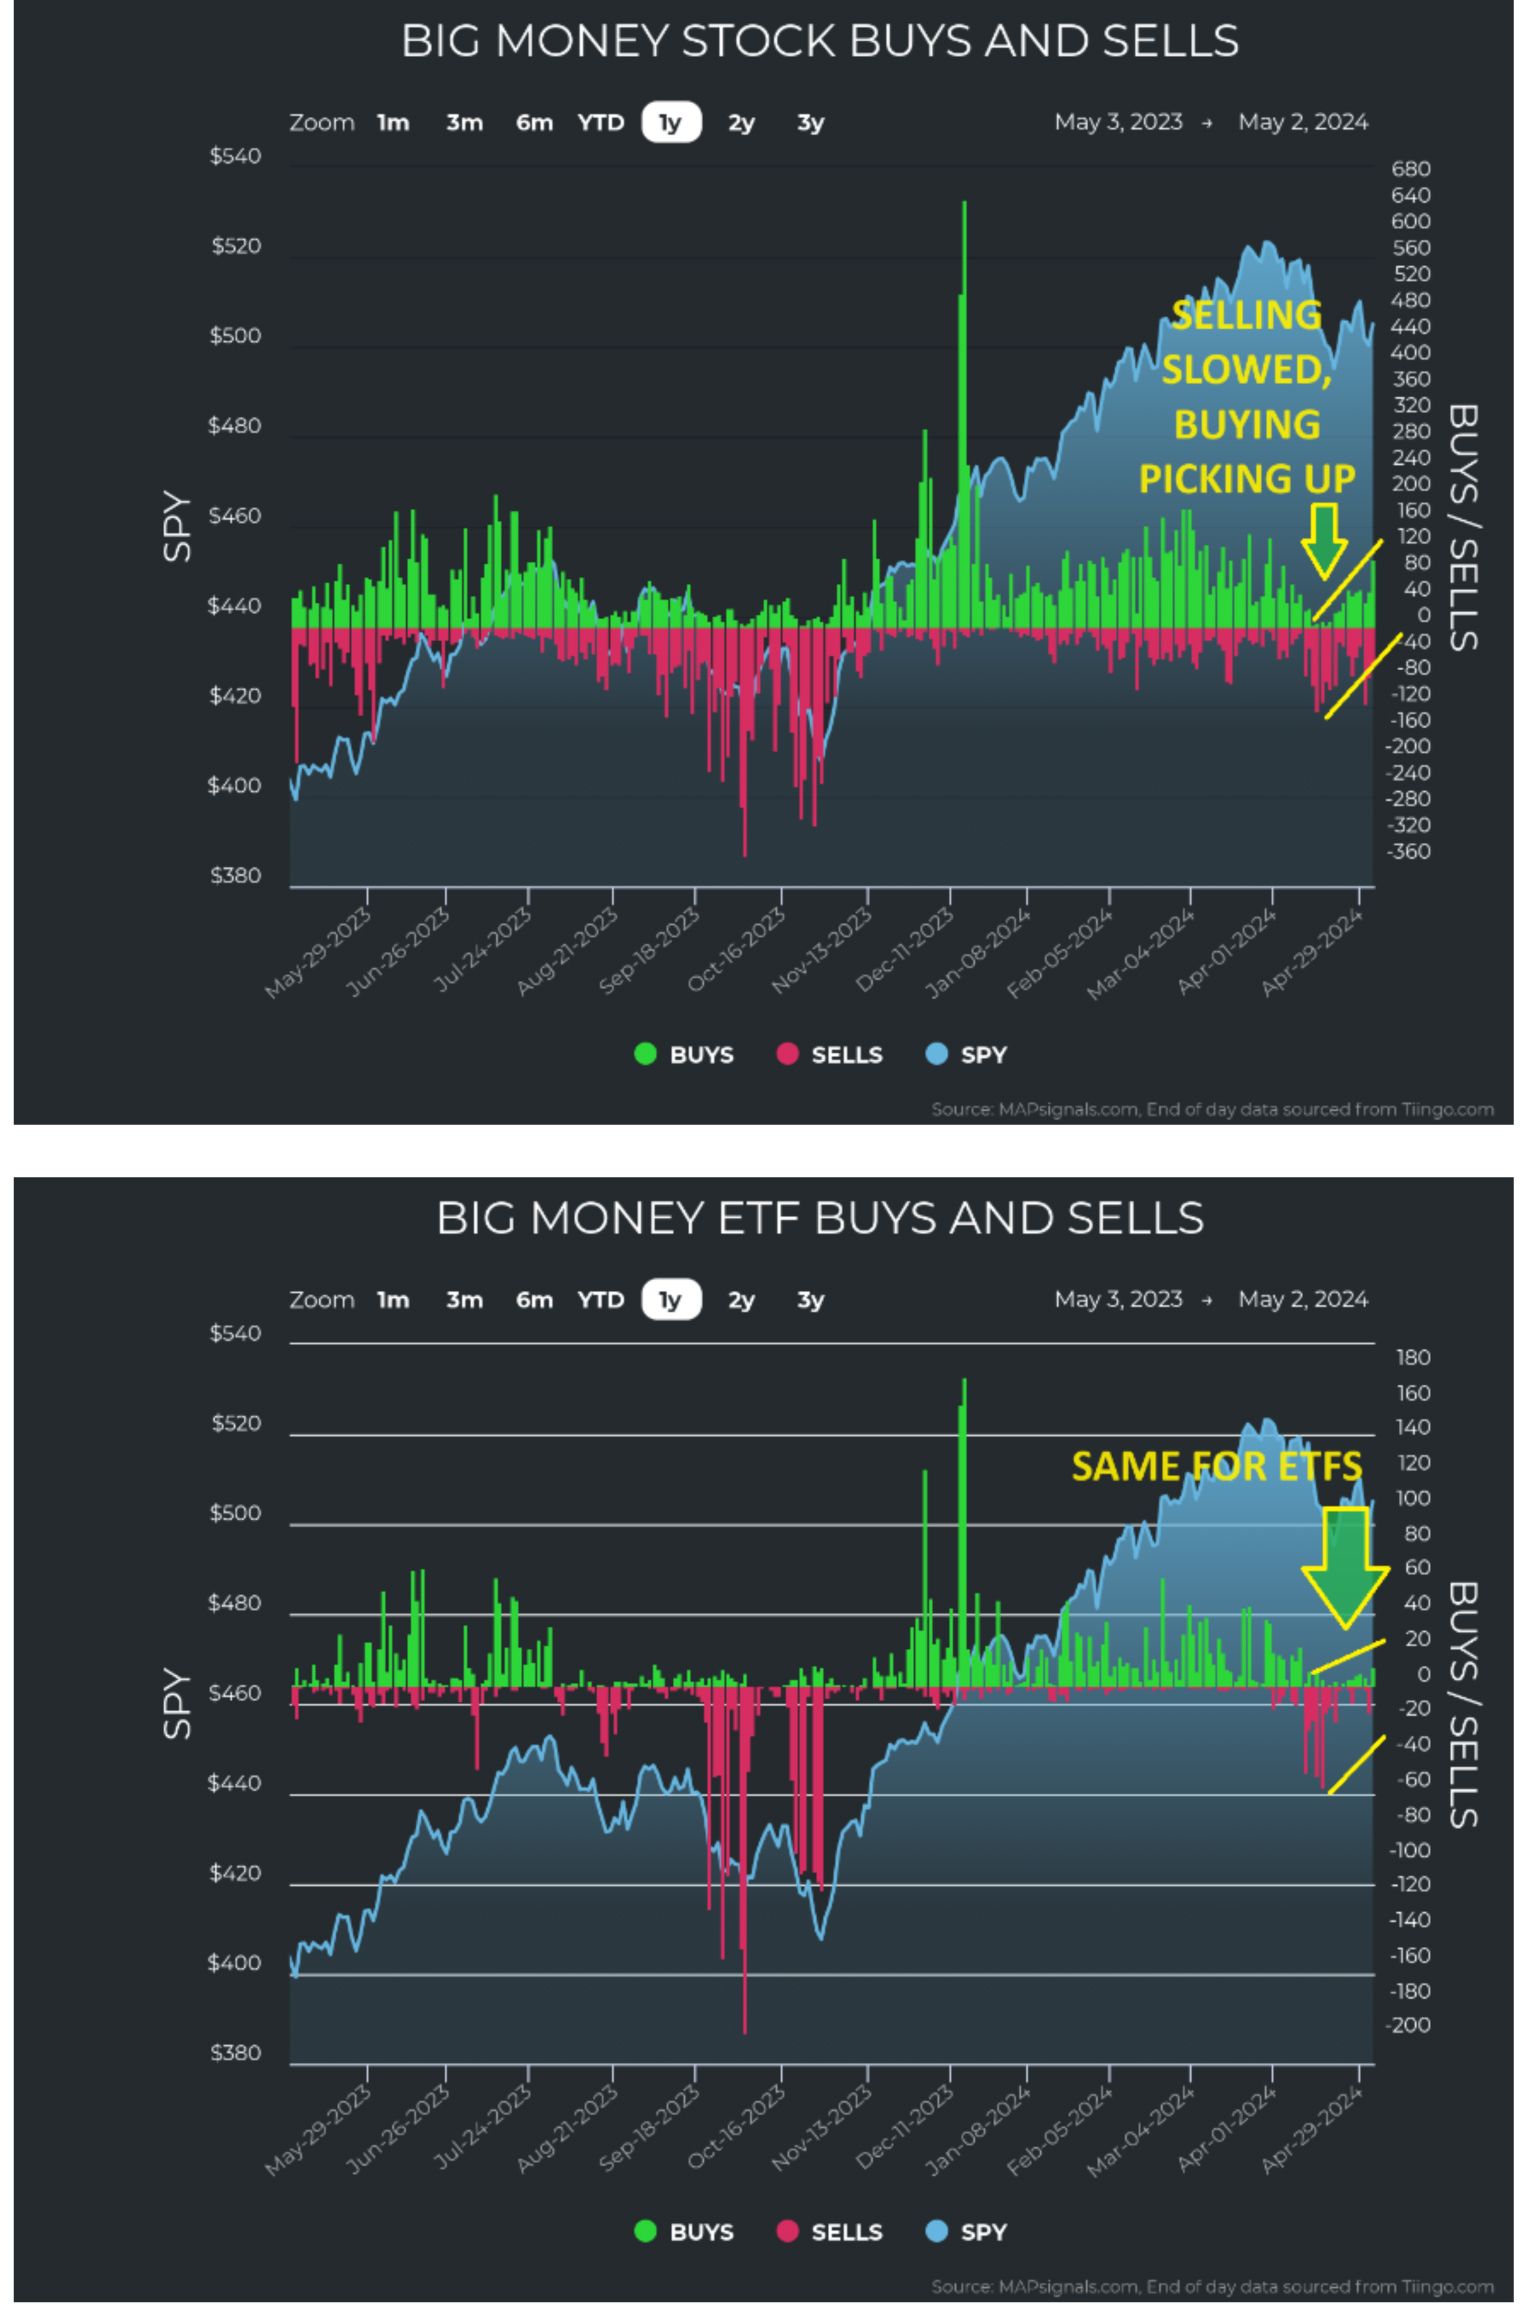
It may be premature, but early indications say that selling slowed and buying is starting up again:
Graphs are for illustrative and discussion purposes only. Please read important disclosures at the end of this commentary.
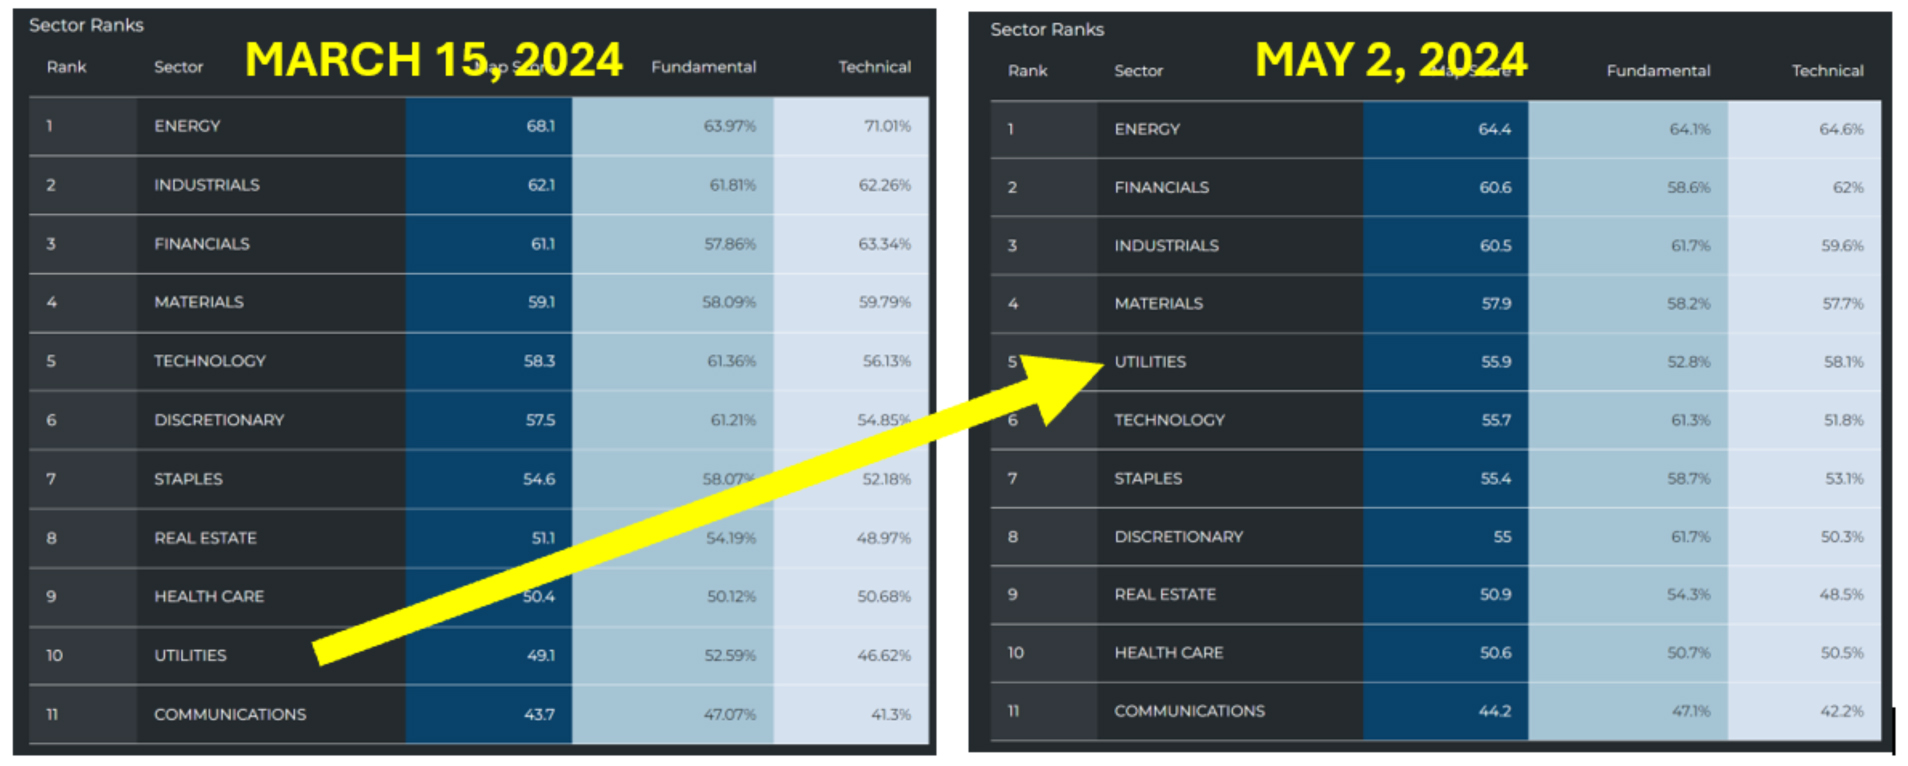
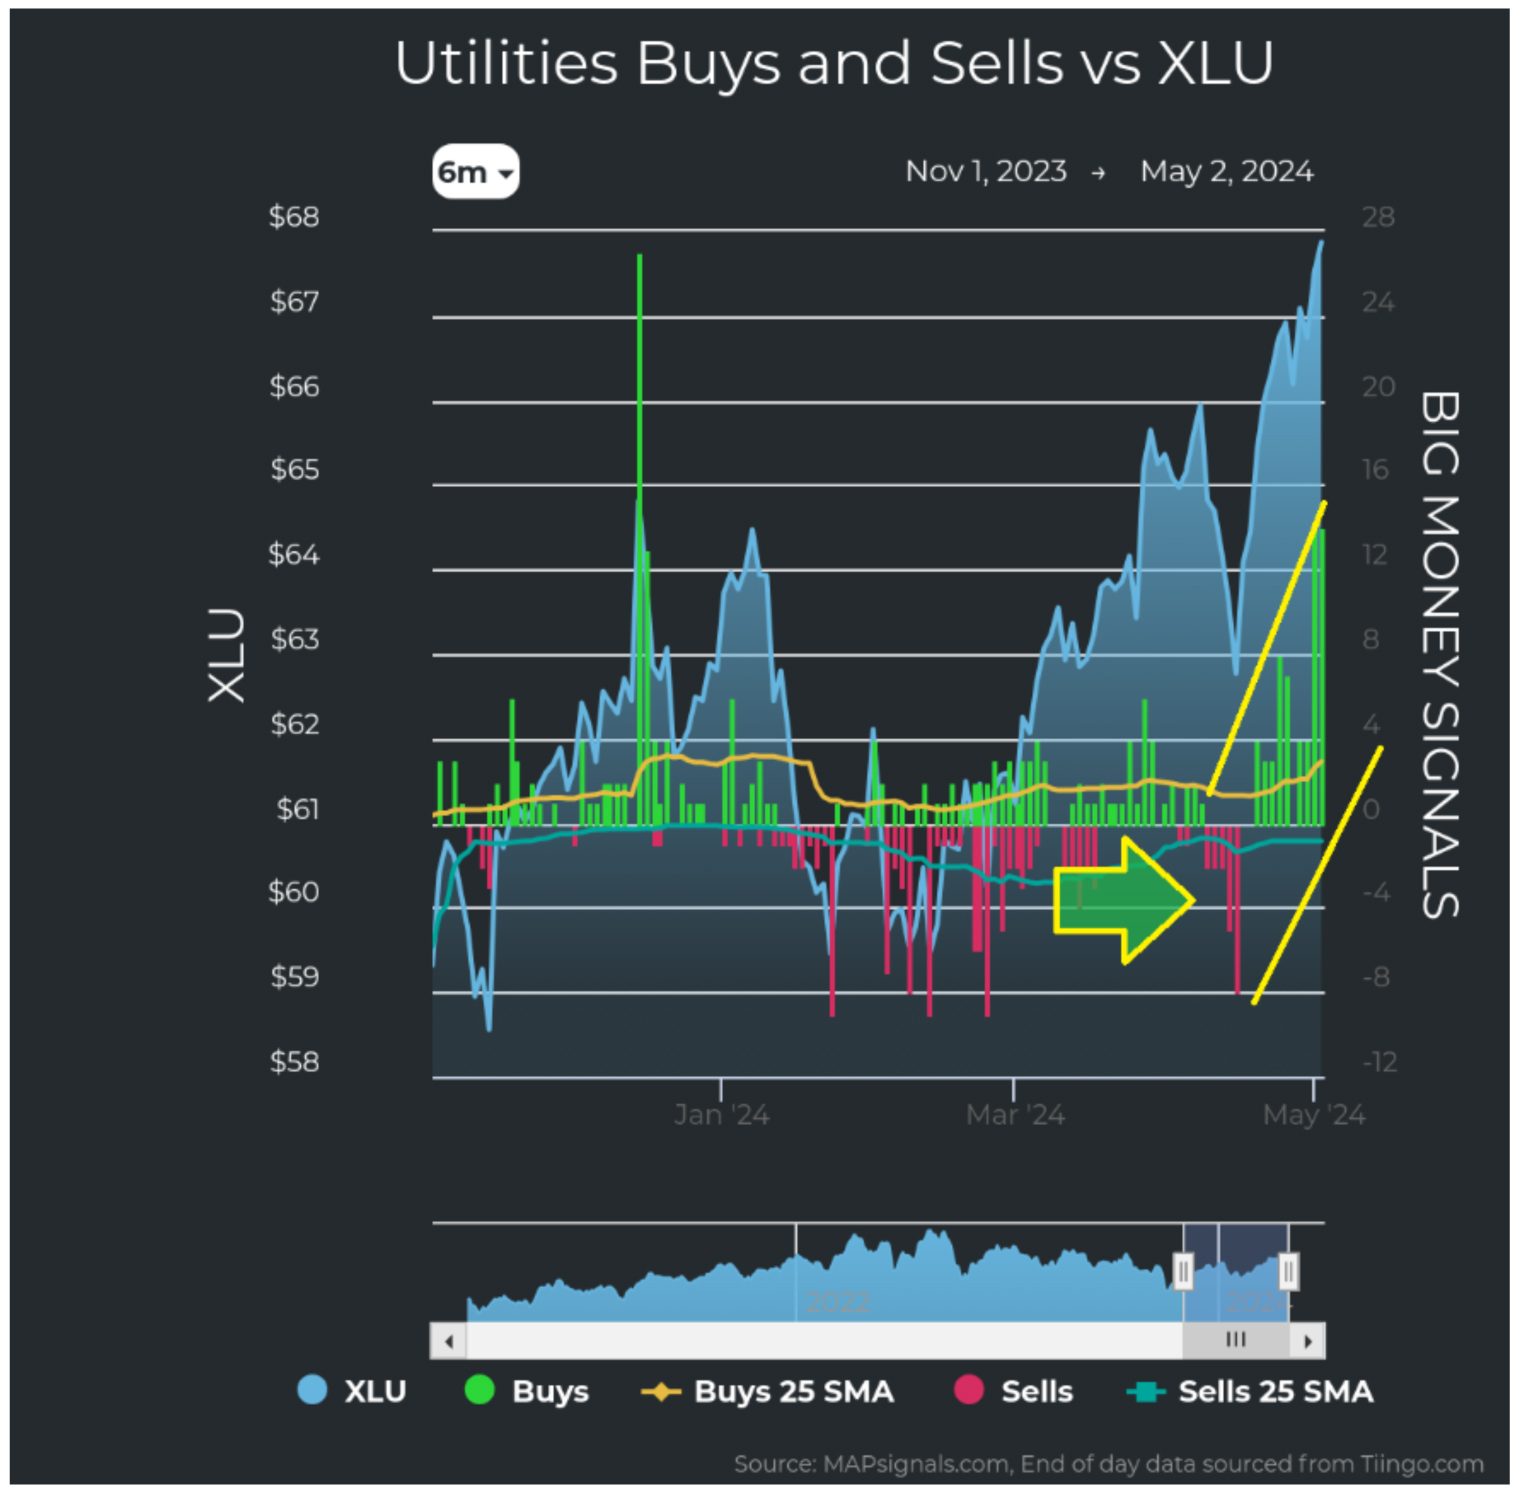
While this is encouraging, we are still seeing sector leadership going topsy-turvy. Energy, Financials, Industrials, and Materials lead, while Technology and Discretionary – both growth-leading sectors – remain stuck in the middle or lower. What’s really interesting is that Utilities, like a phoenix from the ashes, rose from the basement to the upper half – in 5th place (out of 11) in just a few weeks:
Graphs are for illustrative and discussion purposes only. Please read important disclosures at the end of this commentary.
One possible narrative for why the sudden interest in Utilities is the sudden spike in demand for power as we need energy to power the AI revolution. Large companies like META are reporting big spends in AI.
Graphs are for illustrative and discussion purposes only. Please read important disclosures at the end of this commentary.
Whatever it is, Big Money suddenly likes stocks again. They even like Utilities, even though the current fundamentals for the group are in the middle. Looking at Utilities averaged together, this is what we see:
- Map Score 46.3
- Technical Score 55.8
- Fundamental Score 39.6
This points to a technical rally as opposed to a quality run. Rotations out of risk into “safety” might be what is driving the sector higher – or perhaps we will see future earnings and sales surging in the sector?
Time will tell. For now, the music of the market is more upbeat.
“Where words fail, music speaks.” – Hans Christian Andersen
Navellier & Associates, some accounts own Meta Platforms Inc Class A (META). Jason Bodner does not personally own Meta Platforms Inc Class A (META) personally.
All content above represents the opinion of Jason Bodner of Navellier & Associates, Inc.
Also In This Issue
A Look Ahead by Louis Navellier
Powell’s Performance Boosts the Market Amid Downbeat Economic Reports
Income Mail by Bryan Perry
The Market Holds Up as Economic Cross Currents Collide
Growth Mail by Gary Alexander
Why the U.S. is an Economic and Investment Oasis – And Likely Will Remain So
Global Mail by Ivan Martchev
It Looks Like That Was “It” for the April Correction
Sector Spotlight by Jason Bodner
Powell’s Upbeat Music Lifted the Market
View Full Archive
Read Past Issues Here

Jason Bodner
MARKETMAIL EDITOR FOR SECTOR SPOTLIGHT
Jason Bodner writes Sector Spotlight in the weekly Marketmail publication and has authored several white papers for the company. He is also Co-Founder of Macro Analytics for Professionals which produces proprietary equity accumulation/distribution research for its clients. Previously, Mr. Bodner served as Director of European Equity Derivatives for Cantor Fitzgerald Europe in London, then moved to the role of Head of Equity Derivatives North America for the same company in New York. He also served as S.V.P. Equity Derivatives for Jefferies, LLC. He received a B.S. in business administration in 1996, with honors, from Skidmore College as a member of the Periclean Honors Society. All content of “Sector Spotlight” represents the opinion of Jason Bodner
Important Disclosures:
Jason Bodner is a co-founder and co-owner of Mapsignals. Mr. Bodner is an independent contractor who is occasionally hired by Navellier & Associates to write an article and or provide opinions for possible use in articles that appear in Navellier & Associates weekly Market Mail. Mr. Bodner is not employed or affiliated with Louis Navellier, Navellier & Associates, Inc., or any other Navellier owned entity. The opinions and statements made here are those of Mr. Bodner and not necessarily those of any other persons or entities. This is not an endorsement, or solicitation or testimonial or investment advice regarding the BMI Index or any statements or recommendations or analysis in the article or the BMI Index or Mapsignals or its products or strategies.
Although information in these reports has been obtained from and is based upon sources that Navellier believes to be reliable, Navellier does not guarantee its accuracy and it may be incomplete or condensed. All opinions and estimates constitute Navellier’s judgment as of the date the report was created and are subject to change without notice. These reports are for informational purposes only and are not a solicitation for the purchase or sale of a security. Any decision to purchase securities mentioned in these reports must take into account existing public information on such securities or any registered prospectus.To the extent permitted by law, neither Navellier & Associates, Inc., nor any of its affiliates, agents, or service providers assumes any liability or responsibility nor owes any duty of care for any consequences of any person acting or refraining to act in reliance on the information contained in this communication or for any decision based on it.
Past performance is no indication of future results. Investment in securities involves significant risk and has the potential for partial or complete loss of funds invested. It should not be assumed that any securities recommendations made by Navellier. in the future will be profitable or equal the performance of securities made in this report. Dividend payments are not guaranteed. The amount of a dividend payment, if any, can vary over time and issuers may reduce dividends paid on securities in the event of a recession or adverse event affecting a specific industry or issuer.
None of the stock information, data, and company information presented herein constitutes a recommendation by Navellier or a solicitation to buy or sell any securities. Any specific securities identified and described do not represent all of the securities purchased, sold, or recommended for advisory clients. The holdings identified do not represent all of the securities purchased, sold, or recommended for advisory clients and the reader should not assume that investments in the securities identified and discussed were or will be profitable.
Information presented is general information that does not take into account your individual circumstances, financial situation, or needs, nor does it present a personalized recommendation to you. Individual stocks presented may not be suitable for every investor. Investment in securities involves significant risk and has the potential for partial or complete loss of funds invested. Investment in fixed income securities has the potential for the investment return and principal value of an investment to fluctuate so that an investor’s holdings, when redeemed, may be worth less than their original cost.
One cannot invest directly in an index. Index is unmanaged and index performance does not reflect deduction of fees, expenses, or taxes. Presentation of Index data does not reflect a belief by Navellier that any stock index constitutes an investment alternative to any Navellier equity strategy or is necessarily comparable to such strategies. Among the most important differences between the Indices and Navellier strategies are that the Navellier equity strategies may (1) incur material management fees, (2) concentrate its investments in relatively few stocks, industries, or sectors, (3) have significantly greater trading activity and related costs, and (4) be significantly more or less volatile than the Indices.
ETF Risk: We may invest in exchange traded funds (“ETFs”) and some of our investment strategies are generally fully invested in ETFs. Like traditional mutual funds, ETFs charge asset-based fees, but they generally do not charge initial sales charges or redemption fees and investors typically pay only customary brokerage fees to buy and sell ETF shares. The fees and costs charged by ETFs held in client accounts will not be deducted from the compensation the client pays Navellier. ETF prices can fluctuate up or down, and a client account could lose money investing in an ETF if the prices of the securities owned by the ETF go down. ETFs are subject to additional risks:
- ETF shares may trade above or below their net asset value;
- An active trading market for an ETF’s shares may not develop or be maintained;
- The value of an ETF may be more volatile than the underlying portfolio of securities the ETF is designed to track;
- The cost of owning shares of the ETF may exceed those a client would incur by directly investing in the underlying securities; and
- Trading of an ETF’s shares may be halted if the listing exchange’s officials deem it appropriate, the shares are delisted from the exchange, or the activation of market-wide “circuit breakers” (which are tied to large decreases in stock prices) halts stock trading generally.
Grader Disclosures: Investment in equity strategies involves substantial risk and has the potential for partial or complete loss of funds invested. The sample portfolio and any accompanying charts are for informational purposes only and are not to be construed as a solicitation to buy or sell any financial instrument and should not be relied upon as the sole factor in an investment making decision. As a matter of normal and important disclosures to you, as a potential investor, please consider the following: The performance presented is not based on any actual securities trading, portfolio, or accounts, and the reported performance of the A, B, C, D, and F portfolios (collectively the “model portfolios”) should be considered mere “paper” or pro forma performance results based on Navellier’s research.
Investors evaluating any of Navellier & Associates, Inc.’s, (or its affiliates’) Investment Products must not use any information presented here, including the performance figures of the model portfolios, in their evaluation of any Navellier Investment Products. Navellier Investment Products include the firm’s mutual funds and managed accounts. The model portfolios, charts, and other information presented do not represent actual funded trades and are not actual funded portfolios. There are material differences between Navellier Investment Products’ portfolios and the model portfolios, research, and performance figures presented here. The model portfolios and the research results (1) may contain stocks or ETFs that are illiquid and difficult to trade; (2) may contain stock or ETF holdings materially different from actual funded Navellier Investment Product portfolios; (3) include the reinvestment of all dividends and other earnings, estimated trading costs, commissions, or management fees; and, (4) may not reflect prices obtained in an actual funded Navellier Investment Product portfolio. For these and other reasons, the reported performances of model portfolios do not reflect the performance results of Navellier’s actually funded and traded Investment Products. In most cases, Navellier’s Investment Products have materially lower performance results than the performances of the model portfolios presented.
This report contains statements that are, or may be considered to be, forward-looking statements. All statements that are not historical facts, including statements about our beliefs or expectations, are “forward-looking statements” within the meaning of The U.S. Private Securities Litigation Reform Act of 1995. These statements may be identified by such forward-looking terminology as “expect,” “estimate,” “plan,” “intend,” “believe,” “anticipate,” “may,” “will,” “should,” “could,” “continue,” “project,” or similar statements or variations of such terms. Our forward-looking statements are based on a series of expectations, assumptions, and projections, are not guarantees of future results or performance, and involve substantial risks and uncertainty as described in Form ADV Part 2A of our filing with the Securities and Exchange Commission (SEC), which is available at www.adviserinfo.sec.gov or by requesting a copy by emailing info@navellier.com. All of our forward-looking statements are as of the date of this report only. We can give no assurance that such expectations or forward-looking statements will prove to be correct. Actual results may differ materially. You are urged to carefully consider all such factors.
FEDERAL TAX ADVICE DISCLAIMER: As required by U.S. Treasury Regulations, you are informed that, to the extent this presentation includes any federal tax advice, the presentation is not written by Navellier to be used, and cannot be used, for the purpose of avoiding federal tax penalties. Navellier does not advise on any income tax requirements or issues. Use of any information presented by Navellier is for general information only and does not represent tax advice either express or implied. You are encouraged to seek professional tax advice for income tax questions and assistance.
IMPORTANT NEWSLETTER DISCLOSURE:The hypothetical performance results for investment newsletters that are authored or edited by Louis Navellier, including Louis Navellier’s Growth Investor, Louis Navellier’s Breakthrough Stocks, Louis Navellier’s Accelerated Profits, and Louis Navellier’s Platinum Club, are not based on any actual securities trading, portfolio, or accounts, and the newsletters’ reported hypothetical performances should be considered mere “paper” or proforma hypothetical performance results and are not actual performance of real world trades. Navellier & Associates, Inc. does not have any relation to or affiliation with the owner of these newsletters. There are material differences between Navellier Investment Products’ portfolios and the InvestorPlace Media, LLC newsletter portfolios authored by Louis Navellier. The InvestorPlace Media, LLC newsletters contain hypothetical performance that do not include transaction costs, advisory fees, or other fees a client might incur if actual investments and trades were being made by an investor. As a result, newsletter performance should not be used to evaluate Navellier Investment services which are separate and different from the newsletters. The owner of the newsletters is InvestorPlace Media, LLC and any questions concerning the newsletters, including any newsletter advertising or hypothetical Newsletter performance claims, (which are calculated solely by Investor Place Media and not Navellier) should be referred to InvestorPlace Media, LLC at (800) 718-8289.
Please note that Navellier & Associates and the Navellier Private Client Group are managed completely independent of the newsletters owned and published by InvestorPlace Media, LLC and written and edited by Louis Navellier, and investment performance of the newsletters should in no way be considered indicative of potential future investment performance for any Navellier & Associates separately managed account portfolio. Potential investors should consult with their financial advisor before investing in any Navellier Investment Product.
Navellier claims compliance with Global Investment Performance Standards (GIPS). To receive a complete list and descriptions of Navellier’s composites and/or a presentation that adheres to the GIPS standards, please contact Navellier or click here. It should not be assumed that any securities recommendations made by Navellier & Associates, Inc. in the future will be profitable or equal the performance of securities made in this report.
FactSet Disclosure: Navellier does not independently calculate the statistical information included in the attached report. The calculation and the information are provided by FactSet, a company not related to Navellier. Although information contained in the report has been obtained from FactSet and is based on sources Navellier believes to be reliable, Navellier does not guarantee its accuracy, and it may be incomplete or condensed. The report and the related FactSet sourced information are provided on an “as is” basis. The user assumes the entire risk of any use made of this information. Investors should consider the report as only a single factor in making their investment decision. The report is for informational purposes only and is not intended as an offer or solicitation for the purchase or sale of a security. FactSet sourced information is the exclusive property of FactSet. Without prior written permission of FactSet, this information may not be reproduced, disseminated or used to create any financial products. All indices are unmanaged and performance of the indices include reinvestment of dividends and interest income, unless otherwise noted, are not illustrative of any particular investment and an investment cannot be made in any index. Past performance is no guarantee of future results.