by Gary Alexander
April 30, 2024
At the beginning of this month (in “Is the U.S. Economy Really Growing at 3.4%?” Growth Mail, April 2, 2024), I made the case that the economy was slowing down. In coming to that conclusion, I consulted the little-followed, seldom-reported (quarterly) Gross Output (GO) statistic, a relatively new (since 2014) expansion of Gross Domestic Product. “GO” is rising noticeably slower than the GDP, and it serves as an advance indicator of a slowdown. Whenever “GO” under-performs GDP, history shows that a slowdown (and sometimes an outright recession) is in the cards, so I predicted a slowdown in 2024 GDP growth.
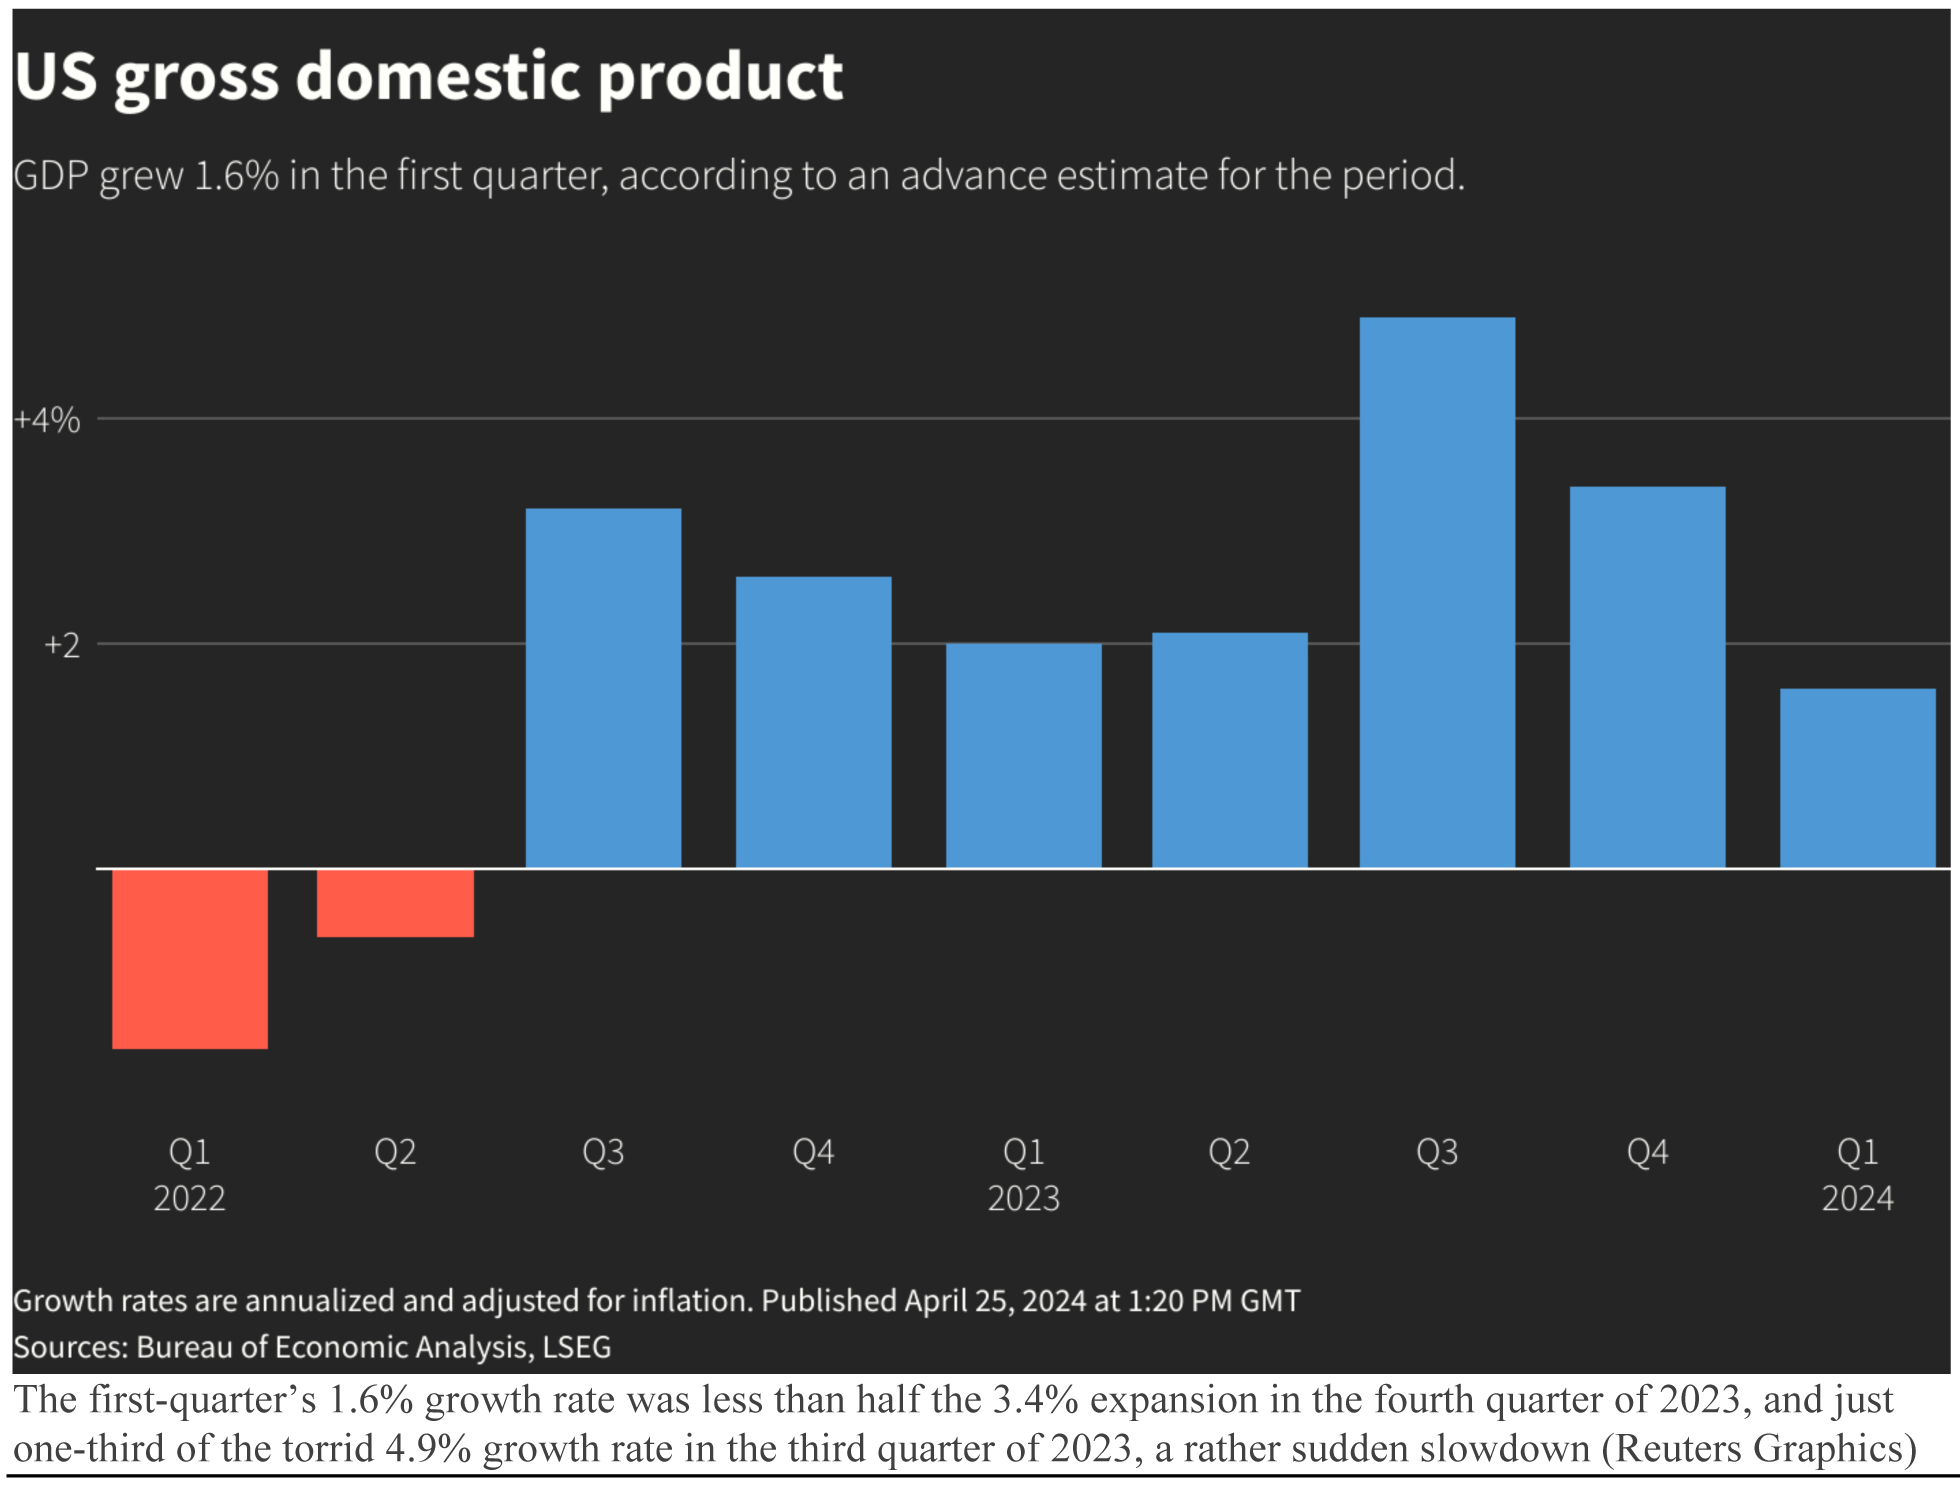
Last week, the first estimate of first-quarter GDP was scheduled to be released on Thursday, April 25. Going into that event, the economic community was giddy. On April 23rd, the Atlanta Federal Reserve’s GDPNow model predicted 2.9% annualized growth, but they had second thoughts on April 24, reducing their forecast to 2.7% that day. On Larry Kudlow’s daily economics program on Fox Business that same day, the former chairman of President Trump’s Council of Economic Advisors, Kevin Hassett, said that he expected a huge 3.5% first-quarter GDP growth rate – and he is obviously no cheerleader for Biden.
Come 8:30 am on the 25th, the GDP estimate came in at less than half of Hassett’s high-end forecast, just 1.6%, the slowest pace in nearly two years. The chief culprits were slower consumer spending and a widening trade deficit, crippled further by an unexpected acceleration in inflation in the last three months.
Graphs are for illustrative and discussion purposes only. Please read important disclosures at the end of this commentary.
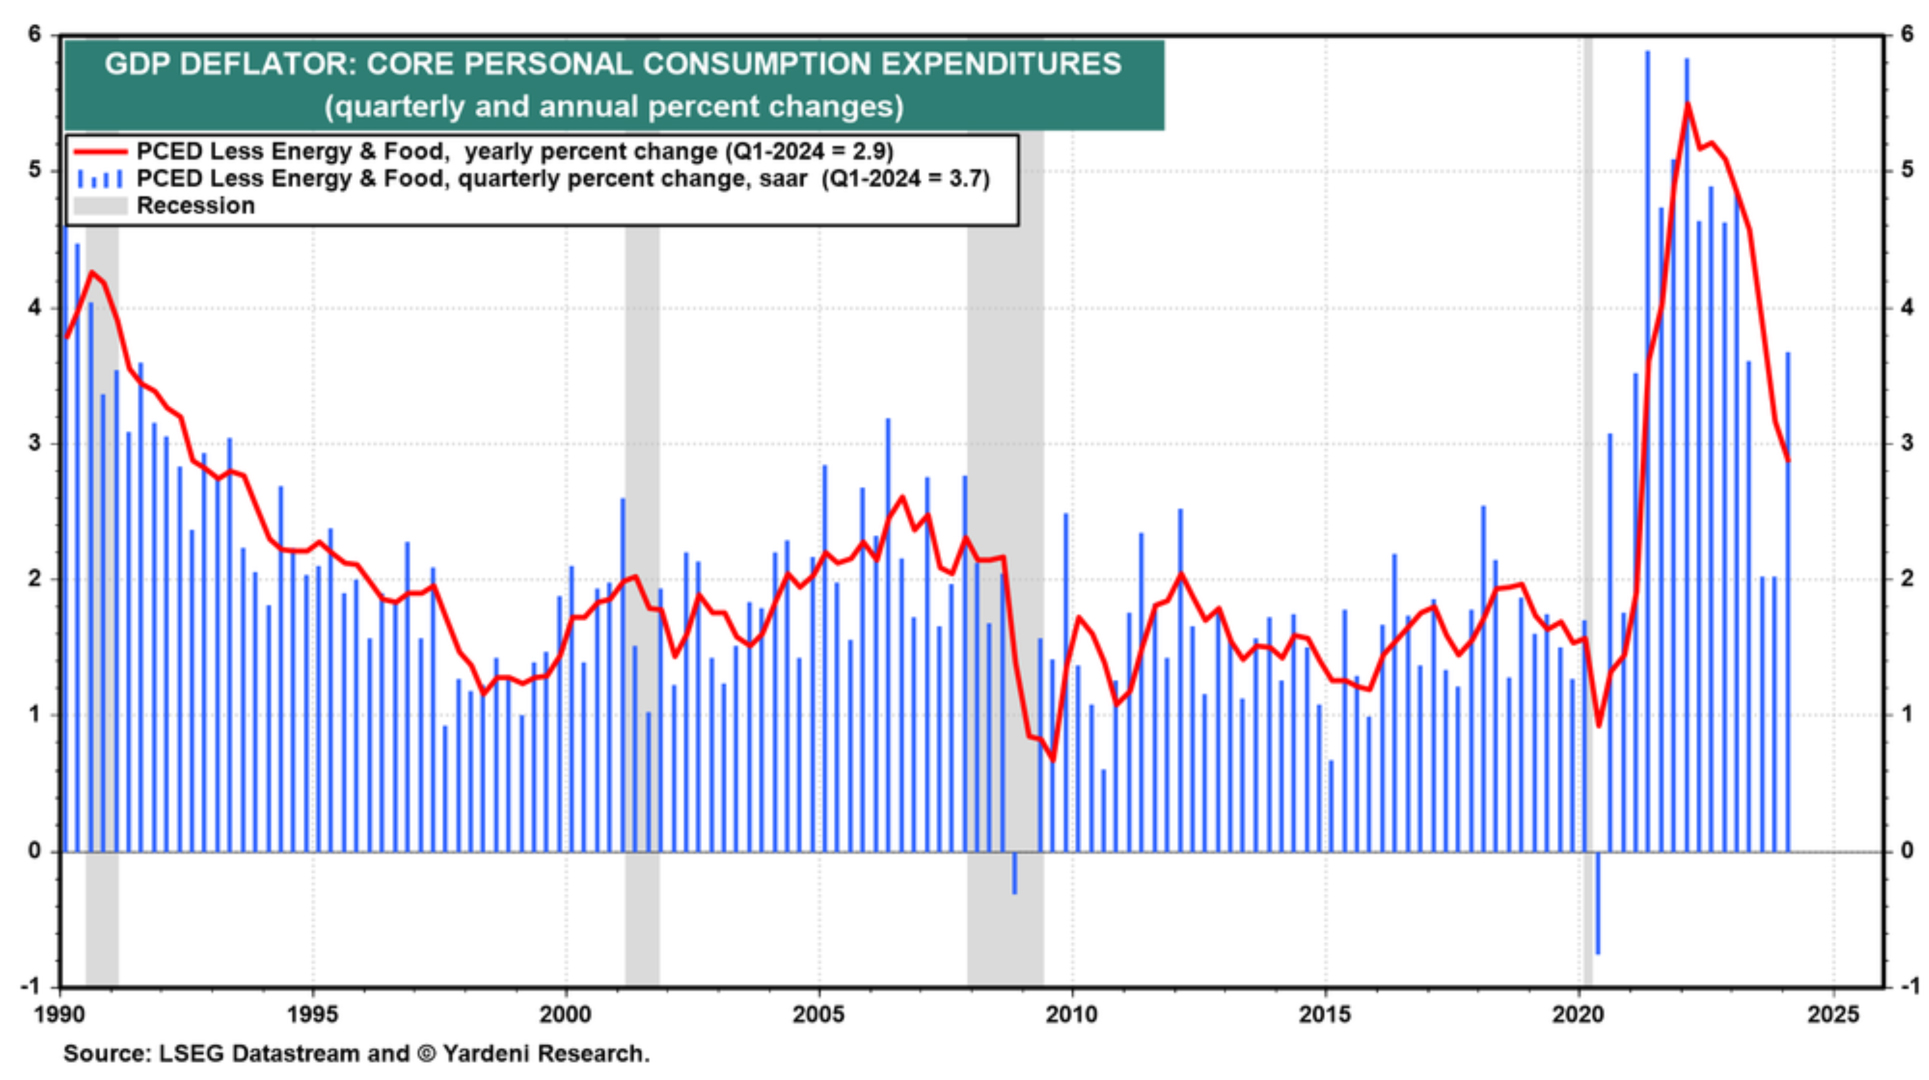
We also learned that the Fed’s favorite inflation indicator grew at a 3.1% annual rate after rising at a 1.9% pace in the October-December quarter. Excluding food and energy, the core rate came in even higher, at a 3.7% rate, the fastest rise in nearly a year and almost double the 2.0% pace in the second half of 2023.
That sudden quarterly 3.7% rise is reflected in the last blue bar on the far right of this Yardeni chart:
Graphs are for illustrative and discussion purposes only. Please read important disclosures at the end of this commentary.
In retrospect, this chart shows that the Federal Reserve reached its desired 2% target in the core PCE index for two consecutive quarters in late 2023, but that target rate was then violated by a sudden rise in early 2024. The cause wasn’t so much energy prices as a range of increases, from insurance to housing.
Deficit Increases (and High Interest Rates) Will Soon Ring Alarm Bells
In addition to price inflation, deficits and debt are soaring in unsustainable fashion, while high interest rates (for a longer time) are keeping debt service and mortgage rates high. While most deficits are out of the control of Congress (as entitlements), President Biden is going around the nation trying to buy votes by promising more entitlements in the form of college debt forgiveness or a solar energy for all program.
This may seem great to those with huge forgiven debts or free solar panels, but one of these days, a bond auction will be so poorly received that bond yields will soar to levels that may threaten the Treasury credit rating, cripple the economy, send the deficit soaring, fuel a recession and send families deeper into debt.
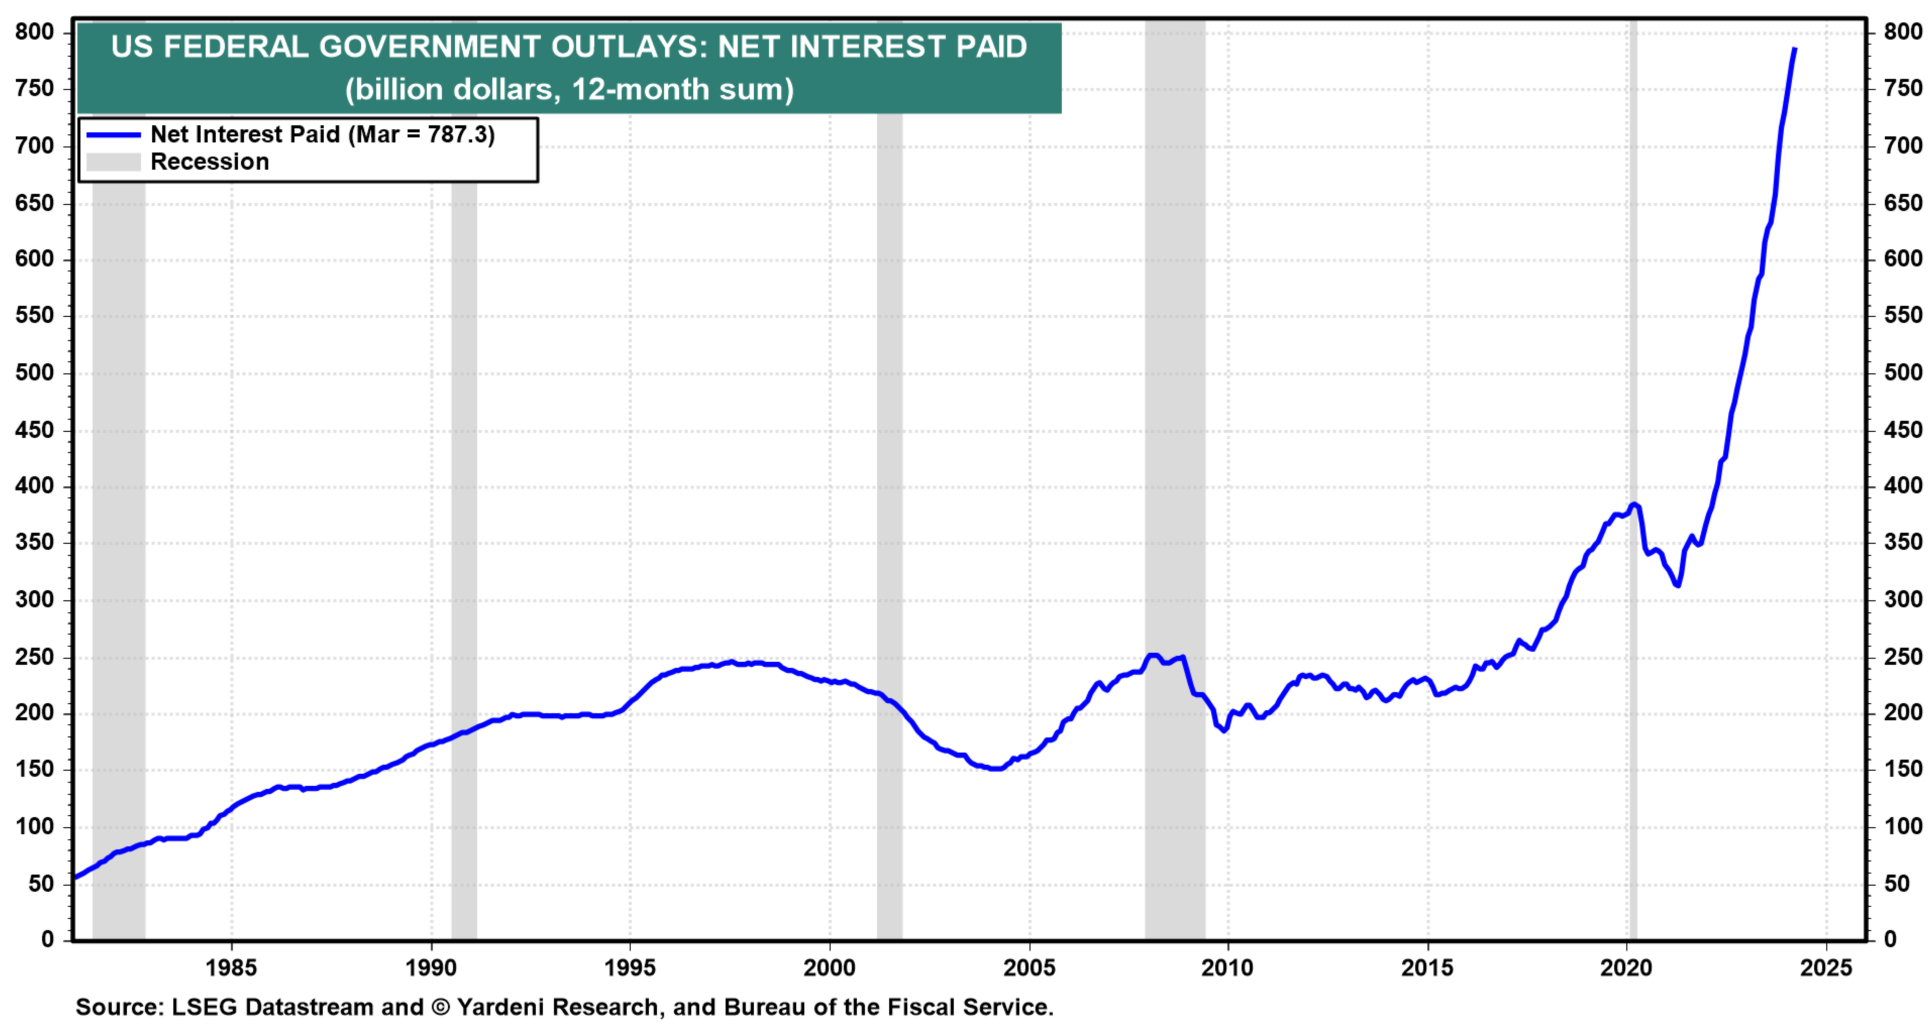
There is no free lunch. During the 12 months ending March 31, the federal budget deficit grew by $1.66 trillion, but the Treasury actual had to borrow a lot more – $2.6 trillion – in this period, partly to replenish its depleted cash balance at the Fed. The biggest concern now is the cost of new debt service at higher interest rates, pushing debt costs from just over $300 billion to a record $787 billion in the last 12 months.
Graphs are for illustrative and discussion purposes only. Please read important disclosures at the end of this commentary.
All this deficit spending is happening during relatively good times. What happens during a recession?
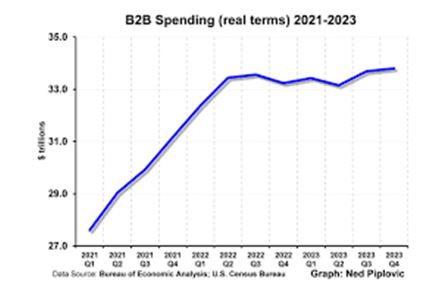
As Mark Skousen wrote in The Wall Street Journal (“Slow GO May Mean a Recession Soon: GDP numbers look great, but a leading indicator signals trouble ahead,” April 4, 2024), we may be near a recession: “My research shows that gross output—especially business-to-business spending—is a leading barometer of economic health. The metric can make a big difference in assessing the economy’s performance, as was the case in 2022. Real GDP declined in the first two quarters of that year, suggesting a recession. But real GO continued to increase, and there was no recession” (see the chart, below):
Graphs are for illustrative and discussion purposes only. Please read important disclosures at the end of this commentary.
“The situation has since flipped,” Skousen wrote. “Real gross output was a full percentage point below GDP in the fourth quarter of 2023, at 2.4%. While consumer and government spending remained strong, business spending fell 0.3% and has been in steady decline since the third quarter of 2022. In last year’s final two quarters, real GO grew more slowly than GDP. That spells danger. Whenever gross output grows at a slower pace than GDP, it suggests a slowdown and perhaps a recession.”
Business spending represents almost two-thirds of the economy. Business-to-business spending is also more volatile: It tends to decline faster during a recession and recover faster during an expansion.
That’s why we have used Gross Output as an essential leading indicator for growth. When it declines, or grows noticeably slower than GDP, a slowdown is likely, and that is why “GO” looks “SLOW” for 2024.
All content above represents the opinion of Gary Alexander of Navellier & Associates, Inc.
Also In This Issue
A Look Ahead by Louis Navellier
The Perils of Owning the Wrong Tech Stocks
Income Mail by Bryan Perry
Three Percent Inflation Looks Like “The New Normal”
Growth Mail by Gary Alexander
Slower GDP Growth Surprised Analysts (But Not Us)
Global Mail by Ivan Martchev
The Case of the Disappearing Rate Cuts
Sector Spotlight by Jason Bodner
Selling is a Bull Market’s “Pressure Release Valve”
View Full Archive
Read Past Issues Here
About The Author

Gary Alexander
SENIOR EDITOR
Gary Alexander has been Senior Writer at Navellier since 2009. He edits Navellier’s weekly Marketmail and writes a weekly Growth Mail column, in which he uses market history to support the case for growth stocks. For the previous 20 years before joining Navellier, he was Senior Executive Editor at InvestorPlace Media (formerly Phillips Publishing), where he worked with several leading investment analysts, including Louis Navellier (since 1997), helping launch Louis Navellier’s Blue Chip Growth and Global Growth newsletters.
Prior to that, Gary edited Wealth Magazine and Gold Newsletter and wrote various investment research reports for Jefferson Financial in New Orleans in the 1980s. He began his financial newsletter career with KCI Communications in 1980, where he served as consulting editor for Personal Finance newsletter while serving as general manager of KCI’s Alexandria House book division. Before that, he covered the economics beat for news magazines. All content of “Growth Mail” represents the opinion of Gary Alexander
Important Disclosures:
Although information in these reports has been obtained from and is based upon sources that Navellier believes to be reliable, Navellier does not guarantee its accuracy and it may be incomplete or condensed. All opinions and estimates constitute Navellier’s judgment as of the date the report was created and are subject to change without notice. These reports are for informational purposes only and are not a solicitation for the purchase or sale of a security. Any decision to purchase securities mentioned in these reports must take into account existing public information on such securities or any registered prospectus.To the extent permitted by law, neither Navellier & Associates, Inc., nor any of its affiliates, agents, or service providers assumes any liability or responsibility nor owes any duty of care for any consequences of any person acting or refraining to act in reliance on the information contained in this communication or for any decision based on it.
Past performance is no indication of future results. Investment in securities involves significant risk and has the potential for partial or complete loss of funds invested. It should not be assumed that any securities recommendations made by Navellier. in the future will be profitable or equal the performance of securities made in this report. Dividend payments are not guaranteed. The amount of a dividend payment, if any, can vary over time and issuers may reduce dividends paid on securities in the event of a recession or adverse event affecting a specific industry or issuer.
None of the stock information, data, and company information presented herein constitutes a recommendation by Navellier or a solicitation to buy or sell any securities. Any specific securities identified and described do not represent all of the securities purchased, sold, or recommended for advisory clients. The holdings identified do not represent all of the securities purchased, sold, or recommended for advisory clients and the reader should not assume that investments in the securities identified and discussed were or will be profitable.
Information presented is general information that does not take into account your individual circumstances, financial situation, or needs, nor does it present a personalized recommendation to you. Individual stocks presented may not be suitable for every investor. Investment in securities involves significant risk and has the potential for partial or complete loss of funds invested. Investment in fixed income securities has the potential for the investment return and principal value of an investment to fluctuate so that an investor’s holdings, when redeemed, may be worth less than their original cost.
One cannot invest directly in an index. Index is unmanaged and index performance does not reflect deduction of fees, expenses, or taxes. Presentation of Index data does not reflect a belief by Navellier that any stock index constitutes an investment alternative to any Navellier equity strategy or is necessarily comparable to such strategies. Among the most important differences between the Indices and Navellier strategies are that the Navellier equity strategies may (1) incur material management fees, (2) concentrate its investments in relatively few stocks, industries, or sectors, (3) have significantly greater trading activity and related costs, and (4) be significantly more or less volatile than the Indices.
ETF Risk: We may invest in exchange traded funds (“ETFs”) and some of our investment strategies are generally fully invested in ETFs. Like traditional mutual funds, ETFs charge asset-based fees, but they generally do not charge initial sales charges or redemption fees and investors typically pay only customary brokerage fees to buy and sell ETF shares. The fees and costs charged by ETFs held in client accounts will not be deducted from the compensation the client pays Navellier. ETF prices can fluctuate up or down, and a client account could lose money investing in an ETF if the prices of the securities owned by the ETF go down. ETFs are subject to additional risks:
- ETF shares may trade above or below their net asset value;
- An active trading market for an ETF’s shares may not develop or be maintained;
- The value of an ETF may be more volatile than the underlying portfolio of securities the ETF is designed to track;
- The cost of owning shares of the ETF may exceed those a client would incur by directly investing in the underlying securities; and
- Trading of an ETF’s shares may be halted if the listing exchange’s officials deem it appropriate, the shares are delisted from the exchange, or the activation of market-wide “circuit breakers” (which are tied to large decreases in stock prices) halts stock trading generally.
Grader Disclosures: Investment in equity strategies involves substantial risk and has the potential for partial or complete loss of funds invested. The sample portfolio and any accompanying charts are for informational purposes only and are not to be construed as a solicitation to buy or sell any financial instrument and should not be relied upon as the sole factor in an investment making decision. As a matter of normal and important disclosures to you, as a potential investor, please consider the following: The performance presented is not based on any actual securities trading, portfolio, or accounts, and the reported performance of the A, B, C, D, and F portfolios (collectively the “model portfolios”) should be considered mere “paper” or pro forma performance results based on Navellier’s research.
Investors evaluating any of Navellier & Associates, Inc.’s, (or its affiliates’) Investment Products must not use any information presented here, including the performance figures of the model portfolios, in their evaluation of any Navellier Investment Products. Navellier Investment Products include the firm’s mutual funds and managed accounts. The model portfolios, charts, and other information presented do not represent actual funded trades and are not actual funded portfolios. There are material differences between Navellier Investment Products’ portfolios and the model portfolios, research, and performance figures presented here. The model portfolios and the research results (1) may contain stocks or ETFs that are illiquid and difficult to trade; (2) may contain stock or ETF holdings materially different from actual funded Navellier Investment Product portfolios; (3) include the reinvestment of all dividends and other earnings, estimated trading costs, commissions, or management fees; and, (4) may not reflect prices obtained in an actual funded Navellier Investment Product portfolio. For these and other reasons, the reported performances of model portfolios do not reflect the performance results of Navellier’s actually funded and traded Investment Products. In most cases, Navellier’s Investment Products have materially lower performance results than the performances of the model portfolios presented.
This report contains statements that are, or may be considered to be, forward-looking statements. All statements that are not historical facts, including statements about our beliefs or expectations, are “forward-looking statements” within the meaning of The U.S. Private Securities Litigation Reform Act of 1995. These statements may be identified by such forward-looking terminology as “expect,” “estimate,” “plan,” “intend,” “believe,” “anticipate,” “may,” “will,” “should,” “could,” “continue,” “project,” or similar statements or variations of such terms. Our forward-looking statements are based on a series of expectations, assumptions, and projections, are not guarantees of future results or performance, and involve substantial risks and uncertainty as described in Form ADV Part 2A of our filing with the Securities and Exchange Commission (SEC), which is available at www.adviserinfo.sec.gov or by requesting a copy by emailing info@navellier.com. All of our forward-looking statements are as of the date of this report only. We can give no assurance that such expectations or forward-looking statements will prove to be correct. Actual results may differ materially. You are urged to carefully consider all such factors.
FEDERAL TAX ADVICE DISCLAIMER: As required by U.S. Treasury Regulations, you are informed that, to the extent this presentation includes any federal tax advice, the presentation is not written by Navellier to be used, and cannot be used, for the purpose of avoiding federal tax penalties. Navellier does not advise on any income tax requirements or issues. Use of any information presented by Navellier is for general information only and does not represent tax advice either express or implied. You are encouraged to seek professional tax advice for income tax questions and assistance.
IMPORTANT NEWSLETTER DISCLOSURE:The hypothetical performance results for investment newsletters that are authored or edited by Louis Navellier, including Louis Navellier’s Growth Investor, Louis Navellier’s Breakthrough Stocks, Louis Navellier’s Accelerated Profits, and Louis Navellier’s Platinum Club, are not based on any actual securities trading, portfolio, or accounts, and the newsletters’ reported hypothetical performances should be considered mere “paper” or proforma hypothetical performance results and are not actual performance of real world trades. Navellier & Associates, Inc. does not have any relation to or affiliation with the owner of these newsletters. There are material differences between Navellier Investment Products’ portfolios and the InvestorPlace Media, LLC newsletter portfolios authored by Louis Navellier. The InvestorPlace Media, LLC newsletters contain hypothetical performance that do not include transaction costs, advisory fees, or other fees a client might incur if actual investments and trades were being made by an investor. As a result, newsletter performance should not be used to evaluate Navellier Investment services which are separate and different from the newsletters. The owner of the newsletters is InvestorPlace Media, LLC and any questions concerning the newsletters, including any newsletter advertising or hypothetical Newsletter performance claims, (which are calculated solely by Investor Place Media and not Navellier) should be referred to InvestorPlace Media, LLC at (800) 718-8289.
Please note that Navellier & Associates and the Navellier Private Client Group are managed completely independent of the newsletters owned and published by InvestorPlace Media, LLC and written and edited by Louis Navellier, and investment performance of the newsletters should in no way be considered indicative of potential future investment performance for any Navellier & Associates separately managed account portfolio. Potential investors should consult with their financial advisor before investing in any Navellier Investment Product.
Navellier claims compliance with Global Investment Performance Standards (GIPS). To receive a complete list and descriptions of Navellier’s composites and/or a presentation that adheres to the GIPS standards, please contact Navellier or click here. It should not be assumed that any securities recommendations made by Navellier & Associates, Inc. in the future will be profitable or equal the performance of securities made in this report.
FactSet Disclosure: Navellier does not independently calculate the statistical information included in the attached report. The calculation and the information are provided by FactSet, a company not related to Navellier. Although information contained in the report has been obtained from FactSet and is based on sources Navellier believes to be reliable, Navellier does not guarantee its accuracy, and it may be incomplete or condensed. The report and the related FactSet sourced information are provided on an “as is” basis. The user assumes the entire risk of any use made of this information. Investors should consider the report as only a single factor in making their investment decision. The report is for informational purposes only and is not intended as an offer or solicitation for the purchase or sale of a security. FactSet sourced information is the exclusive property of FactSet. Without prior written permission of FactSet, this information may not be reproduced, disseminated or used to create any financial products. All indices are unmanaged and performance of the indices include reinvestment of dividends and interest income, unless otherwise noted, are not illustrative of any particular investment and an investment cannot be made in any index. Past performance is no guarantee of future results.