by Jason Bodner
April 2, 2024
It’s the stuff of Indiana Jones…The Lost Ark of the Covenant. The large, gold-covered wooden chest supposedly holding Moses’ Ten Commandments resided at the Temple of Solomon in Jerusalem for centuries. It disappeared after Jerusalem was attacked in 586 BC. Since then, its location is a mystery.
There are many rumors of its whereabouts. It is said to have been stolen by the Knights Templar and hidden in a French church. One rumor has it buried next to Alexander the Great. Yet another legend has it that The Ark has been safely guarded in the town of Aksum, Ethiopia, at the Church of St. Mary of Zion, since the 10th century BC, when the son of the Queen of Sheba supposedly stole it from King Solomon.
If that last story sounds a bit far-fetched consider that at least 800 people were reportedly killed by rebel soldiers in Ethiopia in the fall of 2020 as worshippers and soldiers risked their lives to protect what the Ethiopian Christians there say was the sacred Ark of the Covenant, stored in protective custody.
Here is my Google Map construction of the route the Ark would have taken south some 3,000 years ago, a walking journey of 3,500 kilometers (2,175 miles), calculated at 785 walking hours, or about 100 days of walking 8 hours and 22 miles a day, a lot of work, but not so hard for some strong young men.

Here’s the point: Is it unbelievable? Perhaps. But is it possible? Certainly. I am not here to debate the whereabouts of sacred artifacts… only to highlight the trappings of the human mind. Purists of different faiths will discount the possibility solely because they believe so deeply in their side of the argument.
In the end, we may never know the truth, but it launched the multi-billion-dollar Indiana Jones franchise.
Religion plays with our emotions. So does money. It taints our views like little else. Currently, the stock market seems to defy logic. But does it, really? Or does it defy emotion? Look at this chart of market performance since November of 2023. It looks almost unnaturally uniform in its steady march higher:
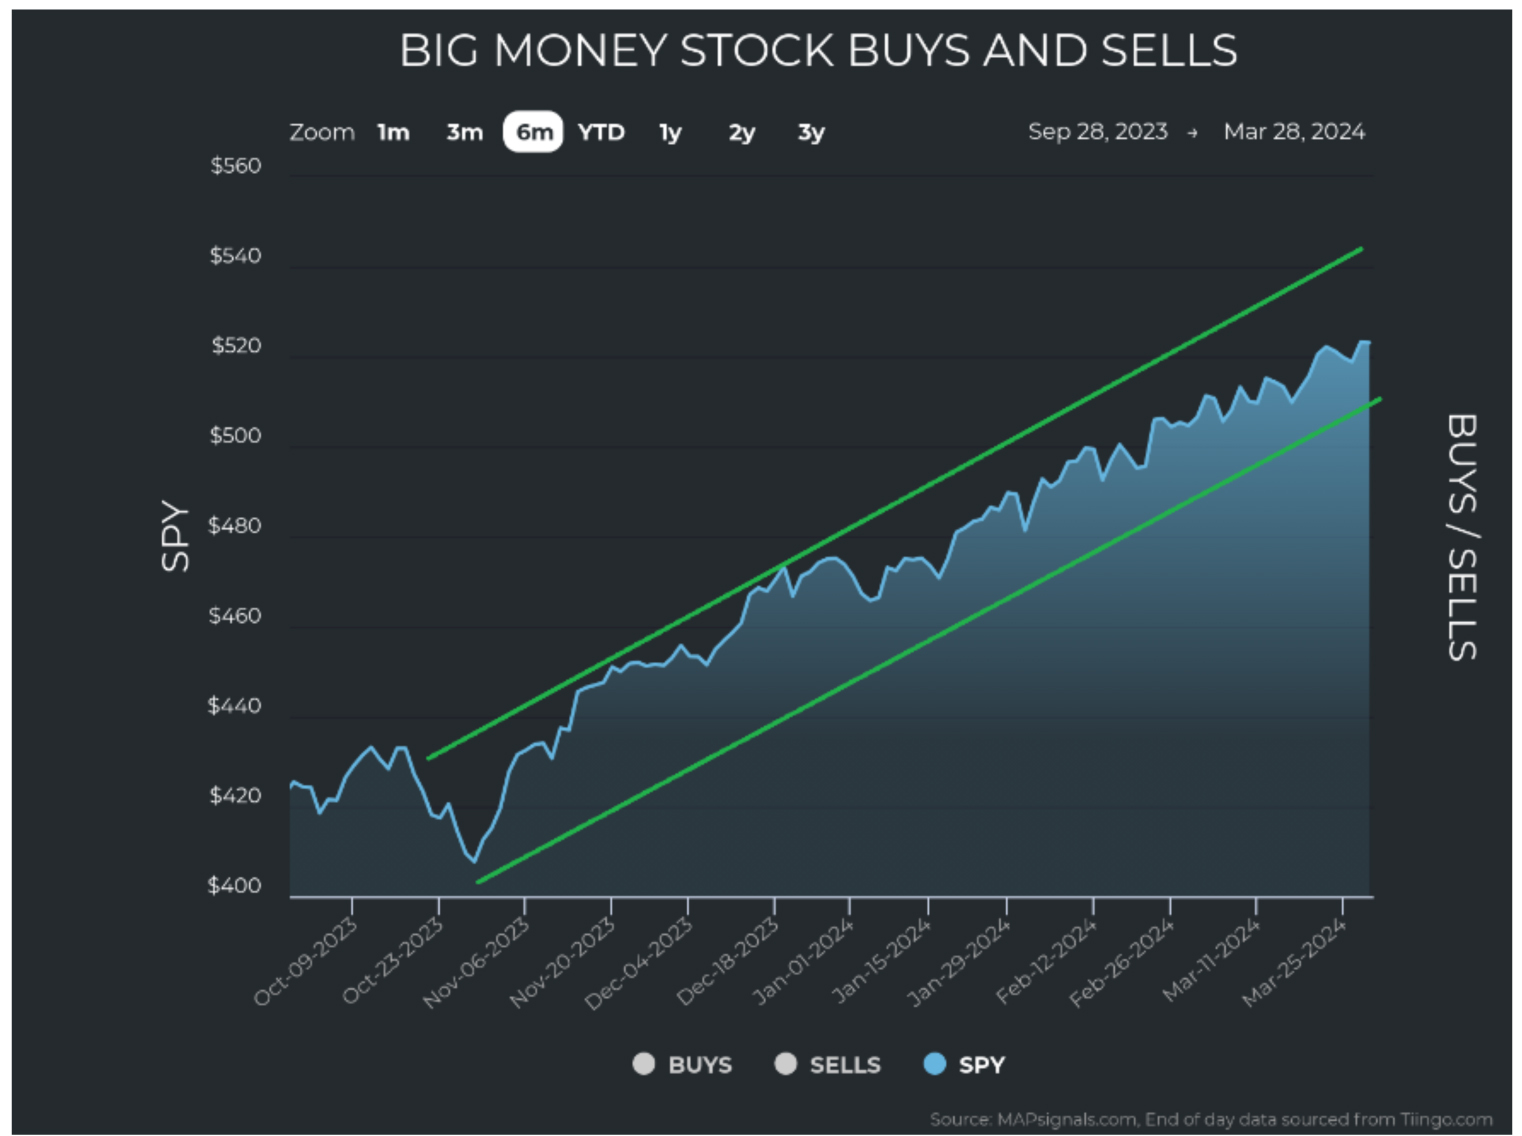
Graphs are for illustrative and discussion purposes only. Please read important disclosures at the end of this commentary.
It’s human nature to anticipate the next catastrophe. This can’t last forever, can it? Shouldn’t we prepare for a fall? Should we sell stocks and take profits? These are great questions, but I think a bigger question is: Is it possible that it keeps going? The answer is yes, maybe it’s not probable, but it is surely possible.
In fact, this seemingly parabolic move is nothing new, certainly not in the last eight years:
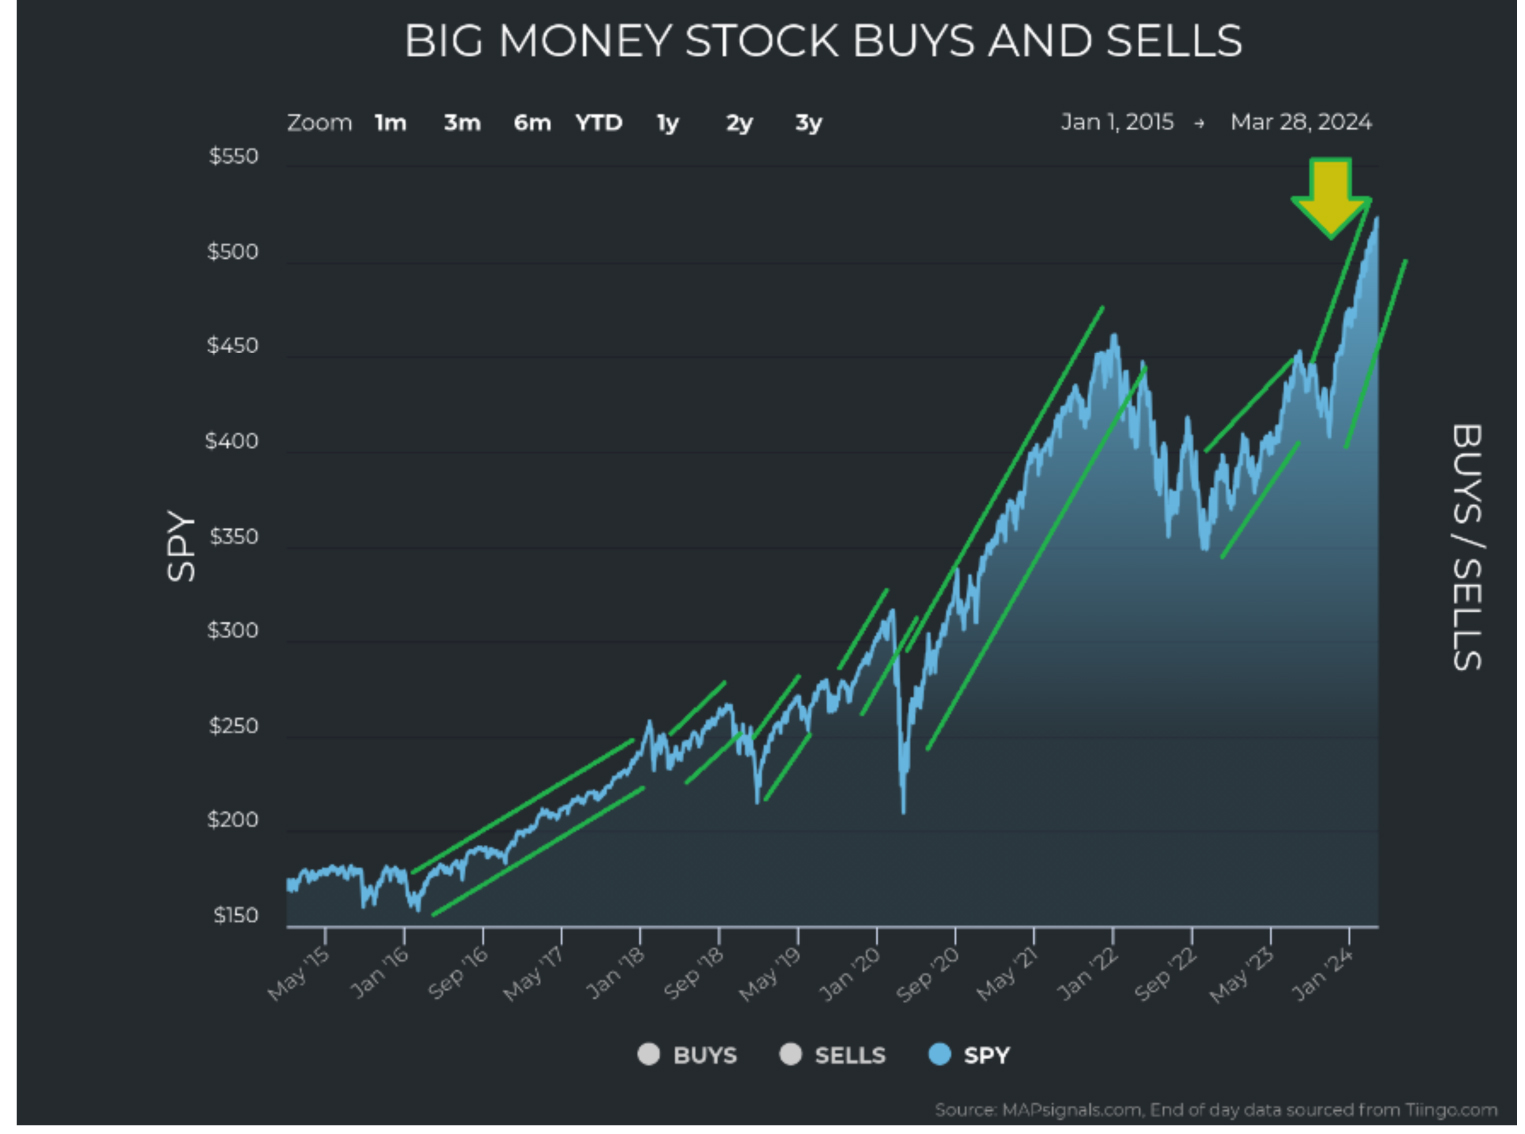
Graphs are for illustrative and discussion purposes only. Please read important disclosures at the end of this commentary.
All those tight upward channels tell me that we should be emotionally unattached to what should or shouldn’t be, and instead be objectively engaged in what is. And I can think of no other way to be objectively analyzing markets – or anything for that matter – than through studying the pure data.
The data is telling us to relax and enjoy the ride. For starters, the Big Money Index (BMI) has been moving tightly sideways since it fell from Overbought in December:
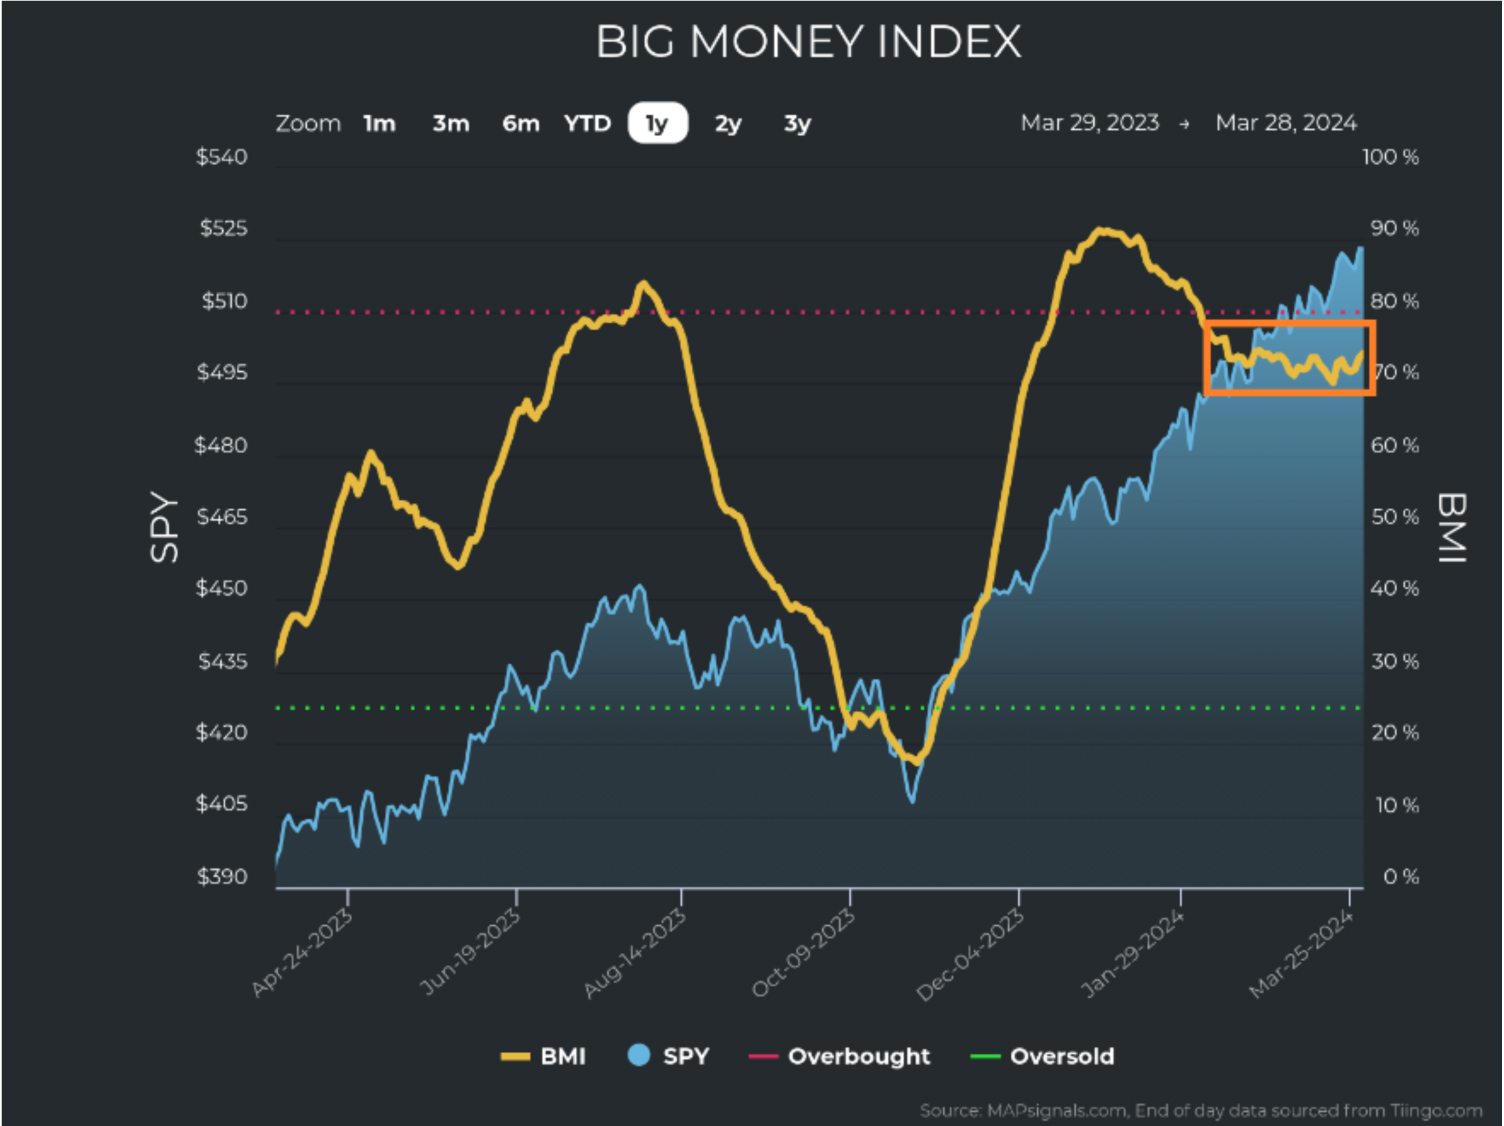
Graphs are for illustrative and discussion purposes only. Please read important disclosures at the end of this commentary.
I have frequently explained that the historical data told us to expect market weakness when this occurs. But we avoided the proverbial iceberg due to some stealth data beneath the surface. Unusual selling has not increased to the levels yet required to push the market down. The following chart shows the aggregate daily unusual buying (green) and selling (red) in U.S. stocks. It’s plain to see that no one is really selling:
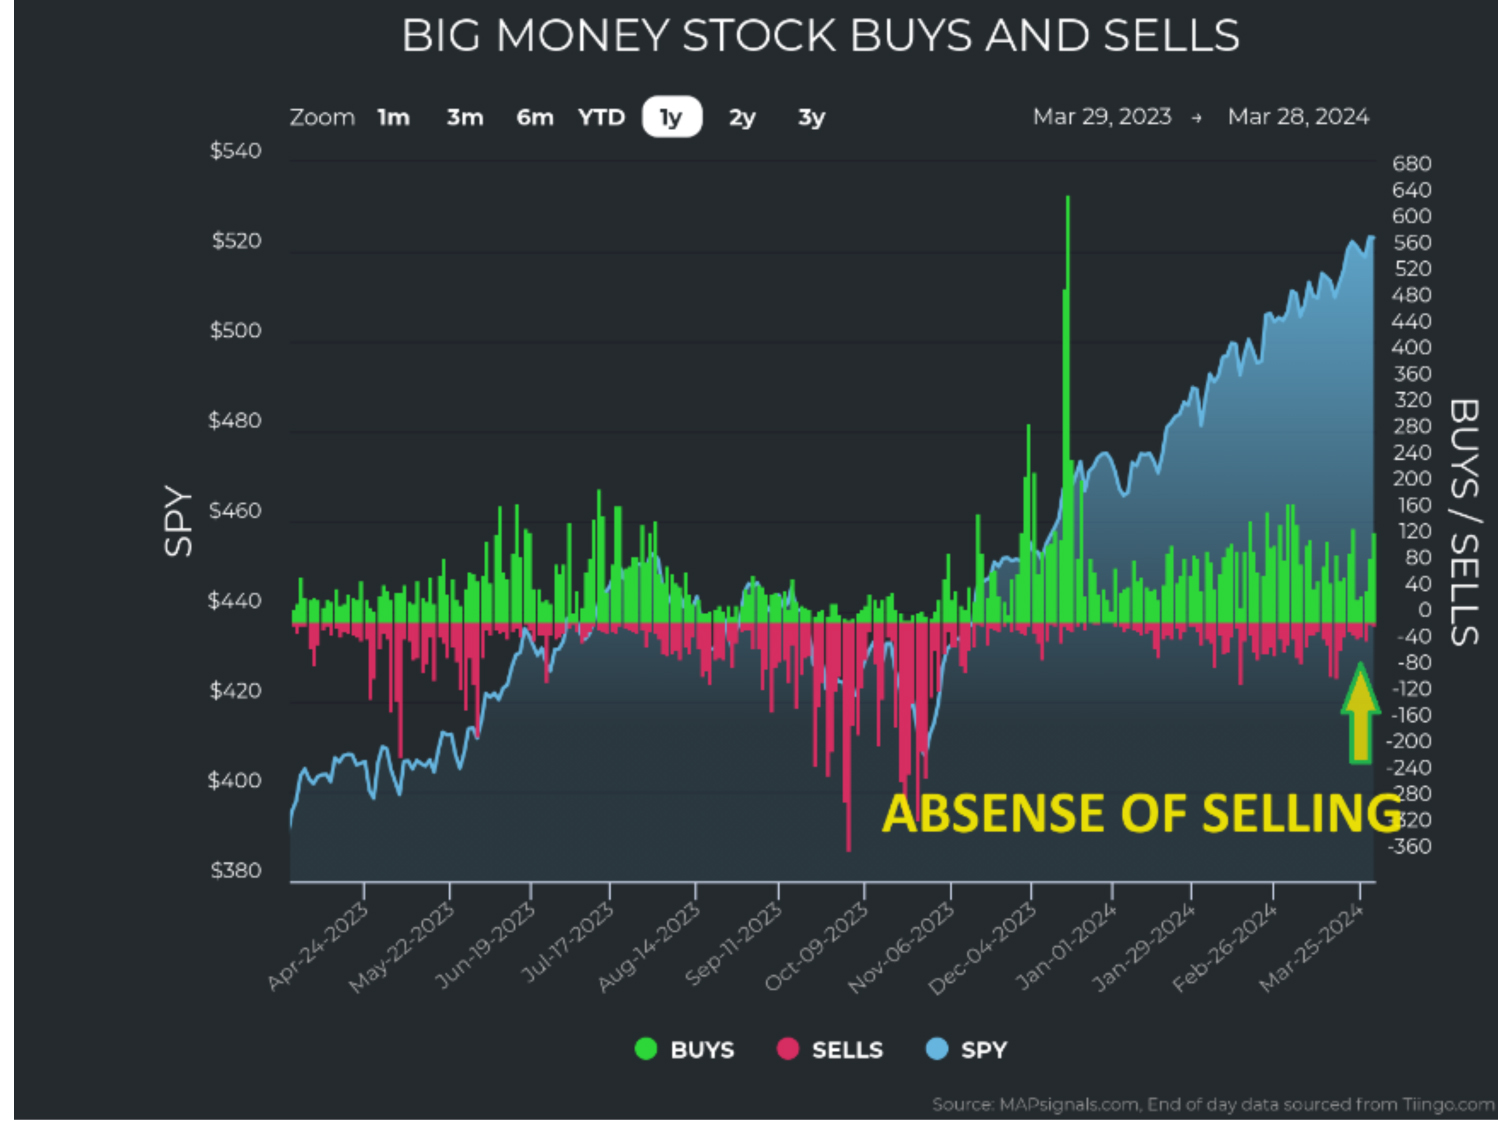
Graphs are for illustrative and discussion purposes only. Please read important disclosures at the end of this commentary.
Last week marks one of several weeks with no earnings. The second week of April brings us the start of Q1 earnings season. Normally these inter-earnings periods can be volatile, with few catalysts for trading. But we didn’t see volatility – we saw more buying, with the buying heavy in small and mid-cap stocks:
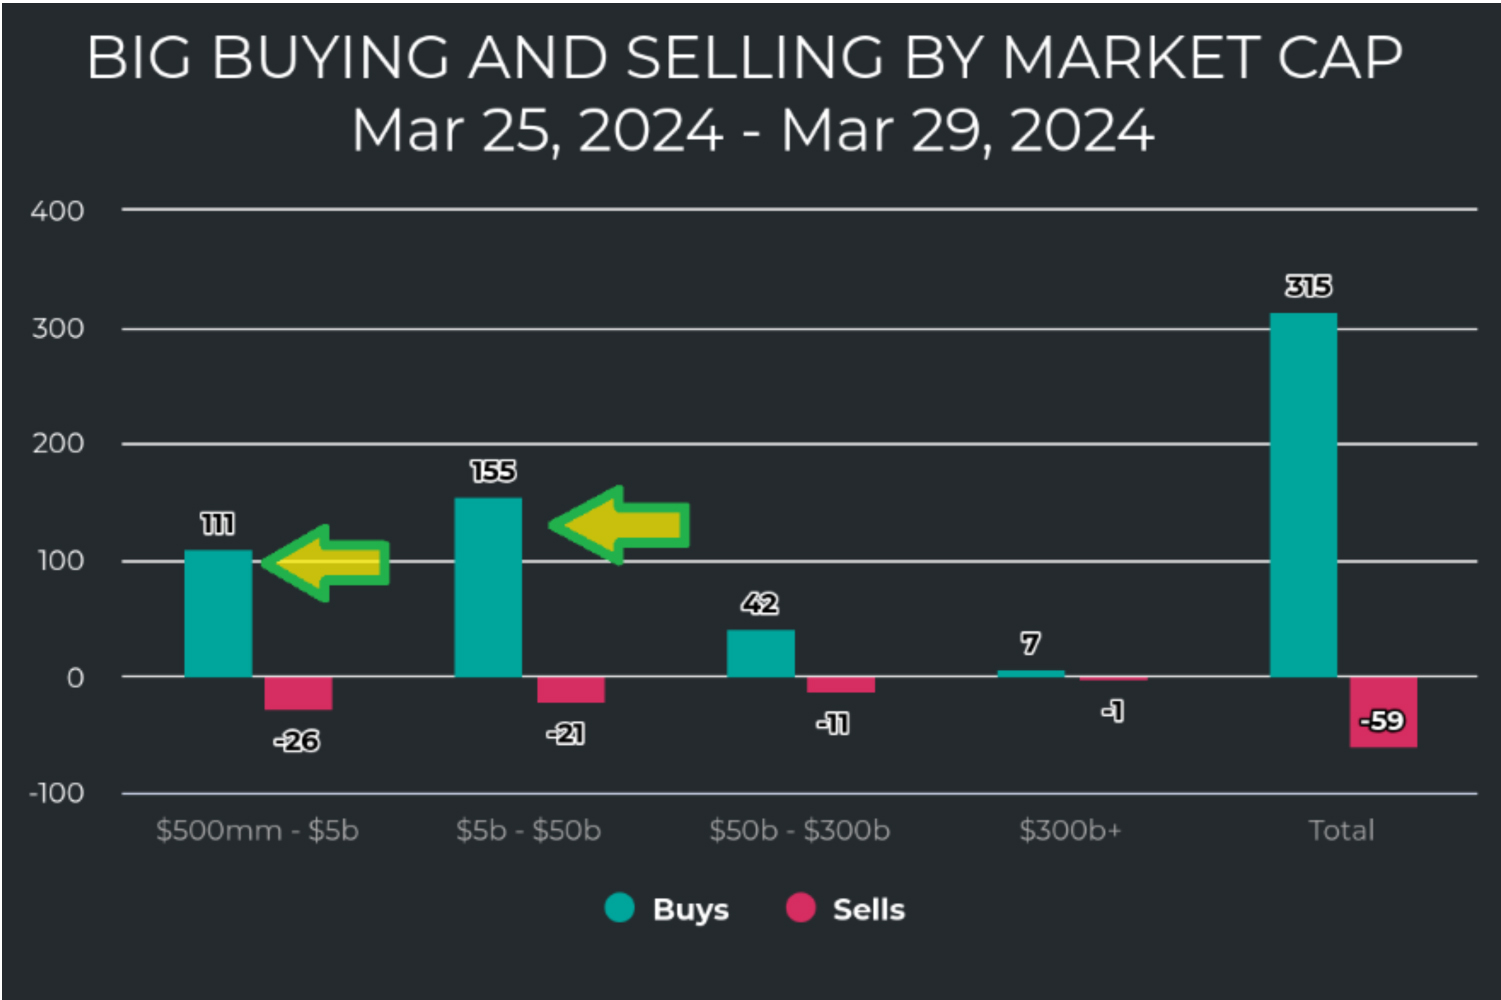
Graphs are for illustrative and discussion purposes only. Please read important disclosures at the end of this commentary.
This data confirms the possibility that the bull market will just keep running.
If we look into the sectors, we see further support for this market strength continuing. The first thing we notice is that sector leadership has shifted lately. Energy’s recent claim at the top of the sector strength list remains, while defensive sectors like Utilities and Communications continue to be at the bottom:
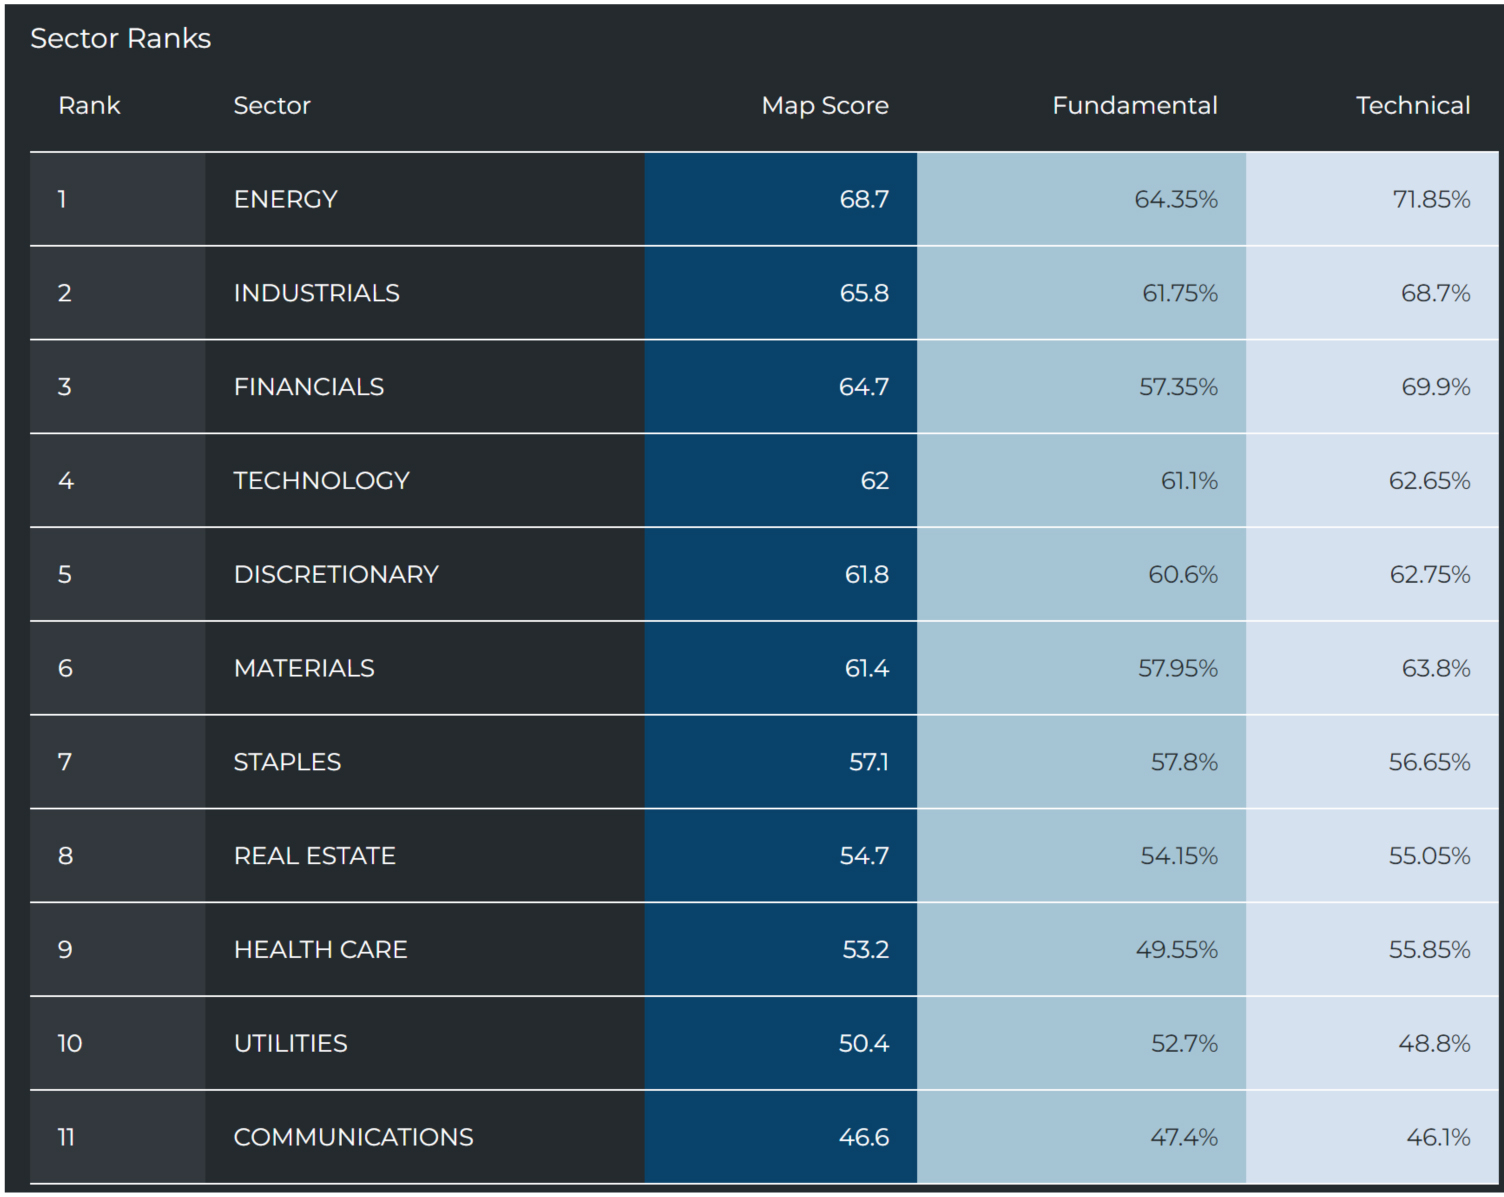
Graphs are for illustrative and discussion purposes only. Please read important disclosures at the end of this commentary.
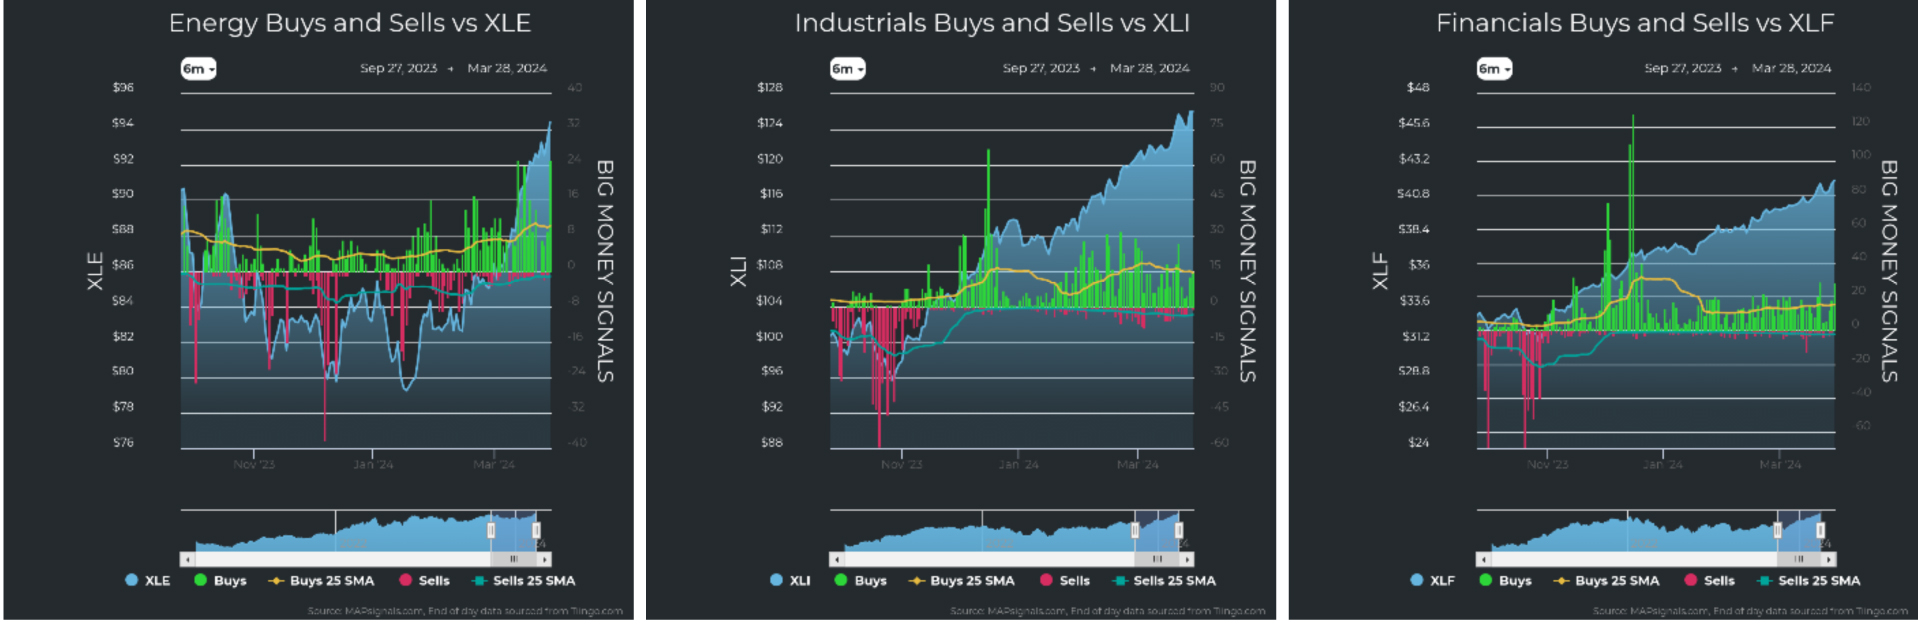
Now, when we look at each sector’s buying and selling distribution, we see a few clear patterns:
- All 11 S&P sector charts are strong. In other words, there are no weak links hiding potential cracks. A simple eye test reveals that there is just no significant selling to worry about right now.
- Communications is the only sector to show some visible selling, but due to inconsistencies when the sector was created (September 21, 2018), there are very few stocks in it. The original idea was to “De-FAANG” the tech sector, so we ended up with the smallest sector, consisting of just 79 out of the roughly 5,500 stocks we score, or 1.4%. Compare that to Financials, which account for 22%.
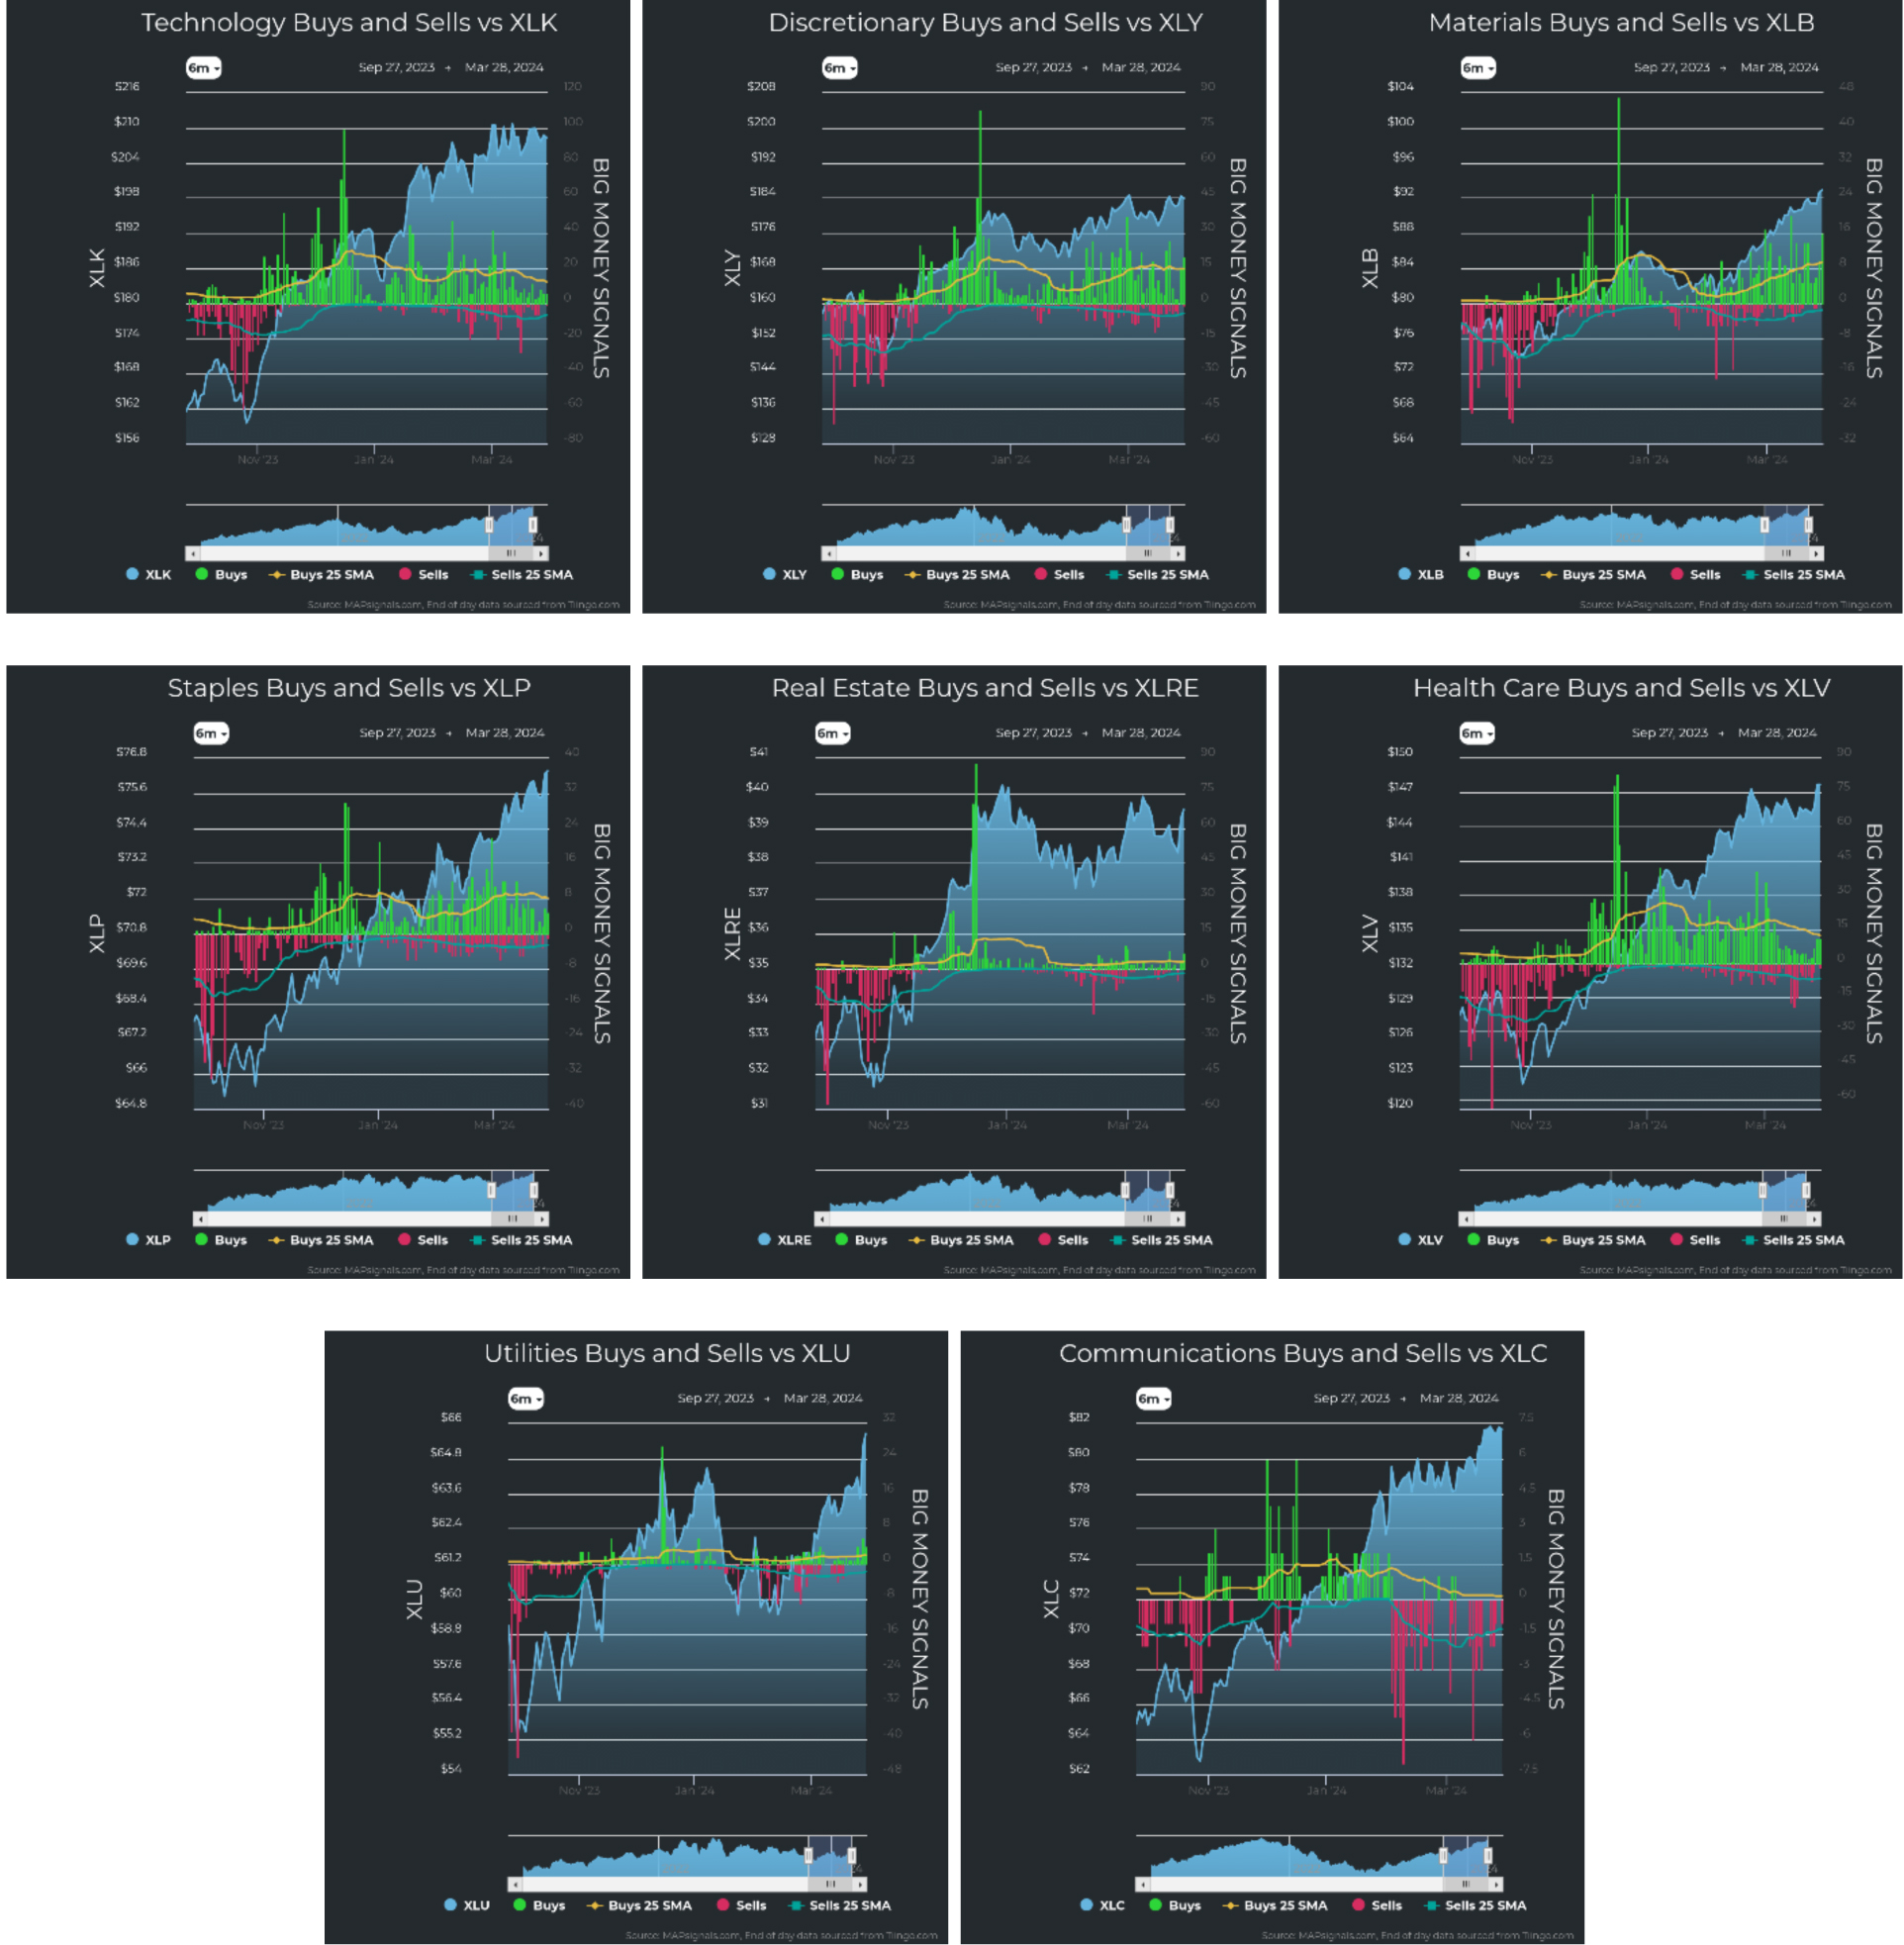
Graphs are for illustrative and discussion purposes only. Please read important disclosures at the end of this commentary.
- The sector that holds the key to a sustained growth period, in my opinion, is Technology. It is the engine of growth for the future advancement of humanity. In any case, the chart to my eyes shows a tightening of a coil. The period of intense buying passed – or has it paused? The chart shows me that we are headed for a potential inflection point: Will buyers come back, or will selling take over? Time will tell, but all other data points support higher prices in the medium to long term, in my opinion.
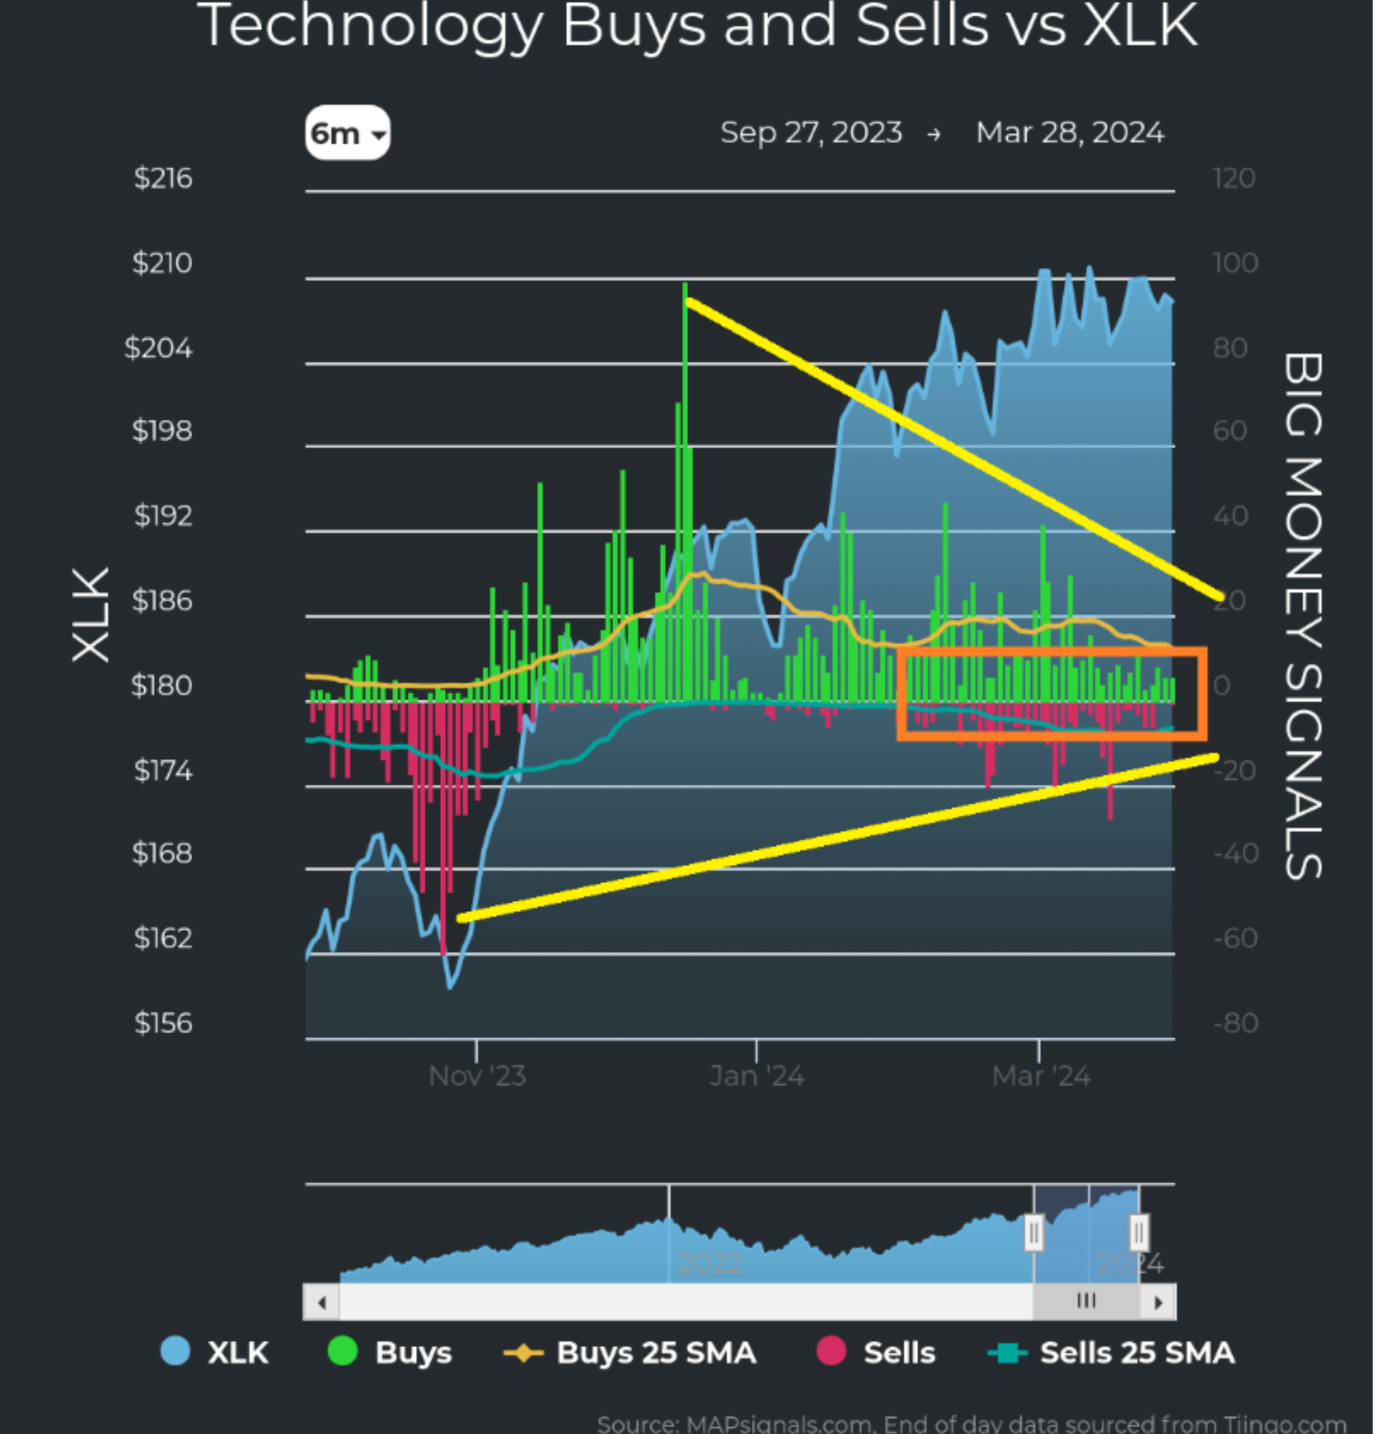
Graphs are for illustrative and discussion purposes only. Please read important disclosures at the end of this commentary.
Attachment to strident beliefs has cost countless human lives. Being on the wrong side of a religious war was deadly for most of mankind’s history. The Ark of the Covenant just reinforces that point.
In The Raiders of the Lost Ark, Indiana Jones was in Tanis searching for the Well of the Souls, which is where Pharaoh Shishak supposedly kept the Ark. The Nazis had the jump on him, but Indy realized that they were basing their hunt on faulty information, so Indiana and his companion, Sallah, looked at each other and realized together: “They’re digging in the wrong place!”
Emotion-guided investors are also digging in the wrong place! I won’t be donning a hat to look into ancient tombs anytime soon, but when it comes to stocks, I don’t have to. I let the data do the talking.
All content above represents the opinion of Jason Bodner of Navellier & Associates, Inc.
Also In This Issue
A Look Ahead by Louis Navellier
Food and Energy – The Overlooked Inflation Drivers
Income Mail by Bryan Perry
A Changing of the Market’s Guard
Growth Mail by Gary Alexander
Is the Economy Really Growing at a Robust 3.4%?
Global Mail by Ivan Martchev
Stocks Are Partying Like It is 1995
Sector Spotlight by Jason Bodner
Raiders of the Lost Art of Investing
View Full Archive
Read Past Issues Here

Jason Bodner
MARKETMAIL EDITOR FOR SECTOR SPOTLIGHT
Jason Bodner writes Sector Spotlight in the weekly Marketmail publication and has authored several white papers for the company. He is also Co-Founder of Macro Analytics for Professionals which produces proprietary equity accumulation/distribution research for its clients. Previously, Mr. Bodner served as Director of European Equity Derivatives for Cantor Fitzgerald Europe in London, then moved to the role of Head of Equity Derivatives North America for the same company in New York. He also served as S.V.P. Equity Derivatives for Jefferies, LLC. He received a B.S. in business administration in 1996, with honors, from Skidmore College as a member of the Periclean Honors Society. All content of “Sector Spotlight” represents the opinion of Jason Bodner
Important Disclosures:
Jason Bodner is a co-founder and co-owner of Mapsignals. Mr. Bodner is an independent contractor who is occasionally hired by Navellier & Associates to write an article and or provide opinions for possible use in articles that appear in Navellier & Associates weekly Market Mail. Mr. Bodner is not employed or affiliated with Louis Navellier, Navellier & Associates, Inc., or any other Navellier owned entity. The opinions and statements made here are those of Mr. Bodner and not necessarily those of any other persons or entities. This is not an endorsement, or solicitation or testimonial or investment advice regarding the BMI Index or any statements or recommendations or analysis in the article or the BMI Index or Mapsignals or its products or strategies.
Although information in these reports has been obtained from and is based upon sources that Navellier believes to be reliable, Navellier does not guarantee its accuracy and it may be incomplete or condensed. All opinions and estimates constitute Navellier’s judgment as of the date the report was created and are subject to change without notice. These reports are for informational purposes only and are not a solicitation for the purchase or sale of a security. Any decision to purchase securities mentioned in these reports must take into account existing public information on such securities or any registered prospectus.To the extent permitted by law, neither Navellier & Associates, Inc., nor any of its affiliates, agents, or service providers assumes any liability or responsibility nor owes any duty of care for any consequences of any person acting or refraining to act in reliance on the information contained in this communication or for any decision based on it.
Past performance is no indication of future results. Investment in securities involves significant risk and has the potential for partial or complete loss of funds invested. It should not be assumed that any securities recommendations made by Navellier. in the future will be profitable or equal the performance of securities made in this report. Dividend payments are not guaranteed. The amount of a dividend payment, if any, can vary over time and issuers may reduce dividends paid on securities in the event of a recession or adverse event affecting a specific industry or issuer.
None of the stock information, data, and company information presented herein constitutes a recommendation by Navellier or a solicitation to buy or sell any securities. Any specific securities identified and described do not represent all of the securities purchased, sold, or recommended for advisory clients. The holdings identified do not represent all of the securities purchased, sold, or recommended for advisory clients and the reader should not assume that investments in the securities identified and discussed were or will be profitable.
Information presented is general information that does not take into account your individual circumstances, financial situation, or needs, nor does it present a personalized recommendation to you. Individual stocks presented may not be suitable for every investor. Investment in securities involves significant risk and has the potential for partial or complete loss of funds invested. Investment in fixed income securities has the potential for the investment return and principal value of an investment to fluctuate so that an investor’s holdings, when redeemed, may be worth less than their original cost.
One cannot invest directly in an index. Index is unmanaged and index performance does not reflect deduction of fees, expenses, or taxes. Presentation of Index data does not reflect a belief by Navellier that any stock index constitutes an investment alternative to any Navellier equity strategy or is necessarily comparable to such strategies. Among the most important differences between the Indices and Navellier strategies are that the Navellier equity strategies may (1) incur material management fees, (2) concentrate its investments in relatively few stocks, industries, or sectors, (3) have significantly greater trading activity and related costs, and (4) be significantly more or less volatile than the Indices.
ETF Risk: We may invest in exchange traded funds (“ETFs”) and some of our investment strategies are generally fully invested in ETFs. Like traditional mutual funds, ETFs charge asset-based fees, but they generally do not charge initial sales charges or redemption fees and investors typically pay only customary brokerage fees to buy and sell ETF shares. The fees and costs charged by ETFs held in client accounts will not be deducted from the compensation the client pays Navellier. ETF prices can fluctuate up or down, and a client account could lose money investing in an ETF if the prices of the securities owned by the ETF go down. ETFs are subject to additional risks:
- ETF shares may trade above or below their net asset value;
- An active trading market for an ETF’s shares may not develop or be maintained;
- The value of an ETF may be more volatile than the underlying portfolio of securities the ETF is designed to track;
- The cost of owning shares of the ETF may exceed those a client would incur by directly investing in the underlying securities; and
- Trading of an ETF’s shares may be halted if the listing exchange’s officials deem it appropriate, the shares are delisted from the exchange, or the activation of market-wide “circuit breakers” (which are tied to large decreases in stock prices) halts stock trading generally.
Grader Disclosures: Investment in equity strategies involves substantial risk and has the potential for partial or complete loss of funds invested. The sample portfolio and any accompanying charts are for informational purposes only and are not to be construed as a solicitation to buy or sell any financial instrument and should not be relied upon as the sole factor in an investment making decision. As a matter of normal and important disclosures to you, as a potential investor, please consider the following: The performance presented is not based on any actual securities trading, portfolio, or accounts, and the reported performance of the A, B, C, D, and F portfolios (collectively the “model portfolios”) should be considered mere “paper” or pro forma performance results based on Navellier’s research.
Investors evaluating any of Navellier & Associates, Inc.’s, (or its affiliates’) Investment Products must not use any information presented here, including the performance figures of the model portfolios, in their evaluation of any Navellier Investment Products. Navellier Investment Products include the firm’s mutual funds and managed accounts. The model portfolios, charts, and other information presented do not represent actual funded trades and are not actual funded portfolios. There are material differences between Navellier Investment Products’ portfolios and the model portfolios, research, and performance figures presented here. The model portfolios and the research results (1) may contain stocks or ETFs that are illiquid and difficult to trade; (2) may contain stock or ETF holdings materially different from actual funded Navellier Investment Product portfolios; (3) include the reinvestment of all dividends and other earnings, estimated trading costs, commissions, or management fees; and, (4) may not reflect prices obtained in an actual funded Navellier Investment Product portfolio. For these and other reasons, the reported performances of model portfolios do not reflect the performance results of Navellier’s actually funded and traded Investment Products. In most cases, Navellier’s Investment Products have materially lower performance results than the performances of the model portfolios presented.
This report contains statements that are, or may be considered to be, forward-looking statements. All statements that are not historical facts, including statements about our beliefs or expectations, are “forward-looking statements” within the meaning of The U.S. Private Securities Litigation Reform Act of 1995. These statements may be identified by such forward-looking terminology as “expect,” “estimate,” “plan,” “intend,” “believe,” “anticipate,” “may,” “will,” “should,” “could,” “continue,” “project,” or similar statements or variations of such terms. Our forward-looking statements are based on a series of expectations, assumptions, and projections, are not guarantees of future results or performance, and involve substantial risks and uncertainty as described in Form ADV Part 2A of our filing with the Securities and Exchange Commission (SEC), which is available at www.adviserinfo.sec.gov or by requesting a copy by emailing info@navellier.com. All of our forward-looking statements are as of the date of this report only. We can give no assurance that such expectations or forward-looking statements will prove to be correct. Actual results may differ materially. You are urged to carefully consider all such factors.
FEDERAL TAX ADVICE DISCLAIMER: As required by U.S. Treasury Regulations, you are informed that, to the extent this presentation includes any federal tax advice, the presentation is not written by Navellier to be used, and cannot be used, for the purpose of avoiding federal tax penalties. Navellier does not advise on any income tax requirements or issues. Use of any information presented by Navellier is for general information only and does not represent tax advice either express or implied. You are encouraged to seek professional tax advice for income tax questions and assistance.
IMPORTANT NEWSLETTER DISCLOSURE:The hypothetical performance results for investment newsletters that are authored or edited by Louis Navellier, including Louis Navellier’s Growth Investor, Louis Navellier’s Breakthrough Stocks, Louis Navellier’s Accelerated Profits, and Louis Navellier’s Platinum Club, are not based on any actual securities trading, portfolio, or accounts, and the newsletters’ reported hypothetical performances should be considered mere “paper” or proforma hypothetical performance results and are not actual performance of real world trades. Navellier & Associates, Inc. does not have any relation to or affiliation with the owner of these newsletters. There are material differences between Navellier Investment Products’ portfolios and the InvestorPlace Media, LLC newsletter portfolios authored by Louis Navellier. The InvestorPlace Media, LLC newsletters contain hypothetical performance that do not include transaction costs, advisory fees, or other fees a client might incur if actual investments and trades were being made by an investor. As a result, newsletter performance should not be used to evaluate Navellier Investment services which are separate and different from the newsletters. The owner of the newsletters is InvestorPlace Media, LLC and any questions concerning the newsletters, including any newsletter advertising or hypothetical Newsletter performance claims, (which are calculated solely by Investor Place Media and not Navellier) should be referred to InvestorPlace Media, LLC at (800) 718-8289.
Please note that Navellier & Associates and the Navellier Private Client Group are managed completely independent of the newsletters owned and published by InvestorPlace Media, LLC and written and edited by Louis Navellier, and investment performance of the newsletters should in no way be considered indicative of potential future investment performance for any Navellier & Associates separately managed account portfolio. Potential investors should consult with their financial advisor before investing in any Navellier Investment Product.
Navellier claims compliance with Global Investment Performance Standards (GIPS). To receive a complete list and descriptions of Navellier’s composites and/or a presentation that adheres to the GIPS standards, please contact Navellier or click here. It should not be assumed that any securities recommendations made by Navellier & Associates, Inc. in the future will be profitable or equal the performance of securities made in this report.
FactSet Disclosure: Navellier does not independently calculate the statistical information included in the attached report. The calculation and the information are provided by FactSet, a company not related to Navellier. Although information contained in the report has been obtained from FactSet and is based on sources Navellier believes to be reliable, Navellier does not guarantee its accuracy, and it may be incomplete or condensed. The report and the related FactSet sourced information are provided on an “as is” basis. The user assumes the entire risk of any use made of this information. Investors should consider the report as only a single factor in making their investment decision. The report is for informational purposes only and is not intended as an offer or solicitation for the purchase or sale of a security. FactSet sourced information is the exclusive property of FactSet. Without prior written permission of FactSet, this information may not be reproduced, disseminated or used to create any financial products. All indices are unmanaged and performance of the indices include reinvestment of dividends and interest income, unless otherwise noted, are not illustrative of any particular investment and an investment cannot be made in any index. Past performance is no guarantee of future results.