by Jason Bodner
April 15, 2025
Uncertainty was once left to fate, divine will, or simple luck. But in the 16th century, Gerolamo Cardano—a mathematician, physician, and gambler—applied logic and numbers to it. He studied dice games and realized outcomes had measurable probabilities. His calculations prefaced modern probability theory. Cardano’s insight wasn’t just mathematical, it was philosophical. He sought to understand uncertainty rather than fearing it. His work inspired later thinkers, like Pascal and Fermat. Cardano helped shift the world from mysticism to measurement, fundamentally changing how we think about risk.
That doesn’t offer much comfort today. Uncertainty dominates, yet data is our only tool to navigate it. By analyzing similar periods in market history, we can attempt to frame possible, or probable, outcomes.
The Recent Carnage, In Perspective
On Friday, April 4th, the S&P 500 dropped nearly 6%, what statisticians would call a near six standard deviation move, based on one-year volatility. That kind of move has occurred on only 30-days since 1950—or just 0.16% of trading days. Some spectacular gains tend to happen after these rare events:

To make matters worse, the S&P 500 had already fallen -4.84% the day before, netting a two-day drop of over 10.5%. Since 1950, this has happened just six times—only 0.03% of the observed trading days.
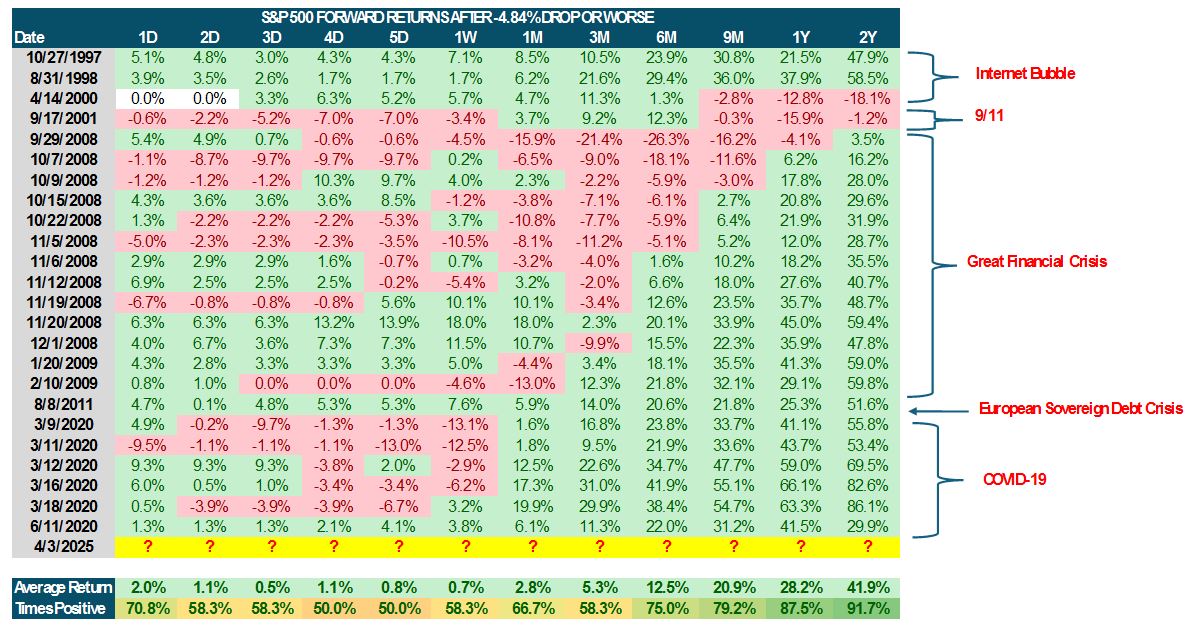
The encouraging news is that forward returns from these levels have historically been strong:
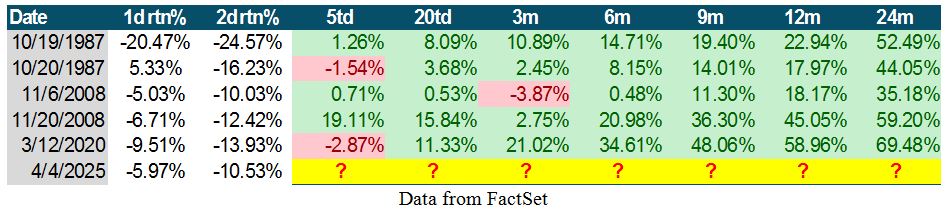
Swimming in a stream that has consistently taken investors to significantly better outcomes over the next 6-, 9-, 12-, and 24-months should offer some reassurance.

A third consecutive down day occurred 2,042 times since 1950, across nearly 19,000-trading days. What tends to follow these 3-day streaks? Again, historical data suggests decent upside performance afterward.
Here are a few more studies of times similar to now:

Graphs are for illustrative and discussion purposes only. Please read important disclosures at the end of this commentary.
Here is the same table from the year 2000 on:
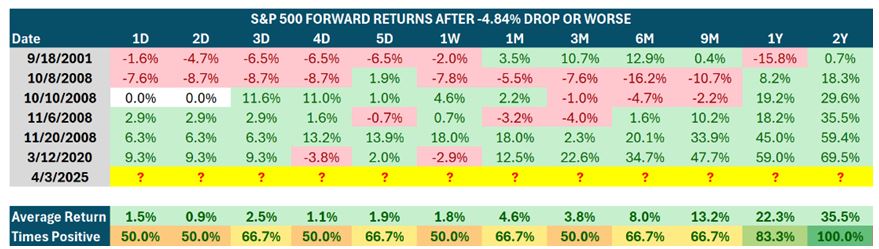
Graphs are for illustrative and discussion purposes only. Please read important disclosures at the end of this commentary.
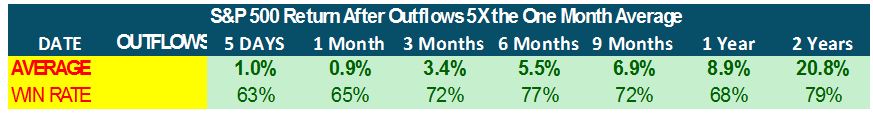
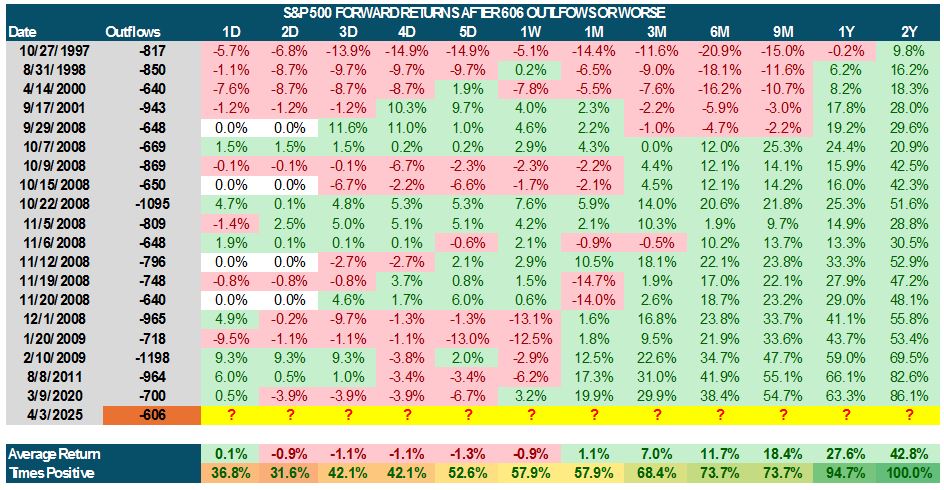
The recent outflows are epic and historic. That said, it still bodes well for the future. On April 3rd we experienced 606 outflows. Here are the times we saw that level or more throughout history:
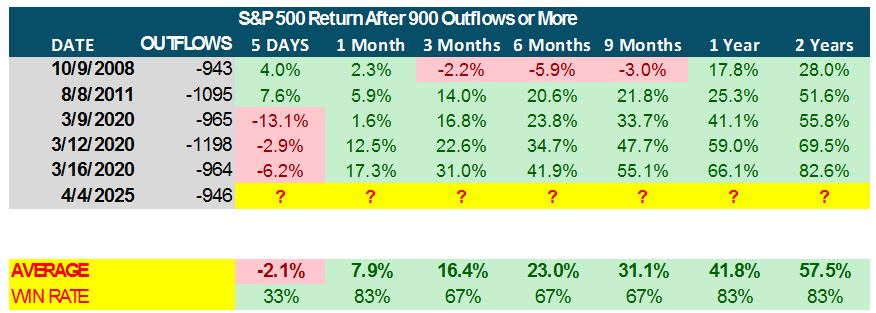
The very next day saw even more destructive outflows – a total of 946 – but history is still on our side:
Graphs are for illustrative and discussion purposes only. Please read important disclosures at the end of this commentary.
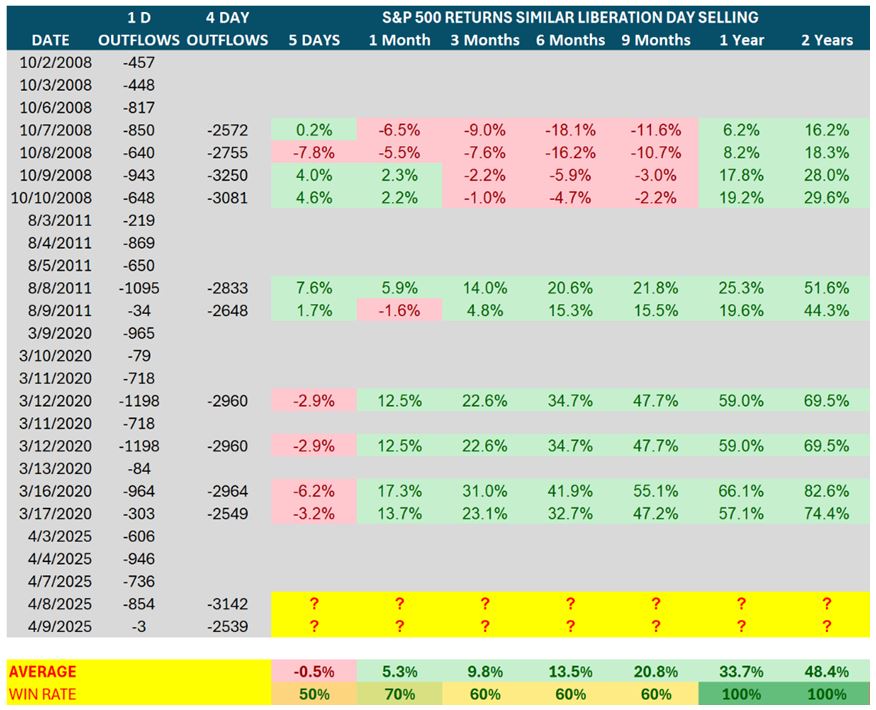
The four-day cumulative total outflows on April 8th hit 3,142 stocks being sold. This happened 12 times in history, including April 8th and 9th. Markets were higher 100% of the time one and two years later:
Graphs are for illustrative and discussion purposes only. Please read important disclosures at the end of this commentary.
So, while this was an undoubtedly a rough stretch, history implies a high probability of improvement.
Market Mechanics
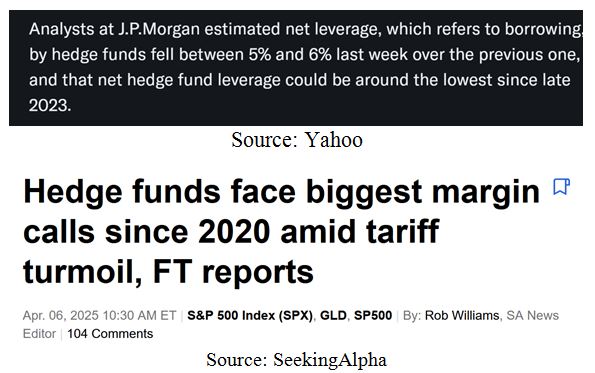
The current sell-off seems to be driven largely by hedge funds. Asian funds in particular have reportedly been liquidating shares. JPMorgan analysts estimated that margin debt usage dropped 5%-6% last week.
That signals deleveraging, a pullback in borrowed investment exposure. As margin unwinds, the system resets. Though uncomfortable, these corrections often lay the groundwork for the next leg higher.
Recession fears are intensifying, and that’s causing banks and brokers to tighten credit and reduce their exposure. The good news? As leverage exits the system, risk assets become more attractively priced, which often leads to strong forward performance once confidence returns.
Money Flows
The Big Money Index (BMI) will surely drop in the coming days, due to the monstrous outflows:
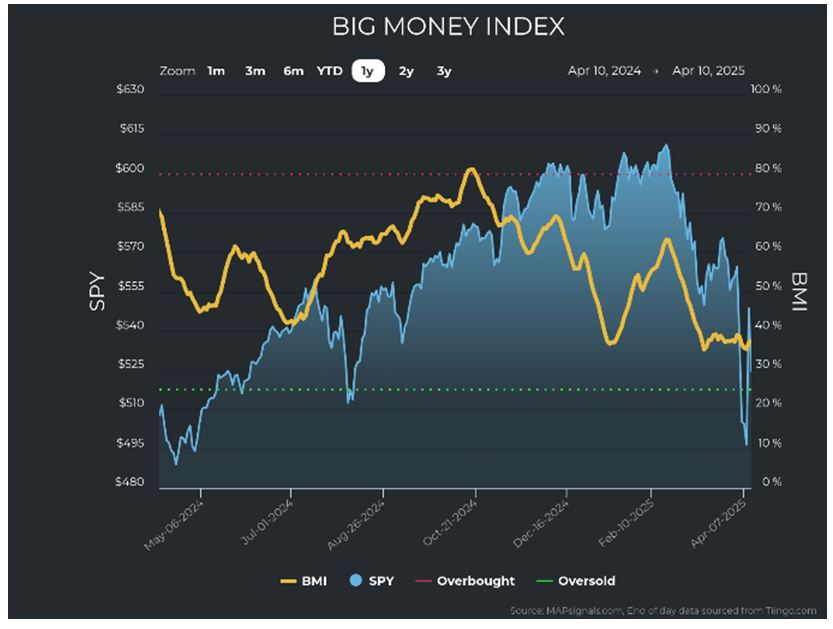
Graphs are for illustrative and discussion purposes only. Please read important disclosures at the end of this commentary.
The outflows were the most seen in many years, if ever. Equity outflows are the highest since COVID:

Graphs are for illustrative and discussion purposes only. Please read important disclosures at the end of this commentary.
ETFs were the highest outflows on record:

Graphs are for illustrative and discussion purposes only. Please read important disclosures at the end of this commentary.
Recently, resilient defensive sectors were not spared the destruction. This indicates capitulation selling when the baby is thrown out with the bathwater. Uncertainty is a powerful thing:


Graphs are for illustrative and discussion purposes only. Please read important disclosures at the end of this commentary.
The Trade War Question
How long will trade tensions last, and how much damage will they do? That’s the million-dollar question.
President Trump appears to be using tariffs as a high-stakes negotiation tactic. In his latest Truth Social post, he warned: “Yesterday, China issued Retaliatory Tariffs of 34%, on top of their already record-setting Tariffs, Non-Monetary Tariffs, Illegal Subsidization of companies, and massive long-term Currency Manipulation… Therefore, if China does not withdraw its 34% increase… the United States will impose ADDITIONAL Tariffs on China of 50%, effective April 9th.”
Trump is playing hardball, aiming to force renegotiation of global trade. It might work. Or not. We already have early indications of resolution in that 75 countries reportedly called to negotiate, resulting in a 90-day pause on tariffs. That news sent markets to their best day of performance in decades.
Either way, we seem to be heading toward either a narrower trade war with China, as opposed to a broader global standoff. My view is that Trump’s strategy serves multiple goals:
- Force fairer trade balances.
- Generate new revenue streams through tariffs.
- Pressure the Fed to lower interest rates by increasing market volatility.
- Enable future domestic tax cuts using tariff proceeds.
While that may sound like an economic utopia—lower rates, lower taxes, higher revenue—it’s a possibility based on a massive gamble. Even if it pays off, it will take time.
Let’s put it into perspective. In August 2007, Bear Stearns’ internal credit fund collapsed, a precursor to the 2008 financial crisis. From that moment to the market bottom in March 2009 took 19 months That crisis nearly collapsed the global financial system. Trade tensions, while serious, do not come close to that level of systemic risk. They also don’t compare to the risks we faced during COVID-19. Or 9/11.
Reality Check
Ask yourself: Will we still drink coffee or orange juice tomorrow morning? Will grocery stores still be open? Will people go to work? Will your kids still go to school, music lessons or Little League?
Yes. Life will go on. Maybe not the same. Maybe more expensive. But not stopped.
For those with cash on the sidelines, now is a time to consider deploying it. Is this the bottom? No one knows. Could we go lower? Absolutely. Could we recover and see new highs by year-end? Yes.
I can’t assign probabilities to any of these outcomes, beyond historical precedent. But that precedent shows an asymmetrical payoff to the upside. The longer your time horizon, the better your odds.
When shopping for stocks, look for businesses you know will be around in five, 10 or 20 years. If you’re a W-2 worker contributing to a 401(k), take comfort in the fact that you’re buying in at lower levels. Watching your portfolio shrink is hard—but remember, losses aren’t realized until you sell.
It’s the same with your home. If your neighbor sells their house below market due to distress, your home value may appear lower on paper. But unless you sell it, you haven’t lost anything.
Long-term investors know that staying invested during painful periods often leads to outsized rewards. In fact, the best time to buy is usually when things feel the worst.
Sales in the stock market don’t look like Black Friday bargains. They look like bloodbaths.
Like distressed real estate, this is when great opportunities emerge. I still believe in America. At the height of the 2008 crisis, Warren Buffett wrote in an op-ed:
“Be fearful when others are greedy, and greedy when others are fearful.”
Wise words. Will we heed them? Is this a time to fear? Or a time to embrace opportunity?
The answer lies within you.
All content above represents the opinion of Jason Bodner of Navellier & Associates, Inc.
Also In This Issue
A Look Ahead by Louis Navellier
Our Trade War is Now Only with China, Not the Whole World
Income Mail by Bryan Perry
A Bond Market Sell-Off is Anything But a “Yippy” Reaction
Growth Mail by Gary Alexander
Happy Tax Day and 250th Birthday, America
Global Mail by Ivan Martchev
Could the Surge in Treasury Yields Be the Market’s “Shot Across the Bow?”
Sector Spotlight by Jason Bodner
Probability is Harder to Track During this New “Age of Uncertainty”
View Full Archive
Read Past Issues Here

Jason Bodner
MARKETMAIL EDITOR FOR SECTOR SPOTLIGHT
Jason Bodner writes Sector Spotlight in the weekly Marketmail publication and has authored several white papers for the company. He is also Co-Founder of Macro Analytics for Professionals which produces proprietary equity accumulation and distribution research for its clients. Previously, Mr. Bodner served as Director of European Equity Derivatives for Cantor Fitzgerald Europe in London, then moved to the role of Head of Equity Derivatives North America for the same company in New York. He also served as S.V.P. Equity Derivatives for Jefferies, LLC. He received a B.S. in business administration in 1996, with honors, from Skidmore College as a member of the Periclean Honors Society. All content of “Sector Spotlight” represents the opinion of Jason Bodner
Important Disclosures:
Jason Bodner is a co-founder and co-owner of Mapsignals. Mr. Bodner is an independent contractor who is occasionally hired by Navellier & Associates to write an article and or provide opinions for possible use in articles that appear in Navellier & Associates weekly Market Mail. Mr. Bodner is not employed or affiliated with Louis Navellier, Navellier & Associates, Inc., or any other Navellier owned entity. The opinions and statements made here are those of Mr. Bodner and not necessarily those of any other persons or entities. This is not an endorsement, or solicitation or testimonial or investment advice regarding the BMI Index or any statements or recommendations or analysis in the article or the BMI Index or Mapsignals or its products or strategies.
Although information in these reports has been obtained from and is based upon sources that Navellier believes to be reliable, Navellier does not guarantee its accuracy and it may be incomplete or condensed. All opinions and estimates constitute Navellier’s judgment as of the date the report was created and are subject to change without notice. These reports are for informational purposes only and are not a solicitation for the purchase or sale of a security. Any decision to purchase securities mentioned in these reports must take into account existing public information on such securities or any registered prospectus.To the extent permitted by law, neither Navellier & Associates, Inc., nor any of its affiliates, agents, or service providers assumes any liability or responsibility nor owes any duty of care for any consequences of any person acting or refraining to act in reliance on the information contained in this communication or for any decision based on it.
Past performance is no indication of future results. Investment in securities involves significant risk and has the potential for partial or complete loss of funds invested. It should not be assumed that any securities recommendations made by Navellier. in the future will be profitable or equal the performance of securities made in this report. Dividend payments are not guaranteed. The amount of a dividend payment, if any, can vary over time and issuers may reduce dividends paid on securities in the event of a recession or adverse event affecting a specific industry or issuer.
None of the stock information, data, and company information presented herein constitutes a recommendation by Navellier or a solicitation to buy or sell any securities. Any specific securities identified and described do not represent all of the securities purchased, sold, or recommended for advisory clients. The holdings identified do not represent all of the securities purchased, sold, or recommended for advisory clients and the reader should not assume that investments in the securities identified and discussed were or will be profitable.
Information presented is general information that does not take into account your individual circumstances, financial situation, or needs, nor does it present a personalized recommendation to you. Individual stocks presented may not be suitable for every investor. Investment in securities involves significant risk and has the potential for partial or complete loss of funds invested. Investment in fixed income securities has the potential for the investment return and principal value of an investment to fluctuate so that an investor’s holdings, when redeemed, may be worth less than their original cost.
One cannot invest directly in an index. Index is unmanaged and index performance does not reflect deduction of fees, expenses, or taxes. Presentation of Index data does not reflect a belief by Navellier that any stock index constitutes an investment alternative to any Navellier equity strategy or is necessarily comparable to such strategies. Among the most important differences between the Indices and Navellier strategies are that the Navellier equity strategies may (1) incur material management fees, (2) concentrate its investments in relatively few stocks, industries, or sectors, (3) have significantly greater trading activity and related costs, and (4) be significantly more or less volatile than the Indices.
ETF Risk: We may invest in exchange traded funds (“ETFs”) and some of our investment strategies are generally fully invested in ETFs. Like traditional mutual funds, ETFs charge asset-based fees, but they generally do not charge initial sales charges or redemption fees and investors typically pay only customary brokerage fees to buy and sell ETF shares. The fees and costs charged by ETFs held in client accounts will not be deducted from the compensation the client pays Navellier. ETF prices can fluctuate up or down, and a client account could lose money investing in an ETF if the prices of the securities owned by the ETF go down. ETFs are subject to additional risks:
- ETF shares may trade above or below their net asset value;
- An active trading market for an ETF’s shares may not develop or be maintained;
- The value of an ETF may be more volatile than the underlying portfolio of securities the ETF is designed to track;
- The cost of owning shares of the ETF may exceed those a client would incur by directly investing in the underlying securities and;
- Trading of an ETF’s shares may be halted if the listing exchange’s officials deem it appropriate, the shares are delisted from the exchange, or the activation of market-wide “circuit breakers” (which are tied to large decreases in stock prices) halts stock trading generally.
Grader Disclosures: Investment in equity strategies involves substantial risk and has the potential for partial or complete loss of funds invested. The sample portfolio and any accompanying charts are for informational purposes only and are not to be construed as a solicitation to buy or sell any financial instrument and should not be relied upon as the sole factor in an investment making decision. As a matter of normal and important disclosures to you, as a potential investor, please consider the following: The performance presented is not based on any actual securities trading, portfolio, or accounts, and the reported performance of the A, B, C, D, and F portfolios (collectively the “model portfolios”) should be considered mere “paper” or pro forma performance results based on Navellier’s research.
Investors evaluating any of Navellier & Associates, Inc.’s, (or its affiliates’) Investment Products must not use any information presented here, including the performance figures of the model portfolios, in their evaluation of any Navellier Investment Products. Navellier Investment Products include the firm’s mutual funds and managed accounts. The model portfolios, charts, and other information presented do not represent actual funded trades and are not actual funded portfolios. There are material differences between Navellier Investment Products’ portfolios and the model portfolios, research, and performance figures presented here. The model portfolios and the research results (1) may contain stocks or ETFs that are illiquid and difficult to trade; (2) may contain stock or ETF holdings materially different from actual funded Navellier Investment Product portfolios; (3) include the reinvestment of all dividends and other earnings, estimated trading costs, commissions, or management fees; and, (4) may not reflect prices obtained in an actual funded Navellier Investment Product portfolio. For these and other reasons, the reported performances of model portfolios do not reflect the performance results of Navellier’s actually funded and traded Investment Products. In most cases, Navellier’s Investment Products have materially lower performance results than the performances of the model portfolios presented.
This report contains statements that are, or may be considered to be, forward-looking statements. All statements that are not historical facts, including statements about our beliefs or expectations, are “forward-looking statements” within the meaning of The U.S. Private Securities Litigation Reform Act of 1995. These statements may be identified by such forward-looking terminology as “expect,” “estimate,” “plan,” “intend,” “believe,” “anticipate,” “may,” “will,” “should,” “could,” “continue,” “project,” or similar statements or variations of such terms. Our forward-looking statements are based on a series of expectations, assumptions, and projections, are not guarantees of future results or performance, and involve substantial risks and uncertainty as described in Form ADV Part 2A of our filing with the Securities and Exchange Commission (SEC), which is available at www.adviserinfo.sec.gov or by requesting a copy by emailing info@navellier.com. All of our forward-looking statements are as of the date of this report only. We can give no assurance that such expectations or forward-looking statements will prove to be correct. Actual results may differ materially. You are urged to carefully consider all such factors.
FEDERAL TAX ADVICE DISCLAIMER: As required by U.S. Treasury Regulations, you are informed that, to the extent this presentation includes any federal tax advice, the presentation is not written by Navellier to be used, and cannot be used, for the purpose of avoiding federal tax penalties. Navellier does not advise on any income tax requirements or issues. Use of any information presented by Navellier is for general information only and does not represent tax advice either express or implied. You are encouraged to seek professional tax advice for income tax questions and assistance.
IMPORTANT NEWSLETTER DISCLOSURE:The hypothetical performance results for investment newsletters that are authored or edited by Louis Navellier, including Louis Navellier’s Growth Investor, Louis Navellier’s Breakthrough Stocks, Louis Navellier’s Accelerated Profits, and Louis Navellier’s Platinum Club, are not based on any actual securities trading, portfolio, or accounts, and the newsletters’ reported hypothetical performances should be considered mere “paper” or proforma hypothetical performance results and are not actual performance of real world trades. Navellier & Associates, Inc. does not have any relation to or affiliation with the owner of these newsletters. There are material differences between Navellier Investment Products’ portfolios and the InvestorPlace Media, LLC newsletter portfolios authored by Louis Navellier. The InvestorPlace Media, LLC newsletters contain hypothetical performance that do not include transaction costs, advisory fees, or other fees a client might incur if actual investments and trades were being made by an investor. As a result, newsletter performance should not be used to evaluate Navellier Investment services which are separate and different from the newsletters. The owner of the newsletters is InvestorPlace Media, LLC and any questions concerning the newsletters, including any newsletter advertising or hypothetical Newsletter performance claims, (which are calculated solely by Investor Place Media and not Navellier) should be referred to InvestorPlace Media, LLC at (800) 718-8289.
Please note that Navellier & Associates and the Navellier Private Client Group are managed completely independent of the newsletters owned and published by InvestorPlace Media, LLC and written and edited by Louis Navellier, and investment performance of the newsletters should in no way be considered indicative of potential future investment performance for any Navellier & Associates separately managed account portfolio. Potential investors should consult with their financial advisor before investing in any Navellier Investment Product.
Navellier claims compliance with Global Investment Performance Standards (GIPS). To receive a complete list and descriptions of Navellier’s composites and/or a presentation that adheres to the GIPS standards, please contact Navellier or click here. It should not be assumed that any securities recommendations made by Navellier & Associates, Inc. in the future will be profitable or equal the performance of securities made in this report.
FactSet Disclosure: Navellier does not independently calculate the statistical information included in the attached report. The calculation and the information are provided by FactSet, a company not related to Navellier. Although information contained in the report has been obtained from FactSet and is based on sources Navellier believes to be reliable, Navellier does not guarantee its accuracy, and it may be incomplete or condensed. The report and the related FactSet sourced information are provided on an “as is” basis. The user assumes the entire risk of any use made of this information. Investors should consider the report as only a single factor in making their investment decision. The report is for informational purposes only and is not intended as an offer or solicitation for the purchase or sale of a security. FactSet sourced information is the exclusive property of FactSet. Without prior written permission of FactSet, this information may not be reproduced, disseminated or used to create any financial products. All indices are unmanaged and performance of the indices include reinvestment of dividends and interest income, unless otherwise noted, are not illustrative of any particular investment and an investment cannot be made in any index. Past performance is no guarantee of future results.