by Bryan Perry
March 4, 2025
The noise level about the domestic economy downshifting from the strong finish in 2024 to that of a softer first quarter of 2025 is on the rise. There are several empirical and anecdotal points of evidence and fresh views from leading market economists that corroborate the facts (and growing narrative), that the Trump 2.0 trade has some wood left to chop to fortify some recently damaged investor sentiment.
Just to be clear, there are no hidden agenda items that are suddenly clouding the market’s landscape. The red wave that defined the November election remain – being tough on fentanyl, illegal human trafficking, sealing the borders, killing terrorists, punishing sanctuary cites, leveling the tariff playing field, getting out of Ukraine with a lasting peace and some well-deserved payback of military support, and rinsing the federal bureaucracy of needless workers, waste, fraud and abuse that helped build a $38-trillion deficit.
None of these policy goals should come as surprise out of left field. There are millions of people with non-essential jobs in the local, state, and federal government that are now feeling what it is like to live in the private sector. Corporations and businesses of all sizes constantly need to make hard decisions to survive and thrive. Congress and many government offices have offered near-lifetime job security, living very high on the hog for decades, and it is all coming home to roost. The debt-laden punch bowl is empty.
Multitudes of fraudsters within the orbit of government power, allocating public funds to businesses owned by families and friends, where some newly minted millionaires should not just lose their jobs, but do hard time, so the people that make up DOGE and the AI tools they are employing are doing a deep dive into the corruption. That does not sit very well in many parts of the DMV (DC, Maryland, Virginia) beltway bandit society that has lived extra-large on the sweat of everyday American taxpayers.
Markets have long ignored this oncoming train-wreck between the federal debt and the systemic government corruption controlled by Super-PAC organizations that don’t care about fiscal responsibility – just power, control and short-term hyper wealth building. So, let’s look at what is influencing the bearish market sentiment and why the tough medicine being applied will result in a higher market by year end.
#1: The Cautious Consumer: The two most recent data points regarding the U.S. consumer came in well below forecast, the blame being laid on renewed concerns of inflation, the impact of tariffs and lower job security due in part to the federal layoffs. The final University of Michigan Index of Consumer Sentiment for February dropped to 64.7 (consensus 67.8) from the preliminary reading of 67.8, and the final reading for January was 71.7. In the same period a year ago, the index stood higher, at 76.9.
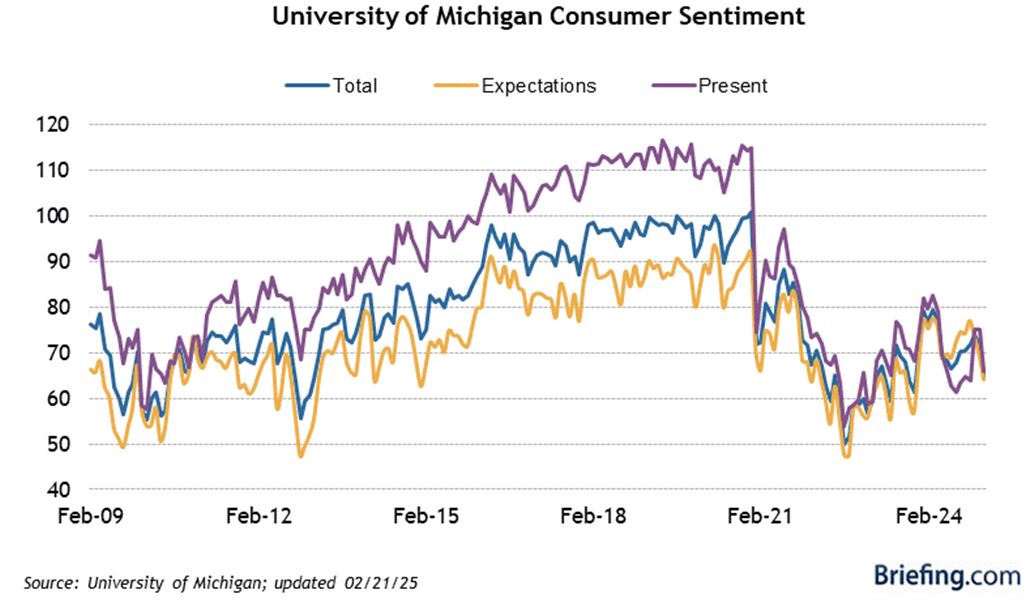
Graphs are for illustrative and discussion purposes only. Please read important disclosures at the end of this commentary.
Also, the Conference Board’s Consumer Confidence Index dropped to 98.3 in February (consensus 103.1) from an upwardly revised 105.3 (from 104.1) in January, the largest monthly decline since August 2021.
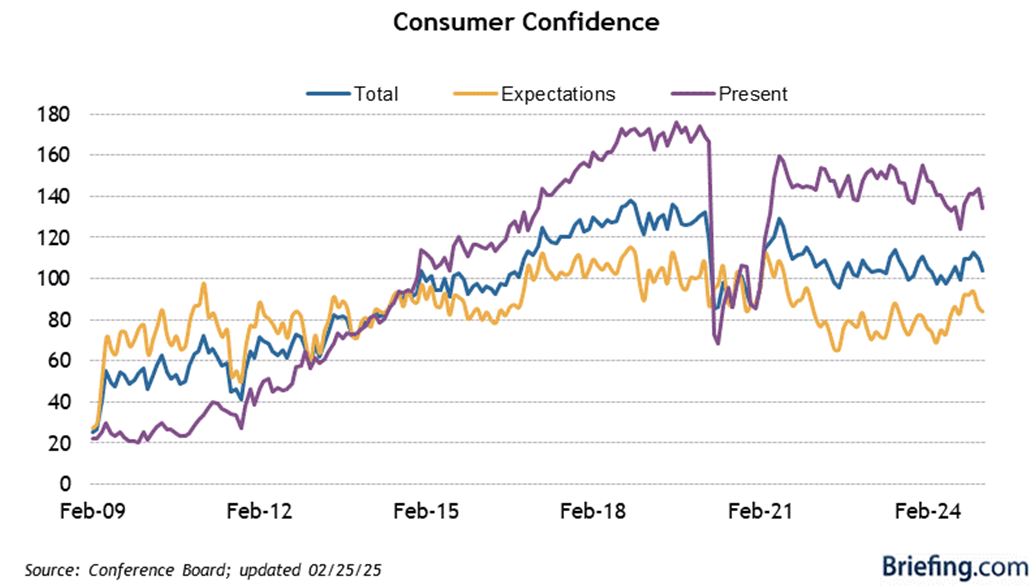
Graphs are for illustrative and discussion purposes only. Please read important disclosures at the end of this commentary.
#2: The Weekly Initial Jobless Claims are Trending Higher: Initial jobless claims for the week ending February 22 increased by 22,000 to 242,000 (consensus: 220,000). Continuing jobless claims for the week ending February 15 were 1,867,000. The four-week moving average for initial claims increased by 8,500 to 224,000. The four-week moving average for continuing claims increased by 3,000 to 1,865,000. The key takeaway from this report is that initial jobless claims reached their highest level since early December, which will add to the market’s festering concerns about a growth slowdown.
#3: High-Profile Layoffs and Fewer Job Openings: I noted last week that the number and size of white-collar layoffs is rising. Chevron announced two weeks ago that they will lay off 20% of their global workforce, or roughly 8,000 employees. BP announced layoffs of 7,700. Microsoft announced an undisclosed number of layoffs. Meta announced another round of layoffs that comes to around 3,600 employees. Workday laid off about 1,750 employees, or 8.5% of staff, and Google is offering voluntary buyouts to workers in its platforms and devices units while Salesforce laid off 1,000 this month.
#4: Elimination of Non-Essential Government Jobs & Programs: Dante DeAntonio, labor economist for Moody’s Analytics, told FOX Business that the federal government has about three million workers, excluding the military, as of the start of 2025. He said that “the private sector should be able to absorb some of these workers. We estimate that about 100,000 federal workers have already been laid off or have accepted the deferred buyout offered by the Trump administration.” The biggest risk, he said, is that “the layoffs we have seen so far are just the tip of the iceberg. The magnitude and timing of future layoffs will determine whether the labor market can stay on the rails.” DeAntonio estimated that, “We currently expect that the size of the federal workforce will shrink by about 400,000 throughout 2025 due to a combination of the ongoing hiring freeze, deferred resignations, and DOGE-initiated layoffs.’
#5: The Personal Consumption Expenditures Index (PCE) Data is in “Goldilocks” Territory: The Fed’s preferred inflation measure, the PCE Price Index, was up 0.3% month-over-month, as expected, and up 2.5% year-over-year versus 2.6% in December. The Core-PCE Price Index was up 0.3% and 2.6% year-over-year, moving nicely lower month-over month. At the same time, personal income increased by a robust 0.9% month-over-month in January (consensus 0.3%), led by a 1.8% jump in personal current transfer receipts, following a 0.4% increase in December, and personal spending declined 0.2% month-over-month (consensus 0.2%) following an upwardly revised 0.8% increase (from 0.7%) in December.
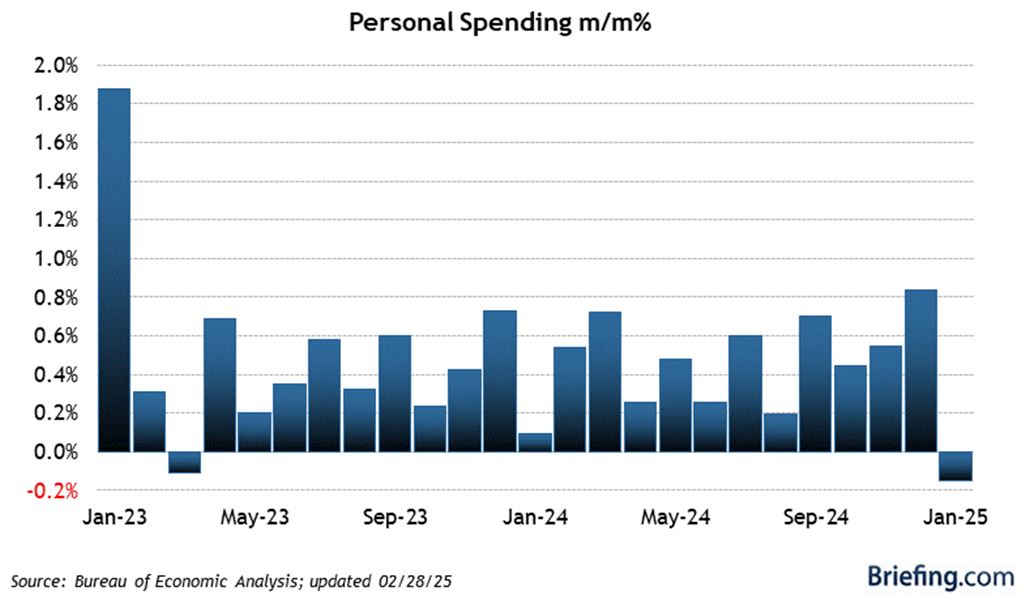
Graphs are for illustrative and discussion purposes only. Please read important disclosures at the end of this commentary.
The above set of data points is just what the maligned bond market needed to right itself, and right itself it has, with the yield on the 10-year Treasury moving from 4.80% in mid-January to a current rate of 4.24%. This is a huge move, based on newfound fears of a recession grounded in uncertainty about the risk of trade wars, tariff-induced inflation, a widespread crackdown on illegal immigration, and the unknown future of all those non-essential government workers that now have to redefine themselves in other jobs.
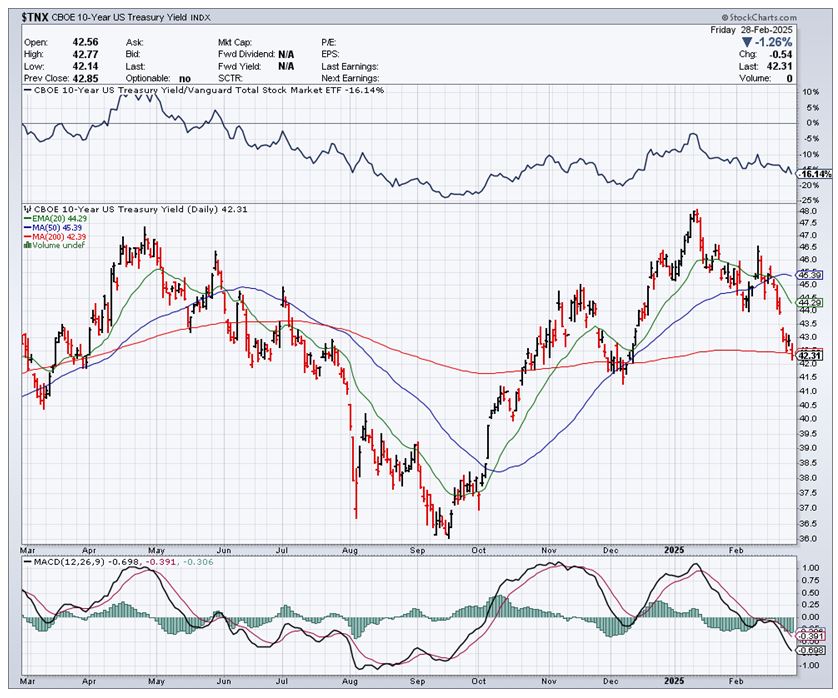
Graphs are for illustrative and discussion purposes only. Please read important disclosures at the end of this commentary.
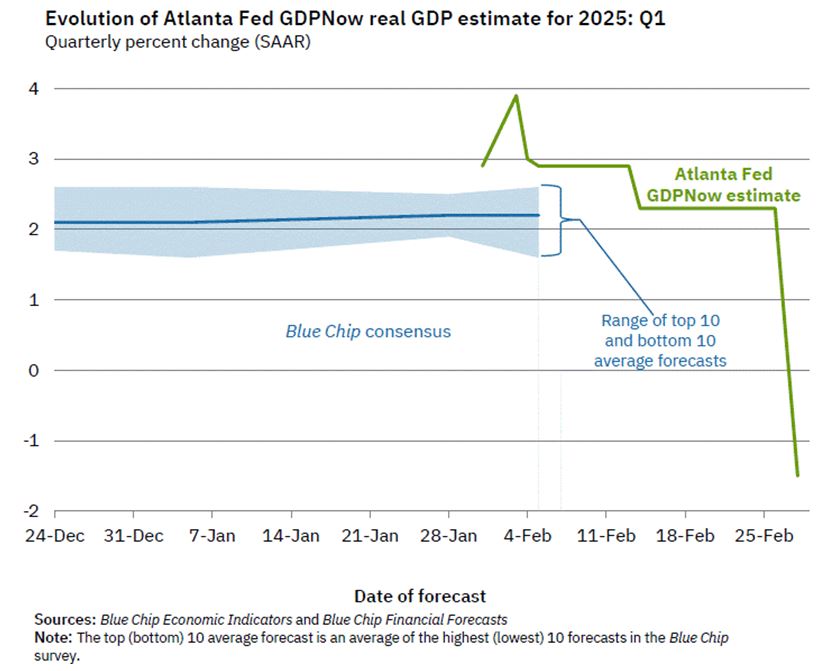
#6: The Latest GDPNow from the Atlanta Fed Has Turned Negative. The Atlanta Fed’s GDPNow model estimate for real GDP growth (at a seasonally adjusted annual rate) in the first quarter of 2025 is -1.5 percent, as of February 28, down from +2.3 percent on February 19. Really? A 3.8% swing in a single week over the threat of tariffs that may impact only 11% of the total U.S. economy.
This massive one drop is so drastic that I wonder if there is some political motivation here. The Atlanta Fed President, Raphael Bostic, was appointed in 2017 by the Senate in a campaign led by Senator Sherrod Brown (D-OH), ranking member of the U.S. Senate Committee on Banking, Housing and Urban Affairs, at the time citing the persistent lack of diversity among presidents and directors at the Fed’s 12 regional banks. One would hope a regional Fed isn’t shaping a statistical indicator due to its political agenda.
Graphs are for illustrative and discussion purposes only. Please read important disclosures at the end of this commentary.
Regardless of whether the Atlanta GDPNow data is turning political, the job market is softening at a pace that is arguably picking up speed. Recall the Fed has a dual mandate: Keeping inflation low and striving for maximum employment. Currently, there is a 93% probably the Fed will keep the Fed funds rate unchanged at 4.25%-4.50% at the March 19 FOMC meeting, and a 30.2% probability the Fed lowers it by a quarter point at the May 7 FOMC meeting. I would contest that the Fed is once again behind the curve and will scramble by mid-year to counter an eroding job market that is just now showing some cracks.
Navellier & Associates own; Alphabet Inc. Class A (GOOGL), Microsoft Corp (MSFT), and Meta Platforms Inc. Class A (META), in some managed accounts. Navellier does not own; Chevron (CVX), or BP plc (BP). Bryan Perry does not own; Alphabet Inc. Class A (GOOGL), Microsoft Corp (MSFT), Meta Platforms Inc. Class A (META), Chevron (CVX), or BP plc (BP) personally.
All content above represents the opinion of Bryan Perry of Navellier & Associates, Inc.
Also In This Issue
A Look Ahead by Louis Navellier
The Blow-up in Washington – and its Likely Repercussions
Income Mail by Bryan Perry
The Fed May Cut Rates Sooner Than Expected–to Deal with a Tighter Job Market
Growth Mail by Gary Alexander
March in Market History – and Some Great March 4th Inauguration Messages
Global Mail by Ivan Martchev
The Bond Market Is Beginning to Worry (a Little) About the Economy
Sector Spotlight by Jason Bodner
March – A New Month That is Almost Like a New Year!
View Full Archive
Read Past Issues Here

Bryan Perry
SENIOR DIRECTOR
Bryan Perry is a Senior Director with Navellier Private Client Group, advising and facilitating high net worth investors in the pursuit of their financial goals.
Bryan’s financial services career spanning the past three decades includes over 20-years of wealth management experience with Wall Street firms that include Bear Stearns, Lehman Brothers and Paine Webber, working with both retail and institutional clients. Bryan earned a B.A. in Political Science from Virginia Polytechnic Institute & State University and currently holds a Series 65 license. All content of “Income Mail” represents the opinion of Bryan Perry
Important Disclosures:
Although information in these reports has been obtained from and is based upon sources that Navellier believes to be reliable, Navellier does not guarantee its accuracy and it may be incomplete or condensed. All opinions and estimates constitute Navellier’s judgment as of the date the report was created and are subject to change without notice. These reports are for informational purposes only and are not a solicitation for the purchase or sale of a security. Any decision to purchase securities mentioned in these reports must take into account existing public information on such securities or any registered prospectus.To the extent permitted by law, neither Navellier & Associates, Inc., nor any of its affiliates, agents, or service providers assumes any liability or responsibility nor owes any duty of care for any consequences of any person acting or refraining to act in reliance on the information contained in this communication or for any decision based on it.
Past performance is no indication of future results. Investment in securities involves significant risk and has the potential for partial or complete loss of funds invested. It should not be assumed that any securities recommendations made by Navellier. in the future will be profitable or equal the performance of securities made in this report. Dividend payments are not guaranteed. The amount of a dividend payment, if any, can vary over time and issuers may reduce dividends paid on securities in the event of a recession or adverse event affecting a specific industry or issuer.
None of the stock information, data, and company information presented herein constitutes a recommendation by Navellier or a solicitation to buy or sell any securities. Any specific securities identified and described do not represent all of the securities purchased, sold, or recommended for advisory clients. The holdings identified do not represent all of the securities purchased, sold, or recommended for advisory clients and the reader should not assume that investments in the securities identified and discussed were or will be profitable.
Information presented is general information that does not take into account your individual circumstances, financial situation, or needs, nor does it present a personalized recommendation to you. Individual stocks presented may not be suitable for every investor. Investment in securities involves significant risk and has the potential for partial or complete loss of funds invested. Investment in fixed income securities has the potential for the investment return and principal value of an investment to fluctuate so that an investor’s holdings, when redeemed, may be worth less than their original cost.
One cannot invest directly in an index. Index is unmanaged and index performance does not reflect deduction of fees, expenses, or taxes. Presentation of Index data does not reflect a belief by Navellier that any stock index constitutes an investment alternative to any Navellier equity strategy or is necessarily comparable to such strategies. Among the most important differences between the Indices and Navellier strategies are that the Navellier equity strategies may (1) incur material management fees, (2) concentrate its investments in relatively few stocks, industries, or sectors, (3) have significantly greater trading activity and related costs, and (4) be significantly more or less volatile than the Indices.
ETF Risk: We may invest in exchange traded funds (“ETFs”) and some of our investment strategies are generally fully invested in ETFs. Like traditional mutual funds, ETFs charge asset-based fees, but they generally do not charge initial sales charges or redemption fees and investors typically pay only customary brokerage fees to buy and sell ETF shares. The fees and costs charged by ETFs held in client accounts will not be deducted from the compensation the client pays Navellier. ETF prices can fluctuate up or down, and a client account could lose money investing in an ETF if the prices of the securities owned by the ETF go down. ETFs are subject to additional risks:
- ETF shares may trade above or below their net asset value;
- An active trading market for an ETF’s shares may not develop or be maintained;
- The value of an ETF may be more volatile than the underlying portfolio of securities the ETF is designed to track;
- The cost of owning shares of the ETF may exceed those a client would incur by directly investing in the underlying securities; and
- Trading of an ETF’s shares may be halted if the listing exchange’s officials deem it appropriate, the shares are delisted from the exchange, or the activation of market-wide “circuit breakers” (which are tied to large decreases in stock prices) halts stock trading generally.
Grader Disclosures: Investment in equity strategies involves substantial risk and has the potential for partial or complete loss of funds invested. The sample portfolio and any accompanying charts are for informational purposes only and are not to be construed as a solicitation to buy or sell any financial instrument and should not be relied upon as the sole factor in an investment making decision. As a matter of normal and important disclosures to you, as a potential investor, please consider the following: The performance presented is not based on any actual securities trading, portfolio, or accounts, and the reported performance of the A, B, C, D, and F portfolios (collectively the “model portfolios”) should be considered mere “paper” or pro forma performance results based on Navellier’s research.
Investors evaluating any of Navellier & Associates, Inc.’s, (or its affiliates’) Investment Products must not use any information presented here, including the performance figures of the model portfolios, in their evaluation of any Navellier Investment Products. Navellier Investment Products include the firm’s mutual funds and managed accounts. The model portfolios, charts, and other information presented do not represent actual funded trades and are not actual funded portfolios. There are material differences between Navellier Investment Products’ portfolios and the model portfolios, research, and performance figures presented here. The model portfolios and the research results (1) may contain stocks or ETFs that are illiquid and difficult to trade; (2) may contain stock or ETF holdings materially different from actual funded Navellier Investment Product portfolios; (3) include the reinvestment of all dividends and other earnings, estimated trading costs, commissions, or management fees; and, (4) may not reflect prices obtained in an actual funded Navellier Investment Product portfolio. For these and other reasons, the reported performances of model portfolios do not reflect the performance results of Navellier’s actually funded and traded Investment Products. In most cases, Navellier’s Investment Products have materially lower performance results than the performances of the model portfolios presented.
This report contains statements that are, or may be considered to be, forward-looking statements. All statements that are not historical facts, including statements about our beliefs or expectations, are “forward-looking statements” within the meaning of The U.S. Private Securities Litigation Reform Act of 1995. These statements may be identified by such forward-looking terminology as “expect,” “estimate,” “plan,” “intend,” “believe,” “anticipate,” “may,” “will,” “should,” “could,” “continue,” “project,” or similar statements or variations of such terms. Our forward-looking statements are based on a series of expectations, assumptions, and projections, are not guarantees of future results or performance, and involve substantial risks and uncertainty as described in Form ADV Part 2A of our filing with the Securities and Exchange Commission (SEC), which is available at www.adviserinfo.sec.gov or by requesting a copy by emailing info@navellier.com. All of our forward-looking statements are as of the date of this report only. We can give no assurance that such expectations or forward-looking statements will prove to be correct. Actual results may differ materially. You are urged to carefully consider all such factors.
FEDERAL TAX ADVICE DISCLAIMER: As required by U.S. Treasury Regulations, you are informed that, to the extent this presentation includes any federal tax advice, the presentation is not written by Navellier to be used, and cannot be used, for the purpose of avoiding federal tax penalties. Navellier does not advise on any income tax requirements or issues. Use of any information presented by Navellier is for general information only and does not represent tax advice either express or implied. You are encouraged to seek professional tax advice for income tax questions and assistance.
IMPORTANT NEWSLETTER DISCLOSURE:The hypothetical performance results for investment newsletters that are authored or edited by Louis Navellier, including Louis Navellier’s Growth Investor, Louis Navellier’s Breakthrough Stocks, Louis Navellier’s Accelerated Profits, and Louis Navellier’s Platinum Club, are not based on any actual securities trading, portfolio, or accounts, and the newsletters’ reported hypothetical performances should be considered mere “paper” or proforma hypothetical performance results and are not actual performance of real world trades. Navellier & Associates, Inc. does not have any relation to or affiliation with the owner of these newsletters. There are material differences between Navellier Investment Products’ portfolios and the InvestorPlace Media, LLC newsletter portfolios authored by Louis Navellier. The InvestorPlace Media, LLC newsletters contain hypothetical performance that do not include transaction costs, advisory fees, or other fees a client might incur if actual investments and trades were being made by an investor. As a result, newsletter performance should not be used to evaluate Navellier Investment services which are separate and different from the newsletters. The owner of the newsletters is InvestorPlace Media, LLC and any questions concerning the newsletters, including any newsletter advertising or hypothetical Newsletter performance claims, (which are calculated solely by Investor Place Media and not Navellier) should be referred to InvestorPlace Media, LLC at (800) 718-8289.
Please note that Navellier & Associates and the Navellier Private Client Group are managed completely independent of the newsletters owned and published by InvestorPlace Media, LLC and written and edited by Louis Navellier, and investment performance of the newsletters should in no way be considered indicative of potential future investment performance for any Navellier & Associates separately managed account portfolio. Potential investors should consult with their financial advisor before investing in any Navellier Investment Product.
Navellier claims compliance with Global Investment Performance Standards (GIPS). To receive a complete list and descriptions of Navellier’s composites and/or a presentation that adheres to the GIPS standards, please contact Navellier or click here. It should not be assumed that any securities recommendations made by Navellier & Associates, Inc. in the future will be profitable or equal the performance of securities made in this report.
FactSet Disclosure: Navellier does not independently calculate the statistical information included in the attached report. The calculation and the information are provided by FactSet, a company not related to Navellier. Although information contained in the report has been obtained from FactSet and is based on sources Navellier believes to be reliable, Navellier does not guarantee its accuracy, and it may be incomplete or condensed. The report and the related FactSet sourced information are provided on an “as is” basis. The user assumes the entire risk of any use made of this information. Investors should consider the report as only a single factor in making their investment decision. The report is for informational purposes only and is not intended as an offer or solicitation for the purchase or sale of a security. FactSet sourced information is the exclusive property of FactSet. Without prior written permission of FactSet, this information may not be reproduced, disseminated or used to create any financial products. All indices are unmanaged and performance of the indices include reinvestment of dividends and interest income, unless otherwise noted, are not illustrative of any particular investment and an investment cannot be made in any index. Past performance is no guarantee of future results.