by Jason Bodner
March 4, 2025
It’s March! Happy New Year – if you were born before 45 B.C.
March was the first month of the year before the Roman calendar was established. These days, March is the third month, and it is also a historically strong month of the year, using our data, beginning in 1990:

Graphs are for illustrative and discussion purposes only. Please read important disclosures at the end of this commentary.
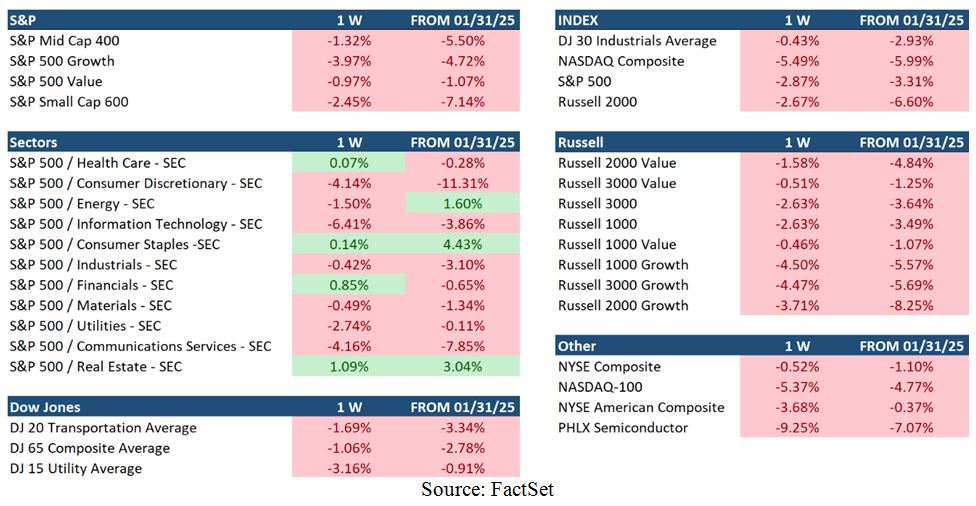
One look at last week and February’s performances shows us nothing to be excited about, from the table below, but that is in contrast to the earnings season for the fourth quarter of 2024, now wrapping up. As of this writing, 97% of the S&P 500 companies have reported. Despite stellar results, February took a dive:
Graphs are for illustrative and discussion purposes only. Please read important disclosures at the end of this commentary.
Looking at the laggards, we notice that small caps and growth sectors are under attack. The S&P Small Cap 600 was down 7.14% in February. Discretionary stocks were down more than 11%. The Russell 2000 Growth is down 8.25%, and semiconductors are getting smoked, down 9.25% in the last week.
Based on that, one might assume it was an abysmal earnings season. But that’s not the case. With 97% of the S&P 500 reporting, approximately 76% beat earnings estimates, and 62% beat sales estimates.
That’s very close to the 5-year and 10-year averages:

Graphs are for illustrative and discussion purposes only. Please read important disclosures at the end of this commentary.
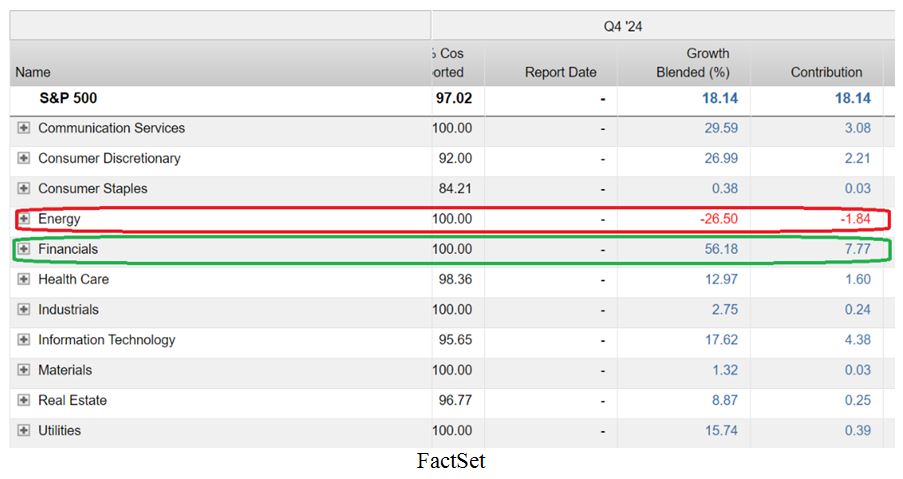
For Q4 2024, the blended year-over-year earnings growth for the S&P 500 is +18.1%. If it stays that way, it will easily mark the highest year-over-year earnings growth rate reported by the index since Q4 2021.
Digging even deeper, we see that 10 of the 11 S&P 500 sectors contributed to earnings growth, led strongly by the Financials (+56%). Only Energy was negative (-26.5%):
Graphs are for illustrative and discussion purposes only. Please read important disclosures at the end of this commentary.
So, maybe all the February red ink is not due to earnings. Could it be valuation concerns? The forward 12-month P/E ratio for the S&P 500 is 22.2, above the 5-year average (19.8) and 10-year average (18.3):

Graphs are for illustrative and discussion purposes only. Please read important disclosures at the end of this commentary.
The trailing 12-month P/E ratio is high as well, but not that high: It hardly seems like a cause for alarm:

Graphs are for illustrative and discussion purposes only. Please read important disclosures at the end of this commentary.
The S&P 500 is only part of the picture. The breadth of the entire market (i.e., stocks going up vs. those going down) has been deteriorating for some time now, so I decided to look back at recent periods and do some comparison in terms of breadth and broad valuation. Here are three conclusions that stood out:
- On November 29th (my birthday), only 35% of stocks (or 1,866 of 5,389 in my database that day) were trading below their 50-day moving average. The average P/E ratio (trailing 12 months) for those 5,389 stocks was 40.5 – substantially higher than the S&P 500. This stands to reason, as many smaller-cap companies are high growth in nature, so they trade at richer multiples.
- On February 19th (the latest market peak day), 5,001-stocks scored in my data. This is fascinating, because the S&P 500 reached an all-time high, yet fewer stocks were scoring. This is due to lower volumes and lower share prices, rendering some stocks ineligible to score. At that point, 46.9% of stocks (or 2,348) were trading below their 50-day moving average, substantially higher than in late November. The average P/E ratio (trailing 12 months), for those 5,001-stocks was 38.3. This means the valuation correction had begun as the major indexes made their highs.
- On February 27th (this year’s market trough day), 4,961-stocks generated a score in my data as the market reached a year-to-date low with even fewer stocks scoring. Again, stocks must have a certain price and average liquidity to even generate a score. At Thursday’s low point, 60.4% of stocks (or 2,997) were trading below their 50-day moving average, which is substantially higher than in late November and February 19th. The average P/E ratio (trailing 12 months), however, for those 4,961-stocks was 35.3. This means a valuation correction of -12.9% has taken place.
This valuation correction is appearing in the S&P sectors too. It is not a bullish sign when discretionary and technology stocks rank near the bottom. To make matters worse, the defensive sectors have pushed their way to the top of the sector strength chart. This is due mainly to their recent technical strength:
![]()
Graphs are for illustrative and discussion purposes only. Please read important disclosures at the end of this commentary.
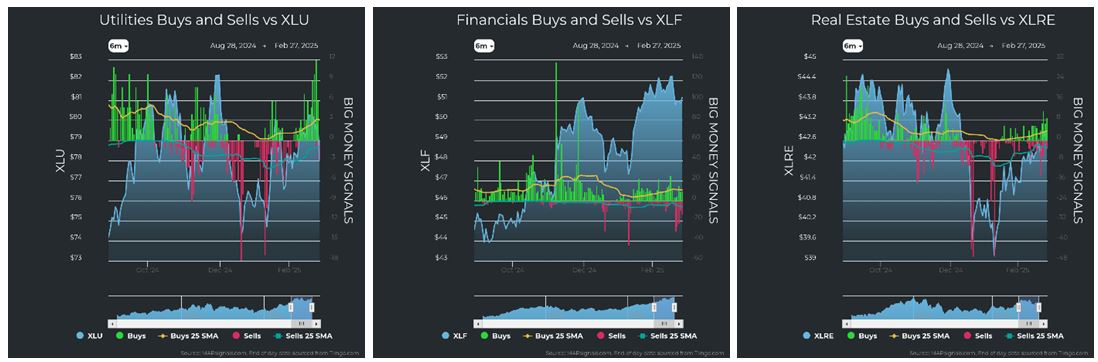
We see strong buying in Utilities stocks, a leading defensive sector. Financial stocks remain strong, Real Estate has been gaining ground and even Staples have seen steady buying:


Graphs are for illustrative and discussion purposes only. Please read important disclosures at the end of this commentary.
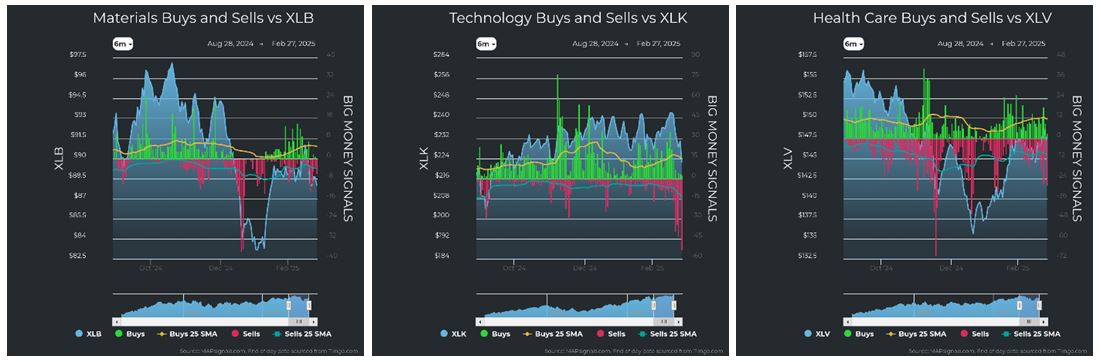
All the while, technology and discretionary stocks have seen selling. This highlights a rotation out of growth and strength into the more defensive sectors, or what is better known as a “flight to safety.”
Looking again at the sector strength and weakness chart above, we see divergence between technical and fundamental scores. For example, the technical score for utilities is 69% while it’s fundamental score is 53.6%. Contrast that with technology’s technical score of 47.7 and fundamental score of 60.4%.
That’s a flip-flop from a growth scenario.
This rotation is pressuring the Big Money Index (BMI). The BMI fell from 63.2 on February 19th to 53.8% on February 27th in just six trading sessions – during an excellent earnings reporting season:
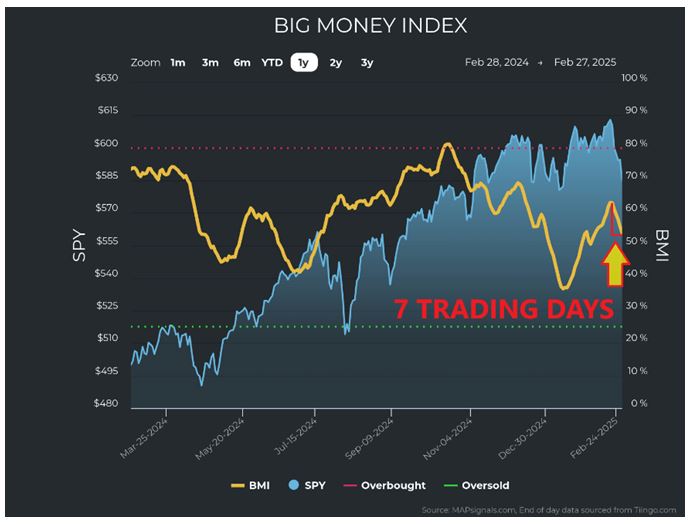
Graphs are for illustrative and discussion purposes only. Please read important disclosures at the end of this commentary.
Looking at unusual inflows and outflows in stocks and ETFs, we see a sudden change in sentiment:

Graphs are for illustrative and discussion purposes only. Please read important disclosures at the end of this commentary.
Suddenly, unusual inflows dropped while outflows increased. They have increased so much that I decided to seek out any historical analogs. Currently, the 5-day average outflows count is well over 100 (at 171). This gives us a 5-day average ratio of 25.4%, meaning only 25.4% of all signals over the last 5-days on average were inflows. That is getting close to extreme selling but not quite there:

Graphs are for illustrative and discussion purposes only. Please read important disclosures at the end of this commentary.
I looked at all similar instances using the following parameters: 5-day ratio average of 40% or less with a minimum 100 5-day average outflow count. I found 626 instances like this since 1990.
As often happens in such historical surveys, the forward returns were solid:

Graphs are for illustrative and discussion purposes only. Please read important disclosures at the end of this commentary.
The bottom line is that market sentiment is low. One contributing factor is that consumer spending is slowing. The latest data has further pressured equities. Let’s not forget, though, that the weather has been harsh across much of the country, which affects consumer spending.
As earnings season wanes, short selling and shenanigans pick up until the next earnings reports. But therein lies the key: Earnings are working very well. There is fear that growth may cool, and some even fear Trump’s administration will nudge us into recession. But that recession fear is always there.
In the end, the best defense is a great offense. Identify the best quality stocks with the highest fundamentals and big inflows. They are the ones that historically weather the storm.
You never know whether the storm may continue intensifying, or the clouds may part next week. Either way, stay the course with great stocks through any weather:
“Climate is what we expect, weather is what we get.” -Mark Twain
All content above represents the opinion of Jason Bodner of Navellier & Associates, Inc.
Also In This Issue
A Look Ahead by Louis Navellier
The Blow-up in Washington – and its Likely Repercussions
Income Mail by Bryan Perry
The Fed May Cut Rates Sooner Than Expected–to Deal with a Tighter Job Market
Growth Mail by Gary Alexander
March in Market History – and Some Great March 4th Inauguration Messages
Global Mail by Ivan Martchev
The Bond Market Is Beginning to Worry (a Little) About the Economy
Sector Spotlight by Jason Bodner
March – A New Month That is Almost Like a New Year!
View Full Archive
Read Past Issues Here

Jason Bodner
MARKETMAIL EDITOR FOR SECTOR SPOTLIGHT
Jason Bodner writes Sector Spotlight in the weekly Marketmail publication and has authored several white papers for the company. He is also Co-Founder of Macro Analytics for Professionals which produces proprietary equity accumulation and distribution research for its clients. Previously, Mr. Bodner served as Director of European Equity Derivatives for Cantor Fitzgerald Europe in London, then moved to the role of Head of Equity Derivatives North America for the same company in New York. He also served as S.V.P. Equity Derivatives for Jefferies, LLC. He received a B.S. in business administration in 1996, with honors, from Skidmore College as a member of the Periclean Honors Society. All content of “Sector Spotlight” represents the opinion of Jason Bodner
Important Disclosures:
Jason Bodner is a co-founder and co-owner of Mapsignals. Mr. Bodner is an independent contractor who is occasionally hired by Navellier & Associates to write an article and or provide opinions for possible use in articles that appear in Navellier & Associates weekly Market Mail. Mr. Bodner is not employed or affiliated with Louis Navellier, Navellier & Associates, Inc., or any other Navellier owned entity. The opinions and statements made here are those of Mr. Bodner and not necessarily those of any other persons or entities. This is not an endorsement, or solicitation or testimonial or investment advice regarding the BMI Index or any statements or recommendations or analysis in the article or the BMI Index or Mapsignals or its products or strategies.
Although information in these reports has been obtained from and is based upon sources that Navellier believes to be reliable, Navellier does not guarantee its accuracy and it may be incomplete or condensed. All opinions and estimates constitute Navellier’s judgment as of the date the report was created and are subject to change without notice. These reports are for informational purposes only and are not a solicitation for the purchase or sale of a security. Any decision to purchase securities mentioned in these reports must take into account existing public information on such securities or any registered prospectus.To the extent permitted by law, neither Navellier & Associates, Inc., nor any of its affiliates, agents, or service providers assumes any liability or responsibility nor owes any duty of care for any consequences of any person acting or refraining to act in reliance on the information contained in this communication or for any decision based on it.
Past performance is no indication of future results. Investment in securities involves significant risk and has the potential for partial or complete loss of funds invested. It should not be assumed that any securities recommendations made by Navellier. in the future will be profitable or equal the performance of securities made in this report. Dividend payments are not guaranteed. The amount of a dividend payment, if any, can vary over time and issuers may reduce dividends paid on securities in the event of a recession or adverse event affecting a specific industry or issuer.
None of the stock information, data, and company information presented herein constitutes a recommendation by Navellier or a solicitation to buy or sell any securities. Any specific securities identified and described do not represent all of the securities purchased, sold, or recommended for advisory clients. The holdings identified do not represent all of the securities purchased, sold, or recommended for advisory clients and the reader should not assume that investments in the securities identified and discussed were or will be profitable.
Information presented is general information that does not take into account your individual circumstances, financial situation, or needs, nor does it present a personalized recommendation to you. Individual stocks presented may not be suitable for every investor. Investment in securities involves significant risk and has the potential for partial or complete loss of funds invested. Investment in fixed income securities has the potential for the investment return and principal value of an investment to fluctuate so that an investor’s holdings, when redeemed, may be worth less than their original cost.
One cannot invest directly in an index. Index is unmanaged and index performance does not reflect deduction of fees, expenses, or taxes. Presentation of Index data does not reflect a belief by Navellier that any stock index constitutes an investment alternative to any Navellier equity strategy or is necessarily comparable to such strategies. Among the most important differences between the Indices and Navellier strategies are that the Navellier equity strategies may (1) incur material management fees, (2) concentrate its investments in relatively few stocks, industries, or sectors, (3) have significantly greater trading activity and related costs, and (4) be significantly more or less volatile than the Indices.
ETF Risk: We may invest in exchange traded funds (“ETFs”) and some of our investment strategies are generally fully invested in ETFs. Like traditional mutual funds, ETFs charge asset-based fees, but they generally do not charge initial sales charges or redemption fees and investors typically pay only customary brokerage fees to buy and sell ETF shares. The fees and costs charged by ETFs held in client accounts will not be deducted from the compensation the client pays Navellier. ETF prices can fluctuate up or down, and a client account could lose money investing in an ETF if the prices of the securities owned by the ETF go down. ETFs are subject to additional risks:
- ETF shares may trade above or below their net asset value;
- An active trading market for an ETF’s shares may not develop or be maintained;
- The value of an ETF may be more volatile than the underlying portfolio of securities the ETF is designed to track;
- The cost of owning shares of the ETF may exceed those a client would incur by directly investing in the underlying securities and;
- Trading of an ETF’s shares may be halted if the listing exchange’s officials deem it appropriate, the shares are delisted from the exchange, or the activation of market-wide “circuit breakers” (which are tied to large decreases in stock prices) halts stock trading generally.
Grader Disclosures: Investment in equity strategies involves substantial risk and has the potential for partial or complete loss of funds invested. The sample portfolio and any accompanying charts are for informational purposes only and are not to be construed as a solicitation to buy or sell any financial instrument and should not be relied upon as the sole factor in an investment making decision. As a matter of normal and important disclosures to you, as a potential investor, please consider the following: The performance presented is not based on any actual securities trading, portfolio, or accounts, and the reported performance of the A, B, C, D, and F portfolios (collectively the “model portfolios”) should be considered mere “paper” or pro forma performance results based on Navellier’s research.
Investors evaluating any of Navellier & Associates, Inc.’s, (or its affiliates’) Investment Products must not use any information presented here, including the performance figures of the model portfolios, in their evaluation of any Navellier Investment Products. Navellier Investment Products include the firm’s mutual funds and managed accounts. The model portfolios, charts, and other information presented do not represent actual funded trades and are not actual funded portfolios. There are material differences between Navellier Investment Products’ portfolios and the model portfolios, research, and performance figures presented here. The model portfolios and the research results (1) may contain stocks or ETFs that are illiquid and difficult to trade; (2) may contain stock or ETF holdings materially different from actual funded Navellier Investment Product portfolios; (3) include the reinvestment of all dividends and other earnings, estimated trading costs, commissions, or management fees; and, (4) may not reflect prices obtained in an actual funded Navellier Investment Product portfolio. For these and other reasons, the reported performances of model portfolios do not reflect the performance results of Navellier’s actually funded and traded Investment Products. In most cases, Navellier’s Investment Products have materially lower performance results than the performances of the model portfolios presented.
This report contains statements that are, or may be considered to be, forward-looking statements. All statements that are not historical facts, including statements about our beliefs or expectations, are “forward-looking statements” within the meaning of The U.S. Private Securities Litigation Reform Act of 1995. These statements may be identified by such forward-looking terminology as “expect,” “estimate,” “plan,” “intend,” “believe,” “anticipate,” “may,” “will,” “should,” “could,” “continue,” “project,” or similar statements or variations of such terms. Our forward-looking statements are based on a series of expectations, assumptions, and projections, are not guarantees of future results or performance, and involve substantial risks and uncertainty as described in Form ADV Part 2A of our filing with the Securities and Exchange Commission (SEC), which is available at www.adviserinfo.sec.gov or by requesting a copy by emailing info@navellier.com. All of our forward-looking statements are as of the date of this report only. We can give no assurance that such expectations or forward-looking statements will prove to be correct. Actual results may differ materially. You are urged to carefully consider all such factors.
FEDERAL TAX ADVICE DISCLAIMER: As required by U.S. Treasury Regulations, you are informed that, to the extent this presentation includes any federal tax advice, the presentation is not written by Navellier to be used, and cannot be used, for the purpose of avoiding federal tax penalties. Navellier does not advise on any income tax requirements or issues. Use of any information presented by Navellier is for general information only and does not represent tax advice either express or implied. You are encouraged to seek professional tax advice for income tax questions and assistance.
IMPORTANT NEWSLETTER DISCLOSURE:The hypothetical performance results for investment newsletters that are authored or edited by Louis Navellier, including Louis Navellier’s Growth Investor, Louis Navellier’s Breakthrough Stocks, Louis Navellier’s Accelerated Profits, and Louis Navellier’s Platinum Club, are not based on any actual securities trading, portfolio, or accounts, and the newsletters’ reported hypothetical performances should be considered mere “paper” or proforma hypothetical performance results and are not actual performance of real world trades. Navellier & Associates, Inc. does not have any relation to or affiliation with the owner of these newsletters. There are material differences between Navellier Investment Products’ portfolios and the InvestorPlace Media, LLC newsletter portfolios authored by Louis Navellier. The InvestorPlace Media, LLC newsletters contain hypothetical performance that do not include transaction costs, advisory fees, or other fees a client might incur if actual investments and trades were being made by an investor. As a result, newsletter performance should not be used to evaluate Navellier Investment services which are separate and different from the newsletters. The owner of the newsletters is InvestorPlace Media, LLC and any questions concerning the newsletters, including any newsletter advertising or hypothetical Newsletter performance claims, (which are calculated solely by Investor Place Media and not Navellier) should be referred to InvestorPlace Media, LLC at (800) 718-8289.
Please note that Navellier & Associates and the Navellier Private Client Group are managed completely independent of the newsletters owned and published by InvestorPlace Media, LLC and written and edited by Louis Navellier, and investment performance of the newsletters should in no way be considered indicative of potential future investment performance for any Navellier & Associates separately managed account portfolio. Potential investors should consult with their financial advisor before investing in any Navellier Investment Product.
Navellier claims compliance with Global Investment Performance Standards (GIPS). To receive a complete list and descriptions of Navellier’s composites and/or a presentation that adheres to the GIPS standards, please contact Navellier or click here. It should not be assumed that any securities recommendations made by Navellier & Associates, Inc. in the future will be profitable or equal the performance of securities made in this report.
FactSet Disclosure: Navellier does not independently calculate the statistical information included in the attached report. The calculation and the information are provided by FactSet, a company not related to Navellier. Although information contained in the report has been obtained from FactSet and is based on sources Navellier believes to be reliable, Navellier does not guarantee its accuracy, and it may be incomplete or condensed. The report and the related FactSet sourced information are provided on an “as is” basis. The user assumes the entire risk of any use made of this information. Investors should consider the report as only a single factor in making their investment decision. The report is for informational purposes only and is not intended as an offer or solicitation for the purchase or sale of a security. FactSet sourced information is the exclusive property of FactSet. Without prior written permission of FactSet, this information may not be reproduced, disseminated or used to create any financial products. All indices are unmanaged and performance of the indices include reinvestment of dividends and interest income, unless otherwise noted, are not illustrative of any particular investment and an investment cannot be made in any index. Past performance is no guarantee of future results.