by Jason Bodner
March 31, 2026
People are always looking for confirmation. We trust online ratings before buying a $2-product. We notice what cars others drive. We feel stronger when we move with the crowd. It’s part of our basic wiring.
In the famous conformity experiments by Solomon Asch, people knowingly gave wrong answers to simple questions just to match the group. At times, over 70% conformed to a knowingly wrong answer at least once – proof that people will ignore what they clearly see – just to stay aligned with the crowd.
That same instinct carries into the stock market and the world of investing. Most investors aren’t driven by conviction. They’re driven by comfort zones. They want an excuse to act, or an excuse to do nothing.
When markets drift higher, everything feels fine. Money flows automatically into 401(k)s as people buy on schedule, without thought. That steady participation smooths things out. It’s the market’s default state.
But when volatility returns, mass psychology shifts. As stocks run higher, investors feel rising pressure to act. In rising markets, the fear of missing out (FOMO) creeps in. Prices feel expensive, but people still want to buy now, because everyone else is making money. That’s usually when the buying risk is highest.
On the down-side, when markets fall hard, fear takes over. Investors start asking how much worse it can get. They worry about losing years of savings. The instinct is to pull back, to head for the exits.
History shows those are often the worst moments to sell – and the best moments to buy.
But here’s the reality: Most investors don’t do either one. They don’t buy near the top, and they don’t sell near the bottom. They don’t act in between, either. They stay put – because that’s where the crowd is.
I call his “the neighbor test.” When markets are hot, my neighbors ask me if they should buy stock names that have already run higher. They feel late, uneasy, but still tempted. Most of the time, they don’t act.
When markets are falling, they ask me how bad it will get. I ask them one thing: Did you sell anything?
The answer is almost invariably “no.”
So, if most people aren’t actually trading on fear or greed, what’s driving these big day-to-day moves?
It’s the professionals! Money managers, hedge funds and big traders are moving stocks. They act because their job is to outperform market benchmarks. They tend to push prices higher, then sell into strength. They also drive prices lower, then buy them back from weak hands. Algorithms amplify these swings.
Meanwhile, the steady inflows from everyday investors act like ballast, stabilizing the market. When that flow slows during periods of fear, volatility rises. Without that constant bid, prices move more violently.
This volatility feeds emotion. And emotion feeds the narrative.
One-week, we see AI disruption crushing software. The next week, it’s geopolitics. Then it’s oil, inflation, or recession fears. The headlines shift, but the effect is the same. Sentiment drops, and stocks follow.
Now we’re back in that environment. Stocks are falling again, so confidence is fading.
But context matters. When everything feels chaotic, I step back and let the data do the talking. First, this is a mid-term election year, historically the weakest year in the four-year cycle. Volatility is not unusual.
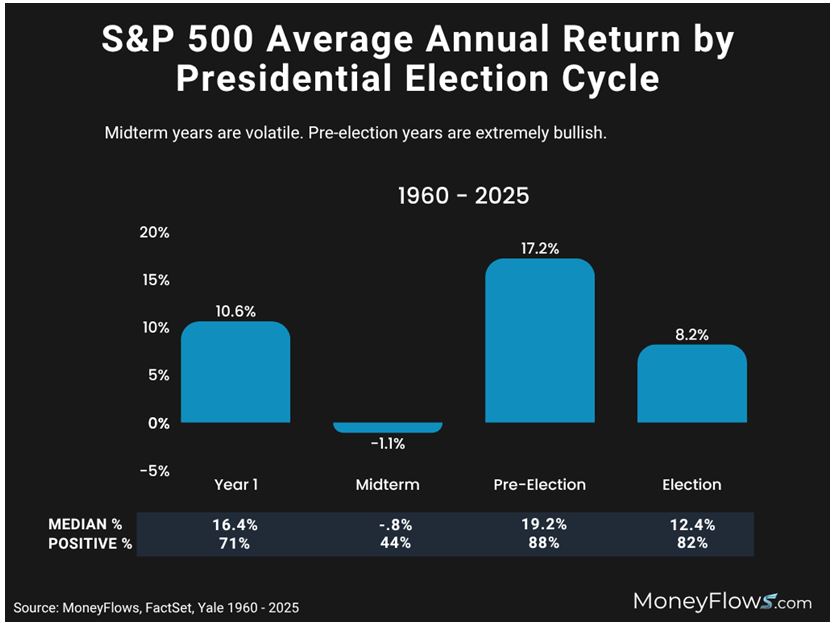
Graphs are for illustrative and discussion purposes only. Please read important disclosures at the end of this commentary.
In mid-term election years, Quarters 2 and 3 are typically the weakest. Then, the fourth-quarter surges:
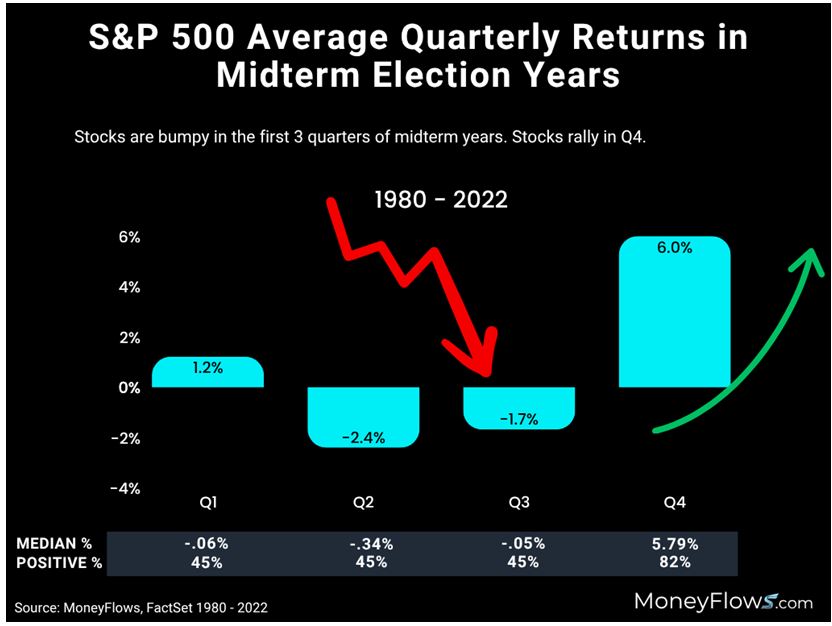
Graphs are for illustrative and discussion purposes only. Please read important disclosures at the end of this commentary.
At 44%, the Big Money Index (BMI) reflects this change. It is falling and now sits at its lowest level since last April’s “Liberation Day” sell-off. On April 8, 2025, the BMI bottomed at 35.4%. Based on the current pace, we could revisit that level as early as this Friday, but more likely next week, April 6 to 10.
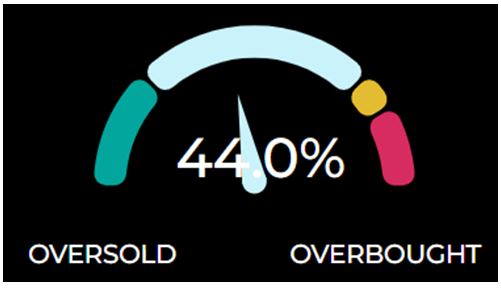
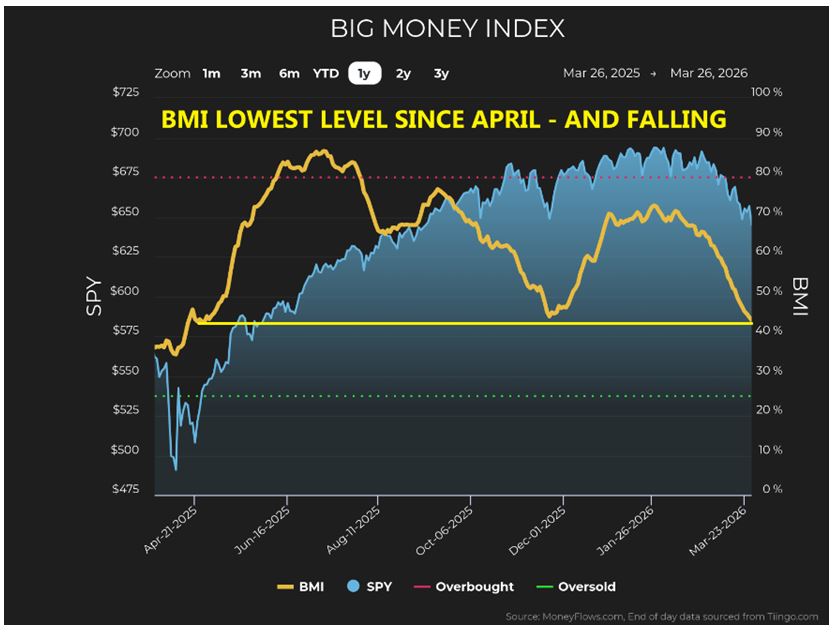
Graphs are for illustrative and discussion purposes only. Please read important disclosures at the end of this commentary.
At 35%, the market would be getting oversold. At 25%, it would be extremely oversold. That 25% level is rare, showing up just 23-times in the last 36-years, or about once every19-months. The last instance was in October 2023, nearly 29-months ago. By that measure alone, we are overdue to become oversold.
Our data suggests that kind of extreme (BMI at 25%) could arrive on or around April 22.
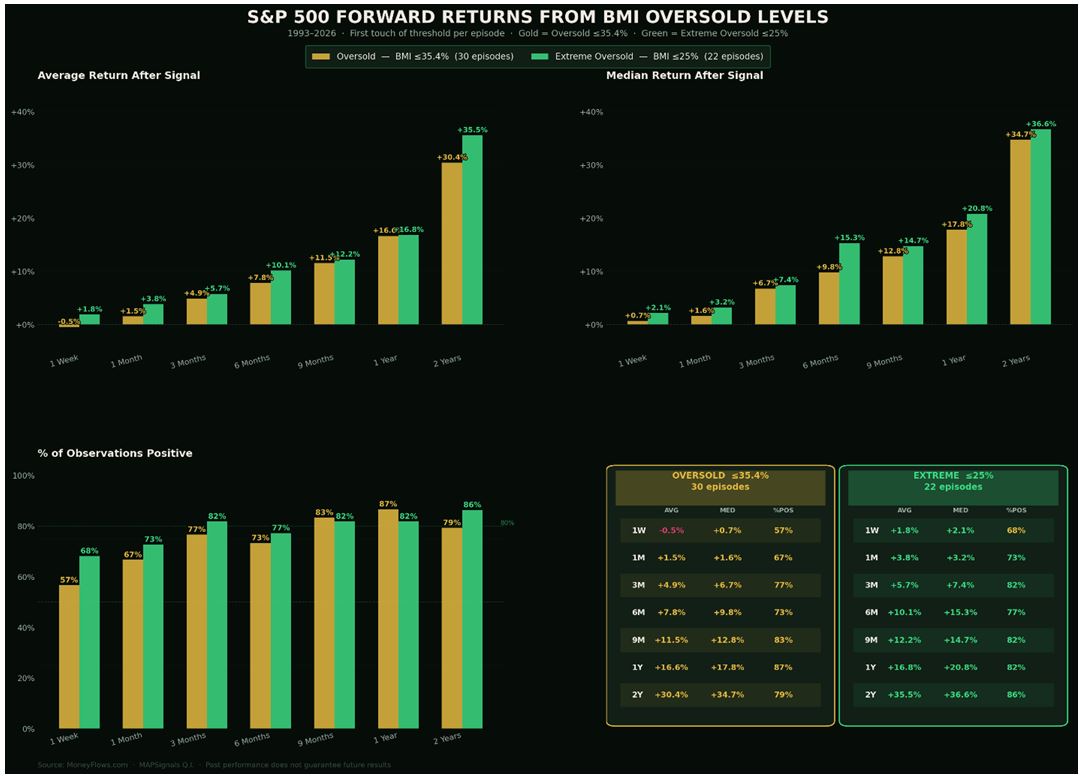
Here is what history says: After lows near 35%, about 57% of outcomes are positive, but the bottom is not always set immediately. From one-month forward, results improve. One-year later, 87% of historic cases are higher, with a median gain of 18%. Two-years out, the median return climbs into the mid-30% range.
At a 25% BMI or below (extremely oversold), the signal sharpens. Even one-week out, nearly 70% of past outcomes are positive. Six-months later, returns are materially stronger than at the 35% level. Two-years out, roughly 86% of cases are higher, with similar long-term gains but much cleaner entry-points.
Graphs are for illustrative and discussion purposes only. Please read important disclosures at the end of this commentary.
The key difference is timing. The 35% level can come early in a draw-down, while the 25% level tends to align much closer to the actual bottom. Here is what a few recent extreme oversold instances look like:
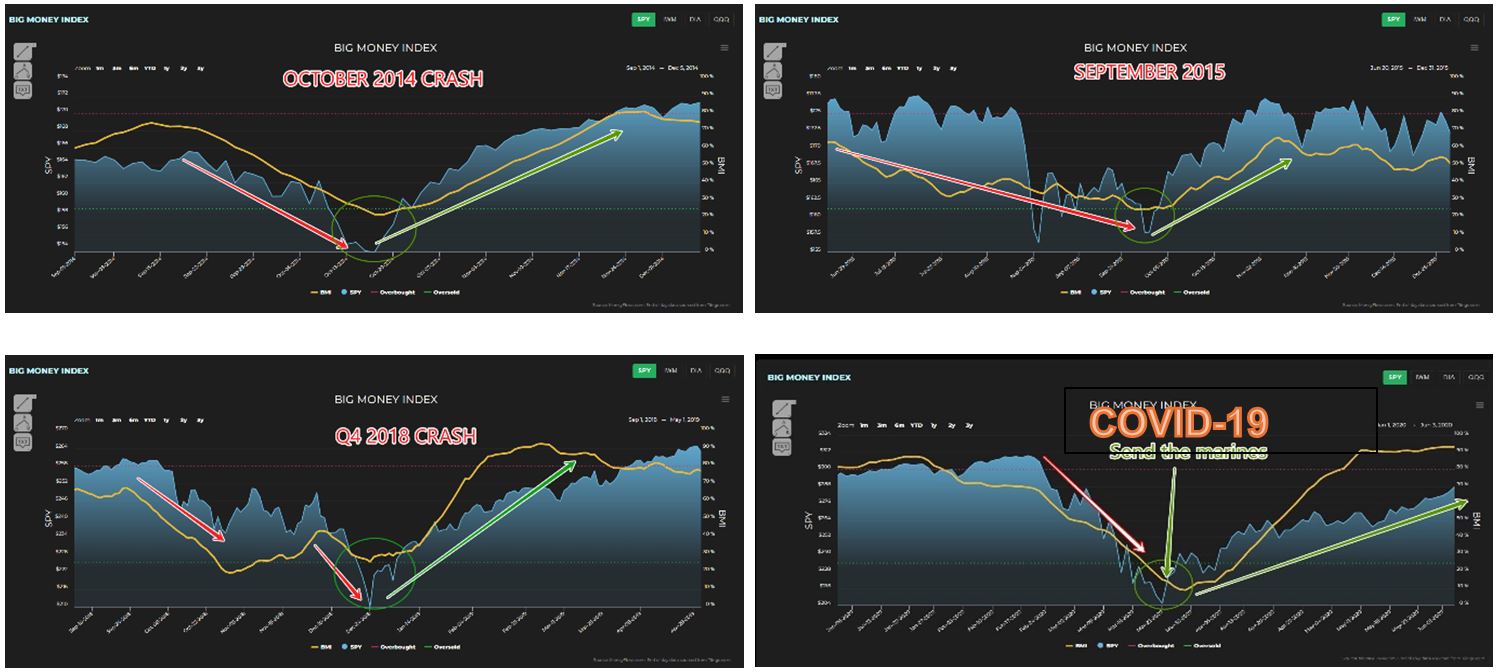
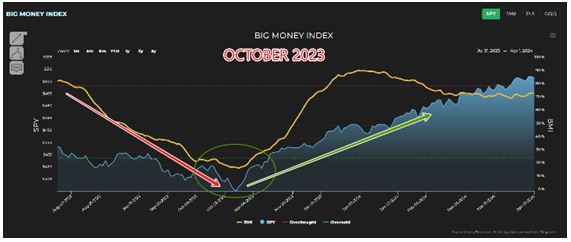
Graphs are for illustrative and discussion purposes only. Please read important disclosures at the end of this commentary.
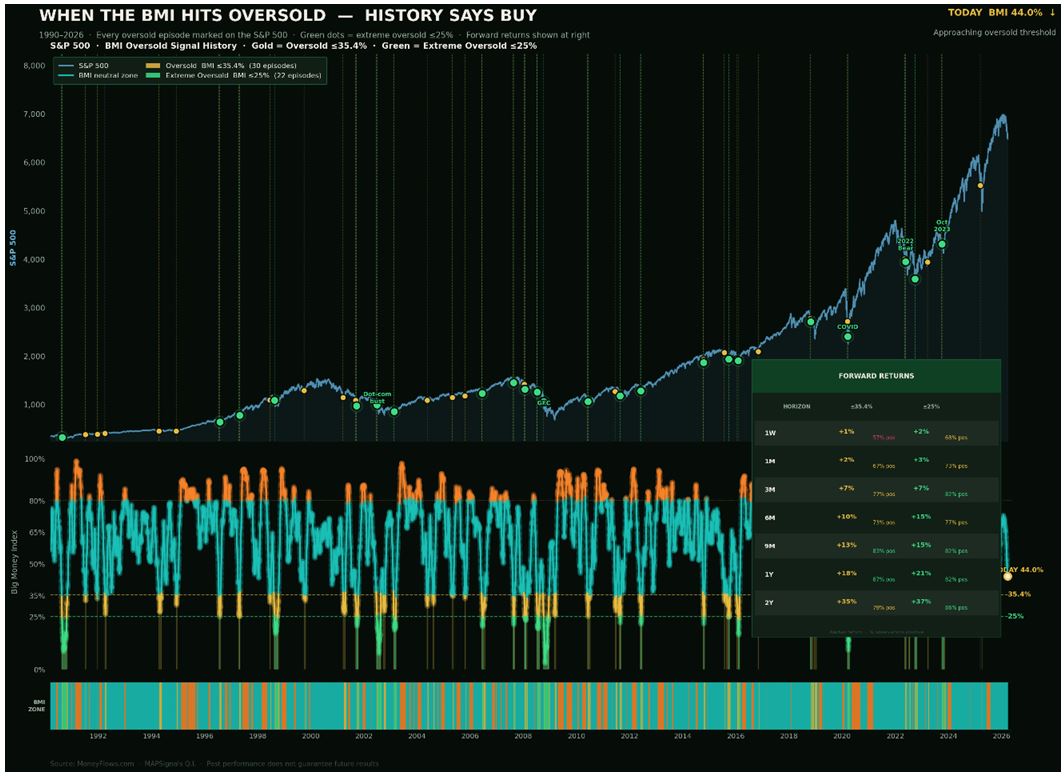
Just in case I am not being clear enough, every gold and green-dot below marks a moment the BMI hit oversold: In the dot-com bust (2000), Great Financial Crisis (2008), COVID (2020), 2022, October 2023.
Every single one sits below where the market was a year later. The inset shows the forward returns.
The headline below says it all: “When the BMI hits oversold, history says buy.”
Graphs are for illustrative and discussion purposes only. Please read important disclosures at the end of this commentary.
The take-away is simple. If the BMI hits 35%, start building some positions and expect some volatility. If it pushes toward 25%, history suggests you buy more. But this would also be a time when markets feel the worst. When the headlines are loudest, when volatility spikes, when everything pushes you toward selling, that is often when opportunity is forming. We are in such a cycle now.
The data points to a window between early April and April 22, with the latter lining up as a potential low.
It will feel wrong to buy into such a market, but if this is wrong, I don’t want to be right.
Look at broad exposure through the SPDR S&P 500 ETF Trust, Invesco QQQ Trust, or iShares Russell 2000 ETF. Or focus on high quality companies with strong fundamentals but where prices are down.
The crowd will always react, when discipline matters most. Our edge comes from not being emotional.
“Markets reward discipline, not emotion. The time of maximum pessimism is the best time to buy.”
— John Templeton
Wise Words!
All content above represents the opinion of Jason Bodner of Navellier & Associates, Inc.
Also In This Issue
A Look Ahead by Louis Navellier
Outlook for the Energy Sector in April
Income Mail by Bryan Perry
What’s Working, When the Market Is Not?
Growth Mail by Gary Alexander
When Spring Feels Like More Winter
Global Mail by Ivan Martchev
One Cannot Print (or Tweet) Crude Oil
Sector Spotlight by Jason Bodner
Never Underestimate the Power of the Crowd
View Full Archive
Read Past Issues Here

Jason Bodner
MARKETMAIL EDITOR FOR SECTOR SPOTLIGHT
Jason Bodner writes Sector Spotlight in the weekly Marketmail publication and has authored several white papers for the company. He is also Co-Founder of Macro Analytics for Professionals which produces proprietary equity accumulation and distribution research for its clients. Previously, Mr. Bodner served as Director of European Equity Derivatives for Cantor Fitzgerald Europe in London, then moved to the role of Head of Equity Derivatives North America for the same company in New York. He also served as S.V.P. Equity Derivatives for Jefferies, LLC. He received a B.S. in business administration in 1996, with honors, from Skidmore College as a member of the Periclean Honors Society. All content of “Sector Spotlight” represents the opinion of Jason Bodner
Important Disclosures:
Jason Bodner is a co-founder and co-owner of Mapsignals. Mr. Bodner is an independent contractor who is occasionally hired by Navellier & Associates to write an article and or provide opinions for possible use in articles that appear in Navellier & Associates weekly Market Mail. Mr. Bodner is not employed or affiliated with Louis Navellier, Navellier & Associates, Inc., or any other Navellier owned entity. The opinions and statements made here are those of Mr. Bodner and not necessarily those of any other persons or entities. This is not an endorsement, or solicitation or testimonial or investment advice regarding the BMI Index or any statements or recommendations or analysis in the article or the BMI Index or Mapsignals or its products or strategies.
Although information in these reports has been obtained from and is based upon sources that Navellier believes to be reliable, Navellier does not guarantee its accuracy and it may be incomplete or condensed. All opinions and estimates constitute Navellier’s judgment as of the date the report was created and are subject to change without notice. These reports are for informational purposes only and are not a solicitation for the purchase or sale of a security. Any decision to purchase securities mentioned in these reports must take into account existing public information on such securities or any registered prospectus.To the extent permitted by law, neither Navellier & Associates, Inc., nor any of its affiliates, agents, or service providers assumes any liability or responsibility nor owes any duty of care for any consequences of any person acting or refraining to act in reliance on the information contained in this communication or for any decision based on it.
Past performance is no indication of future results. Investment in securities involves significant risk and has the potential for partial or complete loss of funds invested. It should not be assumed that any securities recommendations made by Navellier. in the future will be profitable or equal the performance of securities made in this report. Dividend payments are not guaranteed. The amount of a dividend payment, if any, can vary over time and issuers may reduce dividends paid on securities in the event of a recession or adverse event affecting a specific industry or issuer.
None of the stock information, data, and company information presented herein constitutes a recommendation by Navellier or a solicitation to buy or sell any securities. Any specific securities identified and described do not represent all of the securities purchased, sold, or recommended for advisory clients. The holdings identified do not represent all of the securities purchased, sold, or recommended for advisory clients and the reader should not assume that investments in the securities identified and discussed were or will be profitable.
Information presented is general information that does not take into account your individual circumstances, financial situation, or needs, nor does it present a personalized recommendation to you. Individual stocks presented may not be suitable for every investor. Investment in securities involves significant risk and has the potential for partial or complete loss of funds invested. Investment in fixed income securities has the potential for the investment return and principal value of an investment to fluctuate so that an investor’s holdings, when redeemed, may be worth less than their original cost.
One cannot invest directly in an index. Index is unmanaged and index performance does not reflect deduction of fees, expenses, or taxes. Presentation of Index data does not reflect a belief by Navellier that any stock index constitutes an investment alternative to any Navellier equity strategy or is necessarily comparable to such strategies. Among the most important differences between the Indices and Navellier strategies are that the Navellier equity strategies may (1) incur material management fees, (2) concentrate its investments in relatively few stocks, industries, or sectors, (3) have significantly greater trading activity and related costs, and (4) be significantly more or less volatile than the Indices.
ETF Risk: We may invest in exchange traded funds (“ETFs”) and some of our investment strategies are generally fully invested in ETFs. Like traditional mutual funds, ETFs charge asset-based fees, but they generally do not charge initial sales charges or redemption fees and investors typically pay only customary brokerage fees to buy and sell ETF shares. The fees and costs charged by ETFs held in client accounts will not be deducted from the compensation the client pays Navellier. ETF prices can fluctuate up or down, and a client account could lose money investing in an ETF if the prices of the securities owned by the ETF go down. ETFs are subject to additional risks:
- ETF shares may trade above or below their net asset value;
- An active trading market for an ETF’s shares may not develop or be maintained;
- The value of an ETF may be more volatile than the underlying portfolio of securities the ETF is designed to track;
- The cost of owning shares of the ETF may exceed those a client would incur by directly investing in the underlying securities and;
- Trading of an ETF’s shares may be halted if the listing exchange’s officials deem it appropriate, the shares are delisted from the exchange, or the activation of market-wide “circuit breakers” (which are tied to large decreases in stock prices) halts stock trading generally.
Grader Disclosures: Investment in equity strategies involves substantial risk and has the potential for partial or complete loss of funds invested. The sample portfolio and any accompanying charts are for informational purposes only and are not to be construed as a solicitation to buy or sell any financial instrument and should not be relied upon as the sole factor in an investment making decision. As a matter of normal and important disclosures to you, as a potential investor, please consider the following: The performance presented is not based on any actual securities trading, portfolio, or accounts, and the reported performance of the A, B, C, D, and F portfolios (collectively the “model portfolios”) should be considered mere “paper” or pro forma performance results based on Navellier’s research.
Investors evaluating any of Navellier & Associates, Inc.’s, (or its affiliates’) Investment Products must not use any information presented here, including the performance figures of the model portfolios, in their evaluation of any Navellier Investment Products. Navellier Investment Products include the firm’s mutual funds and managed accounts. The model portfolios, charts, and other information presented do not represent actual funded trades and are not actual funded portfolios. There are material differences between Navellier Investment Products’ portfolios and the model portfolios, research, and performance figures presented here. The model portfolios and the research results (1) may contain stocks or ETFs that are illiquid and difficult to trade; (2) may contain stock or ETF holdings materially different from actual funded Navellier Investment Product portfolios; (3) include the reinvestment of all dividends and other earnings, estimated trading costs, commissions, or management fees; and, (4) may not reflect prices obtained in an actual funded Navellier Investment Product portfolio. For these and other reasons, the reported performances of model portfolios do not reflect the performance results of Navellier’s actually funded and traded Investment Products. In most cases, Navellier’s Investment Products have materially lower performance results than the performances of the model portfolios presented.
This report contains statements that are, or may be considered to be, forward-looking statements. All statements that are not historical facts, including statements about our beliefs or expectations, are “forward-looking statements” within the meaning of The U.S. Private Securities Litigation Reform Act of 1995. These statements may be identified by such forward-looking terminology as “expect,” “estimate,” “plan,” “intend,” “believe,” “anticipate,” “may,” “will,” “should,” “could,” “continue,” “project,” or similar statements or variations of such terms. Our forward-looking statements are based on a series of expectations, assumptions, and projections, are not guarantees of future results or performance, and involve substantial risks and uncertainty as described in Form ADV Part 2A of our filing with the Securities and Exchange Commission (SEC), which is available at www.adviserinfo.sec.gov or by requesting a copy by emailing info@navellier.com. All of our forward-looking statements are as of the date of this report only. We can give no assurance that such expectations or forward-looking statements will prove to be correct. Actual results may differ materially. You are urged to carefully consider all such factors.
FEDERAL TAX ADVICE DISCLAIMER: As required by U.S. Treasury Regulations, you are informed that, to the extent this presentation includes any federal tax advice, the presentation is not written by Navellier to be used, and cannot be used, for the purpose of avoiding federal tax penalties. Navellier does not advise on any income tax requirements or issues. Use of any information presented by Navellier is for general information only and does not represent tax advice either express or implied. You are encouraged to seek professional tax advice for income tax questions and assistance.
IMPORTANT NEWSLETTER DISCLOSURE:The hypothetical performance results for investment newsletters that are authored or edited by Louis Navellier, including Louis Navellier’s Growth Investor, Louis Navellier’s Breakthrough Stocks, Louis Navellier’s Accelerated Profits, and Louis Navellier’s Platinum Club, are not based on any actual securities trading, portfolio, or accounts, and the newsletters’ reported hypothetical performances should be considered mere “paper” or proforma hypothetical performance results and are not actual performance of real world trades. Navellier & Associates, Inc. does not have any relation to or affiliation with the owner of these newsletters. There are material differences between Navellier Investment Products’ portfolios and the InvestorPlace Media, LLC newsletter portfolios authored by Louis Navellier. The InvestorPlace Media, LLC newsletters contain hypothetical performance that do not include transaction costs, advisory fees, or other fees a client might incur if actual investments and trades were being made by an investor. As a result, newsletter performance should not be used to evaluate Navellier Investment services which are separate and different from the newsletters. The owner of the newsletters is InvestorPlace Media, LLC and any questions concerning the newsletters, including any newsletter advertising or hypothetical Newsletter performance claims, (which are calculated solely by Investor Place Media and not Navellier) should be referred to InvestorPlace Media, LLC at (800) 718-8289.
Please note that Navellier & Associates and the Navellier Private Client Group are managed completely independent of the newsletters owned and published by InvestorPlace Media, LLC and written and edited by Louis Navellier, and investment performance of the newsletters should in no way be considered indicative of potential future investment performance for any Navellier & Associates separately managed account portfolio. Potential investors should consult with their financial advisor before investing in any Navellier Investment Product.
Navellier claims compliance with Global Investment Performance Standards (GIPS). To receive a complete list and descriptions of Navellier’s composites and/or a presentation that adheres to the GIPS standards, please contact Navellier or click here. It should not be assumed that any securities recommendations made by Navellier & Associates, Inc. in the future will be profitable or equal the performance of securities made in this report.
FactSet Disclosure: Navellier does not independently calculate the statistical information included in the attached report. The calculation and the information are provided by FactSet, a company not related to Navellier. Although information contained in the report has been obtained from FactSet and is based on sources Navellier believes to be reliable, Navellier does not guarantee its accuracy, and it may be incomplete or condensed. The report and the related FactSet sourced information are provided on an “as is” basis. The user assumes the entire risk of any use made of this information. Investors should consider the report as only a single factor in making their investment decision. The report is for informational purposes only and is not intended as an offer or solicitation for the purchase or sale of a security. FactSet sourced information is the exclusive property of FactSet. Without prior written permission of FactSet, this information may not be reproduced, disseminated or used to create any financial products. All indices are unmanaged and performance of the indices include reinvestment of dividends and interest income, unless otherwise noted, are not illustrative of any particular investment and an investment cannot be made in any index. Past performance is no guarantee of future results.